

Abstract
The thymoleptic drug citalopram (CIT) belongs to the selective serotonin reuptake inhibitors (SSRIs) and is today extensively used in psychiatry. Further clarification of the enantiomer-selective distribution of racemic CIT in both clinical and toxic doses is highly warranted.
By a steady-state in vivo paradigm, rats underwent chronic systemic exposure for 10 days by using osmotic pumps and the total as well as the individual distributions of the S- and R-enantiomers of CIT, and its metabolites in serum and two different brain regions, were analysed.
In serum, the S/R ratios in the groups treated with 10, 20, or 100 mg kg−1 day−1 were 0.94, 0.83, and 0.34, respectively. The ratios were almost the same in the brain regions.
In the group treated with 100 mg kg−1 day−1, the serum and brain total CIT levels were found to be 20 times and 6 – 8 times higher than in the rats treated with 10 or 20 mg kg−1 day−1, respectively. In all groups, the CIT levels were higher in brain tissue as compared to serum.
In a spontaneous open-field behavioural test, a correlation between clinical and toxic drug concentrations was observed.
In conclusion, the R-enantiomer was present in an increased proportion compared with the S-enantiomer when higher steady-state CIT concentration was prevailing. This is of particular interest, since the S-enantiomer is responsible for the inhibition of serotonin reuptake in vitro. The present data may be of importance, as full understanding on where different racemic or enantiomeric drug effects of CIT and its main metabolites are unravelled.
Keywords: Citalopram, enantioselective drug analysis, open-field behaviour, pharmacokinetics, toxic dose
Introduction
Modern pharmacotherapy is one of the cornerstones in the treatment of affective psychiatric disorders, including major depressive disorder (MDD), the latter being a well defined entity belonging to one of the overall largest morbidity/mortality health care found in modern medicine (Boerner & Möller, 1999). During the last decade, the clinical use of monoamine-active drugs has increased. Today there is fortunately access to a great variety of this type of drugs to counteract MDD as well as other affective diseases, e.g. obsessive compulsive disorder, panic attacks, and other anxiety disorders (Preskorn, 1995; Rickels & Schweizer, 1990). Pharmacodynamically (PD), these thymoleptic drugs act directly through affecting/enforcing the monoamine neurotransmitter systems, often primarily by a potent reuptake inhibition of neuronally released serotonin (5-hydroxytryptamine; 5-HT) and/or noradrenaline (NA). Of modern thymoleptics, the selective serotonin reuptake inhibitors (SSRIs) are a group of drugs often considered as first-line therapy for treating MDD due to a clinical combination of a rather advantageous side-effect profile and documented efficacy compared with older monoamine-active drugs like the tricyclic/tetracyclic antidepressants (TCAs) (Andrews & Nemeroff, 1994).
Despite a general positive clinical psychopharmacological development during the last decade, several relevant pharmacokinetic (PK) factors for the more recent thymoleptics have been grossly neglected for an adequate scrutiny in living paradigms. Such factors include the definition of the concentrations of both racemic and enantioselective drug components in different body compartments, e.g. in blood and brain, both of parent drug and its major metabolites. It has been pointed out that focusing only on PK outcome of the total sum of two enantiomers and such concentration-effect relationship, may lead to the generation of erroneous data and misleading interpretations for the individual enantiomers occurring in vivo (Evans et al., 1988).
In this context, it is noteworthy that for almost a decade now the most commonly used thymoleptic drug in Sweden, citalopram (CIT; Cipramil®) (Personne et al., 1997), is administered as a racemate without sufficient data available on the enantiomer-specific outcome of this procedure. Further, CIT is considered the most selective of the currently clinical available SSRIs, having no, or very little, affinity for NA or dopamine uptake sites, and CIT is believed not to inhibit monoamine oxidase (Hyttel et al., 1995). Still, the two enantiomers of CIT are known to possess somewhat different degrees of PD-activities (Hyttel et al., 1992), and the major CIT metabolites, demethylcitalopram (DCIT) and didemethylcitalopram (DDCIT), are also known to encounter 5-HT reuptake inhibiting properties (Hyttel, 1977). From the scarce literature available, it seems that mainly the S-enantiomers of CIT and DCIT are responsible for the clinically relevant 5-HT reuptake inhibiting properties of the drug (Hyttel et al., 1992). Further scrutiny of the enantiomeric outcome in steady-state conditions is therefore highly warranted.
Even if the SSRIs are considered less toxic compared with the TCAs, risks of developing serious side effects such as ECG abnormalities and convulsions have been evidenced for CIT as a consequence of larger ingested doses by patients (Grundemar et al., 1997; Personne et al., 1997). Furthermore, fatal overdoses have been reported where CIT alone was the cause of death (Worm et al., 1998; Öström et al., 1996). Overall, very little data are available describing toxicity aspects for any of the presently extensively used SSRIs when administered in high/toxic doses to rats, although recently toxicokinetic data for older types of antidepressants (i.e. TCAs) are being published (Darcy et al., 1999).
The main aim of the present investigation was to acquire enantiomer-specific data from blood and brain in clinically relevant and toxic doses of the commonly used SSRI CIT after chronic systemic exposure of the racemic compound by using osmotic pumps. Further, an overall estimate of the drug distribution between serum and brain in steady-state were sought on these doses. To do this, an in vivo rat experimental setting was used for practical, ethical, and economical reasons. By this study design, the interpretation of data had to focus on a conceptual rather than strict conclusive level in relation to the relevant clinical context. Finally, using the in vivo animal paradigm, the main clinical outcome of the sustained drug challenges was documented by recordings of spontaneous open-field behavioural performances.
Methods
Experimental design
Before the start of the experiment, the rats were allowed to recuperate for 1 week from stress induced by transport. Thereafter, a body weight adjusted chronic drug treatment was conducted by using osmotic pumps (for dosage and implantation; see below). The pumps were filled with either one of three different doses of CIT (HBr salt; 10, 20, and 50 mg kg−1 day−1) or a mixture of 0.9% NaCl and propylene glycol (40 : 60; vol vol−1), the latter in which CIT was dissolved (i.e. the drug vehicle). To reduce the non-uniform outflow, rendering high drug concentration and thereby risk of tissue necrosis, duplicate pumps were implanted on the back of the rats exposed to a toxic level of drug with a concentration of 50 mg kg−1 day−1 in each pump. Four experimental groups of rats denoted as control (i.e. 0.9% NaCl and propylene glycol; n=6), CIT-10 (i.e. racemic CIT 10 mg kg−1 day−1; n=9), CIT-20 (i.e. racemic CIT 20 mg kg−1 day−1; n=9), and CIT-100 (i.e. racemic CIT 100 mg kg−1 day−1; n=8) were separately investigated. Nine days after the osmotic pump implantation, the rats were subjected to behavioural testing during 1 h at daytime (see below). The day after the behavioural test (the 10th day of drug treatment), the rats were killed by decapitation under halothane anaesthesia. Thereafter, the total concentration of S- plus R-enantiomers (in the following text only referred as total concentrations), as well as the enantiomer-selective ratios of CIT and major metabolites in blood serum and two brain regions, were analysed. The study was performed under approval of the Animal Ethics Committee at Lund University.
Animals
Male Sprague-Dawley rats (M&B A/S, Ry, Denmark) initially weighing around 250 g were used for the experiments. The animals had free access to tap water and standard laboratory pelleted chow containing 18% crude protein (Altromin No 1324; Chr. Peterson A/S, Ringsted, Denmark) throughout the entire study. The rats were housed in groups of two or three animals in macrolone cages (40×25×15 cm) with sawdust bedding that was changed twice weekly. Room temperature was kept at 20 – 22°C with a relative humidity of 30 – 40%. The rats were kept in a constant 12 : 12 h light : dark cycle with lights on at 0600 to 1800 h. The rats were weighed on the day of the pump implantation, after 5 days, and after 10 days, when the rats were killed.
Osmotic pump preparation and implantation
Osmotic pumps (ALZET® model 2ML2; B&K Universal AB, Sollentuna, Sweden) were filled with 2000 μl either of one of the three drug solutions or of the drug vehicle. Thereafter, the pumps were primed by placing them in a beaker containing 0.9% NaCl in a water-bath at 37°C overnight. By this procedure, the pumping rate reached steady-state before the implantation. The pumps were surgically implanted subcutaneously on the back of the rats by a minor skin incision between the scapulae under halothane anaesthesia (Fluothane®, Zeneca Ltd., Macclesfield, Cheshire, U.K.). A subcutaneous pocket was formed by blunt dissection of the connective tissue, after which the pumps were inserted. The skin incision was closed with absorbable sutures and the total implantation time of each pump was approximately 10 min. The concentration of the CIT solution was calculated in such a way as to continuously administer a similar dose kg−1 body weight to the rats for 10 days with the infusion rate 5 μl h−1, by using the weight gain curves from similar rats in earlier studies (see e.g. Wikell et al., 1999). The pumps were left in place throughout the entire study (i.e. for 10 days) and hence, there was no drug washout period before the rats were killed by decapitation.
Open-field behavioural test
The open-field behavioural test was conducted 9 days after the osmotic pump implantation in seven automated contact-free computer-programmed chambers constructed to measure locomotion and rearing activities as previously described in detail (Apelqvist et al., 1997; 1998). The rats were tested in a random order within each of the four experimental groups and subjected to behavioural test during 1 h, from 1100 to 1200 h.
In brief, spontaneous activity was automatically recorded inside closed boxes by video cameras, which were connected to a computer in which the behavioural data were logged in to a separate file. The rearing activity was detected by infrared detectors placed in the box walls. The rats were made visible to the cameras by infrared light during the whole test. Fluorescent light tubes suspended over the boxes illuminated the test environment. The computer processing system made it possible to calculate locomotion activity (i.e. the distance the rats travelled inside the chambers; cm) and rearings (i.e. when the rats were standing on their hind limbs; number) from the logged-in raw data. In this trial, only movements of minimally 6 cm were considered as locomotion (i.e. non-ambulatory movements such as shaking and grooming were ruled out).
Termination of the in vivo experiment
After the behavioural testing, the rats were killed by decapitation with a guillotine and mixed arterio-venous blood was collected from the neck wound. The blood samples were left to clot for 30 min followed by centrifugation (2000×g for 10 min) for collection of the supernatant serum, that was transferred into a new empty test tube. Immediately after killing, the brain was removed from the scull and the neocortical hemisphere as well as the mesencephalon-pons region was dissected out as previously described (Bengtsson et al., 1988). The brain tissue samples were weighed, then homogenized in 2 ml Milli-Q® water (Millipore AB, Sundbyberg, Sweden) using sonification (Model B-30; Branson Sonic Power Company, Danbury, CT, U.S.A.), and finally, centrifuged at 2000×g for 15 min at 4°C. The serum and brain samples were stored at −70°C until the drug analyses were performed.
Determination of total concentrations of citalopram and metabolites
The total concentrations of CIT, DCIT, and DDCIT in serum and brain homogenate were determined by high performance liquid chromatography (h.p.l.c.) with fluorescence detection as previously described (Carlsson & Norlander, 1997). In short, CIT, DCIT, and DDCIT were extracted from calibration standards, control solutions, brain supernatants, and rat serum with solid-phase extraction using Isolut® C2 extraction columns (International Sorbent Technology, Hengoed, U.K.). An internal standard (Lu 10-202-O) was added to each sample prior to the extraction. After elution and evaporation, the dried samples were redissolved in 100 μl of the mobile phase (acetonitrile:70 mmol l−1 phosphate buffer pH 4.5; 40:60; filtered through a 0.22 μm filter) before the h.p.l.c. analysis (for more details, see Carlsson & Norlander, 1997). A volume of 40 μl of the purified serum or purified brain tissue samples was injected to the h.p.l.c. system with a 717 automatic injector (Waters Corporation, Milford, MA, U.S.A.). The mobile phase was delivered through a Varian 2510 pump (Palo Alto, CA, U.S.A.) and the compounds were separated on a Nova Pak phenyl column RCM (100×8 mm; 4 μm particles; Waters) with a Nova Pak phenyl guard-column (4 μm, Waters) at a flowrate of 3.0 ml min−1. CIT and metabolites were detected by 235 nm excitation and 290 nm emission wavelengths, respectively, using a LS-40 fluorescence detector (Perkin-Elmer, Norwalk, CT, U.S.A.). The detection signals were recorded and processed with the chromatography data system EZ Chrom (Version 6.5; Scientific Software Inc., Pleasanton, CA, U.S.A.). The limits of detection for CIT and its metabolites were 3 nmol l−1 (S/N ratio=3), respectively.
Determination of the S/R ratios for the enantiomers of citalopram and metabolites
The S/R ratios for CIT, DCIT, and DDCIT in serum and brain homogenate were determined by means of a h.p.l.c. based technique as described previously (Rochat et al., 1995a) with some modifications. The chiral separations of CIT, DCIT, and DDCIT were optimized by response surface methodology (Carlsson & Norlander, 2001). Moreover, the enantiomeric extraction procedure differed from the non-chiral analysis described above (Carlsson & Norlander, 1997) and the different steps are thus described hereafter. In the present extraction procedure the 25 mmol l−1 phosphate buffer pH 11.5 was changed to 30 mmol l−1 sodium hydroxide in all extraction steps. The columns were washed and dried according to the non-chiral extraction procedure (Carlsson & Norlander, 1997). One hundred μl of 10 mmol l−1 citric acid was added to glass tubes, in which the purified samples were eluted by adding 2 ml of 2.5% ammonia in acetonitrile to the columns and left for 5 min, after which the solvent still on the column was drawn through at 15 – 35 kPa. Thereafter, additional 2 ml of 2.5% ammonia in acetonitrile was added and drawn through. The eluates were evaporated with nitrogen at 50°C and the samples were reconstituted in 100 μl of the mobile phase (methanol : 10 mmol l−1 citrate triethylamine buffer pH 6.3; 56:44) and 50 μl was injected. All samples were injected to the h.p.l.c. system using a 717 autosampler (Waters Corporation, Milford, MA, U.S.A.). The mobile phase was delivered through a Gynkotek 480 pump (Dionex, Sunnyvale, CA, U.S.A.) and the compounds were separated on a Cyclobond I 2000 Ac 250×4.6 mm column (Astec, Whippany, NJ, U.S.A.) protected with an in-line filter (Jour Research, Onsala, Sweden) at 0.8 ml min−1. CIT, DCIT, and DDCIT were detected by 240 nm excitation and 300 nm emission wavelengths, respectively, using a 474 fluorescence detector (Waters Corporation). The height of the peaks was recorded and processed with the chromatography data system EZ Chrom (Scientific Software Inc., Pleasanton, CA, U.S.A.). The S/R CIT, S/R DCIT, and S/R DDCIT ratios were calculated by comparing the height of the peaks as obtained in the h.p.l.c. chromatograms.
Statistics
All values were expressed as means, and where it was relevant±standard error of the means (s.e.means). A probability of less than 5% (P<0.05) was preset in all statistical comparisons to indicate a significant difference between groups. When two dependent groups were compared, a two-tailed Student's t-test for paired observations was applied. When more than two independent groups were compared, the data were subjected to a one factor analysis of variance (ANOVA). When the ANOVA reached statistical significance, Fisher's protected least significant difference (PLSD) post-hoc test was applied to determine which groups differed. The possible correlation between two factors was studied by subjecting the data to a simple regression analysis. All statistical analyses were performed using the computer software StatView® for Windows Version 5.0 (SAS® Institute Inc., Cary, NC, U.S.A.).
Results
Body weight and toxic effects
At the time of the pump implantation, there were no significant differences in body weight between any of the groups (control, 252±6 g; CIT-10, 256±7 g; CIT-20, 262±7 g; CIT-100, 259±3 g). After 5 days of treatment, the CIT-100 rats weighed less (243±3 g; P<0.0001) compared with the three other groups (control, 283±6 g; CIT-10, 287±5 g; CIT-20, 289±8 g). Even though the CIT-100 rats did not exceed their preoperative weight during the study, this group followed the same weight gain curves as the three other groups from day 5 to day 10 demonstrating an anabolic state of the animals. At the time of killing, the CIT-100 rats had gained in postoperative body weight but still weighed less (256±5 g; P<0.001) in comparison with the other groups (control, 299±5 g; CIT-10, 297±3 g; CIT-20, 300±6 g). At termination of the experiment, minimal signs of beginning necrosis were found on the back of three out of eight rats in the CIT-100 group. In these three rats, no differences in behavioural performance or, subsequently, in serum or brain levels of CIT, DCIT, and DDCIT were seen compared with data from the other five rats in the CIT-100 group.
Total concentrations of citalopram and metabolites
The total concentrations of CIT, DCIT, and DDCIT in serum, cortex and mesencephalon-pons are displayed in Table 1. The relationship between the total concentrations of CIT in serum and brain regions is presented in Figure 1a – c. The main findings from Table 1 and Figure 1 are summarized below.
Table 1.
Total (S+R) concentrations and enantiomeric ratios (S/R) of citalopram (CIT), demethylcitalopram (DCIT), and didemethylcitalopram (DDCIT) in serum (nmol 1−1), cortex (Ctx; pmol g−1≈nmol 1−1), and mesencephalon-pons (Mes; pmol g−1≈gt;nmol 1−1)
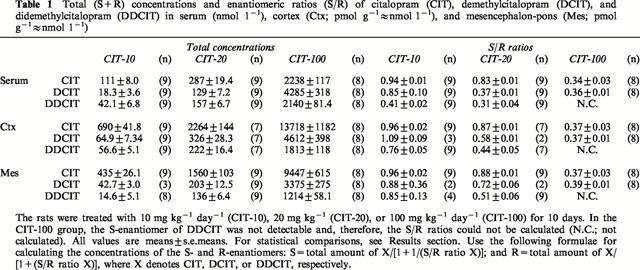
Figure 1.
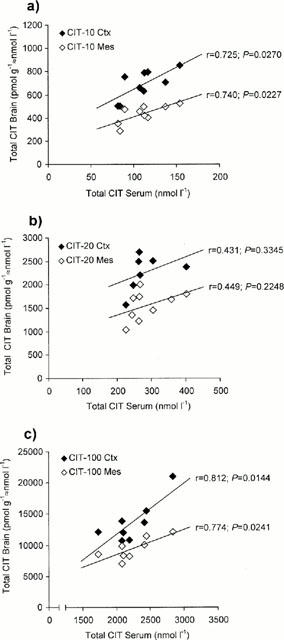
Plot of the concentrations of the total sum of the S- plus R-enantiomers of citalopram (CIT) obtained for serum versus brain in rats treated with (a) 10 mg kg−1 day−1 (CIT-10); (b) 20 mg kg−1 day−1 (CIT-20); and (c) 100 mg kg−1 day−1 (CIT-100) for 10 days. Closed boxes denote serum versus cortex (Ctx) and open boxes denote serum versus mesencephalon-pons (Mes). (r=coefficient of correlation).
Total serum concentrations
At the time of killing, the total CIT levels were markedly elevated in the CIT-100 rats as compared to both the CIT-10 and CIT-20 groups in serum (Table 1; P<0.0001). In the CIT-100 rats, the CIT levels were found to be about 20 and eight times higher compared with the CIT-10 and CIT-20 rats, respectively. Furthermore, the chronic CIT challenge resulted in about 2.5 times higher amount of CIT in the CIT-20 group compared with the CIT-10 group (P=0.0560).
In the CIT-10 rats, the serum CIT concentrations were around six and three times higher than the DCIT and DDCIT concentrations, respectively (P<0.0001). In the CIT-20 rats, the CIT levels were approximately two times higher than both the DCIT and DDCIT levels (P<0.0001). The levels of DCIT in the CIT-100 rats were almost twice as high as the CIT levels (P<0.0001), while DDCIT was seen in about the same proportion as CIT (P=0.2637).
Total brain concentrations
In line with the total serum concentrations, the total CIT concentrations in the brain regions were markedly elevated in the CIT-100 rats as compared to both the CIT-10 and CIT-20 groups (Table 1; P<0.0001 in all comparisons). The CIT concentrations in the two brain regions were found to be around 20 and six times higher in the CIT-100 group compared with the CIT-10 and CIT-20 groups, respectively. Furthermore, the chronic CIT challenge resulted in around 3.5 times higher amount of CIT in the CIT-20 rats compared with the CIT-10 rats (P=0.1227 in cortex and P=0.0229 in mesencephalon-pons). In all CIT groups, the CIT levels were 1.5 – 2 times higher in cortex compared with the levels in mesencephalon-pons (CIT-10, P<0.0001; CIT-20, P=0.0040; CIT-100, P=0.0004).
In all CIT treated groups, the total DCIT and DDCIT concentrations were found to be lower as compared to the CIT concentrations (P<0.0001 in all cases except for the comparison between CIT and DCIT in mesencephalon-pons in the CIT-10 group, P=0.0070). The DCIT concentrations in all the groups were approximately 1.5 times higher in the cortex region than in mesencephalon-pons (CIT-10, P=0.1282; CIT-20, P=0.0026; CIT-100, P=0.0002). The DDCIT levels were also higher in cortex when comparing to the levels in mesencephalon-pons (CIT-10, P<0.0001; CIT-20, P=0.0025; CIT-100, P=0.0001).
Total serum concentrations versus total brain concentrations
In all three groups, the total CIT levels were constantly higher in the brain tissue compared with the levels in serum (Table 1; P<0.0001 in all comparisons). The ratios between the CIT concentrations in serum and the two brain regions were about the same in all the drug treated groups (data retrievable from Table 1). There was a significant correlation between the CIT concentrations in serum and the CIT concentrations in cortex and mesencephalon-pons in the CIT-10 and CIT-100 groups (Figure 1a,c). In the CIT-20 group, the serum levels also tended to correlate with the brain levels, but no statistical significance was reached (Figure 1b).
S/R ratios of citalopram and metabolites
The S/R ratios of CIT, DCIT, and DDCIT in serum, cortex and mesencephalon-pons are shown in Table 1. The relationship between the total concentrations of CIT and the S/R ratios in serum is presented in Figure 2. The main findings from Table 1 and Figure 2 are summarized below.
Figure 2.
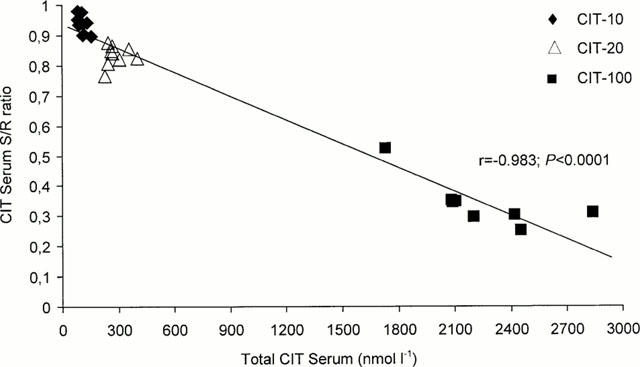
Plot of the correlation between the serum concentrations of the total sum of the S- plus R-enantiomers of citalopram (CIT) and the S/R ratios of CIT in rats treated with 10 mg kg−1 day−1 (CIT-10), 20 mg kg−1 day−1 (CIT-20), and 100 mg kg−1 day−1 (CIT-100) for 10 days. (r=coefficient of correlation).
Serum and brain S/R ratios
In serum, the S/R CIT ratios in the CIT-10, CIT-20, and CIT-100 rats were 0.94, 0.83, and 0.34, respectively (Table 1). The differences between the groups were all statistically significant (P<0.0001 in all cases except for the comparison between the CIT-10 and CIT-20 groups, P=0.0004). In the two brain regions, the distribution of the S- and R-enantiomers was almost the same as in serum. Accordingly, in all three compartments investigated, the R-enantiomer was present in higher amount compared with the S-enantiomer when the CIT dose was increased.
The serum S/R DCIT ratios in the groups were in line with the serum S/R CIT ratios, with the exception of the CIT-20 group that showed a lower S/R DCIT ratio compared with S/R CIT ratio (0.37 versus 0.83, P<0.0001). Similar results were also seen in the brain, but the S/R DCIT ratios in the CIT-20 rats were not so low as in serum (0.58 in cortex and 0.72 in mesencephalon-pons). Generally, the S/R DDCIT ratios in all the compartments were lower compared with the S/R CIT and S/R DCIT ratios (P-values ranging from P<0.0001 to P=0.3875). In the CIT-100 group, the S-enantiomer of DDCIT in serum and in the brain regions was not detectable and, therefore, the S/R ratios could not be calculated.
Total serum concentrations versus serum S/R ratios
The relationship between the total serum CIT concentrations and the serum S/R ratios is shown in Figure 2. As seen in this graph, the proportion of S-enantiomer decreased with increasing total concentration of CIT in serum.
Open-field behavioural activity
The spontaneous forward locomotion performance was found to be lower of the CIT-100 rats versus the CIT-10 (P=0.0105) and CIT-20 rats (P=0.0229), respectively. Comparing the three drug treated groups with the control rats, no statistically significant differences in locomotion between the groups were seen (CIT-10, P=0.1748; CIT-20, P=0.2681; CIT-100, P=0.2327). Further, no statistically significant differences could be detected between any of the four groups concerning the rearing activity. The correlation between the serum CIT concentrations and open-field locomotor activities is shown in Figure 3. A statistically significant concentration-effect relationship was seen between the three CIT-treated groups during the 1 h test-period (r=−0.588; P=0.0051).
Figure 3.
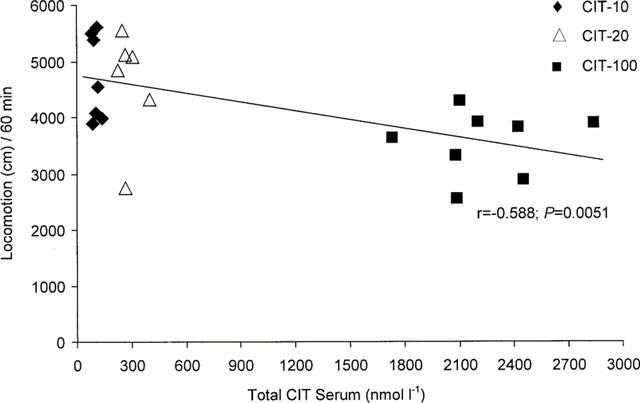
Plot of the correlation between the serum concentrations of the total sum of the S- plus R-enantiomers of citalopram (CIT) and the open-field locomotor activity during 60 min at daytime of rats treated with 10 mg kg−1 day−1 (CIT-10), 20 mg kg−1 day−1 (CIT-20), and 100 mg kg−1 day−1 (CIT-100) for 10 days. (r=coefficient of correlation).
Discussion
The achieved concentration outcome in this study proved successful based on the doses applied for resembling the human situation of two clinical-relevant doses and one toxic dose of CIT. The main detailed observations made were: (1) the different distribution of the enantiomers in the three CIT treated groups; (2) the non-proportional total CIT PK relationship between the three CIT treated groups; (3) the constantly higher CIT levels in the two investigated brain regions as compared to the levels in serum; and (4) the statistically significant correlation between clinical and toxic drug concentrations versus the locomotor activity.
The present data on the S/R enantiomeric ratios of CIT and its main metabolites DCIT and DDCIT can to the best of our knowledge only be compared with one other published animal experimental study (Wikell et al., 1999). The mean serum S/R ratio of CIT in the CIT-10 rats was in line with the previous results by Wikell et al. (1999), where rats were chronically treated with CIT for 2 weeks with 10 mg kg−1 daily using subcutaneously implanted osmotic pumps. The S/R ratios of CIT from the groups treated with clinical doses of CIT (i.e. the CIT-10 and CIT-20 groups) can also be compared with S/R CIT ratios from human studies (Foglia et al., 1997; Rochat et al., 1995a, 1995b; Sidhu et al., 1997; Zheng et al., 2000). Our data were not in complete agreement with these studies, where the mean S/R CIT ratios were found in the 0.5 – 0.7 interval, indicating that the R-enantiomer of CIT was present in higher proportion compared with our data. One explanation of the different S/R ratios in human versus rats may be the differences in species.
The S/R ratios for DCIT in the CIT-10 group were a little lower compared with the S/R ratios for CIT. This result opposites the human studies, where the S/R DCIT ratios were somewhat higher than the S/R CIT ratios (Foglia et al., 1997; Rochat et al., 1995a, 1995b; Sidhu et al., 1997; Zheng et al., 2000). Surprisingly, the serum S/R DCIT ratios in the CIT-20 rats were much lower than the serum S/R CIT ratios (0.37 versus 0.83). However, these results are in accordance with the study by Wikell et al. (1999). The S/R ratios for CIT and its metabolites were relatively equal in serum and in the brain and were also almost in line with previous data (Wikell et al., 1999). However, it should be noted that some of the brain S/R DCIT and S/R DDCIT ratios in the CIT-10 and CIT-20 groups were calculated from low n values.
Our novel toxic data on the S/R enantiomeric ratios of CIT, DCIT, and DDCIT are not similar to either data from rats treated with clinical-relevant doses or data from clinical studies. In the CIT-100 group, the serum and brain S/R ratios of CIT were 3 fold lower than in the CIT-10 group. Accordingly, the R-enantiomer was present in higher amount compared with the S-enantiomer when higher concentration of CIT was prevailing. These observed differences in S/R ratios were not due to the osmotic pump delivery system. Another animal experiment, including the same three CIT treated groups and one control group, has shown that the ratios between the S- and R-enantiomers of CIT were the same in the pump solutions before and after the experiment. The amount of residual drug and vehicle solutions was consistently found to be of similar magnitude (around 700 μl) in all four groups, evidencing that the rats received the programmed daily dose (unpublished observations). Since this is the first study that present such data on the S/R ratios, it is difficult to elucidate the mechanisms behind these new results. It is conceivable that the observed low S/R ratios depend on the high chronic exposure of CIT and, therefore, it is possible that if CIT had been given as an acute challenge the S/R ratios had been different. However, clearly chronic exposure is superior to acute exposure also in animal studies when mimicking the clinical situation. Another possible explanation of the observed differences in S/R ratios is, that the enzymes involved in the metabolism of CIT, e.g. the cytochrome P450 (CYP) enzymes, favour a more rapid demethylation of the S-enantiomer (Olesen & Linnet, 1999). It is also of interest to note, that Rochat et al. (1999) showed that CIT crosses the blood-brain barrier via a non-stereoselective carrier-mediated mechanism. This can explain the relatively equal distribution of the enantiomers in blood and brain.
When comparing the total CIT PK outcome of the three doses given in the present study, it turned out to be non-proportional. In contrast to the study by Fredricson Overø (1982a), we did not observe a 10 fold increase in drug concentration when the dose was increased 10 times. The observed total CIT PK outcome was non-proportional to the same extent in both blood and brain (i.e. the concentrations in blood reflected the concentrations in brain). A likely explanation to this non-proportional relationship is that the CYP enzymes involved in the metabolism of CIT may have reached a level of saturation. It should be noted, though, that only when the concentrations of the S-enantiomer of CIT are considered, the PK outcome is found to be rather proportional. However, it must be recalled, that the in vivo activities of the S- and R-enantiomers of CIT as well as its metabolites are still far from fully investigated, prompting us today only to speculate on the relative importance for all these retrievable compounds in real life.
The total concentrations of CIT in serum in the rats treated with 10 mg kg−1 day−1 where in accordance with a study by Wikell et al. (1999). It is noteworthy, that the serum CIT concentrations around 100 nmol l−1 were also observed in humans receiving repeated oral dosing within a normal dose range (5 – 50 mg once daily for 4 weeks; Bjerkenstedt et al., 1985). The CIT concentrations in the rats treated with 20 mg kg−1 day−1 were in agreement with concentrations found by Melzacka et al. (1984), who administered CIT orally in a dose of 10 mg kg−1 at 12 h intervals for 2 weeks to rats. Furthermore, Hyttel et al. (1984) reported on plasma concentrations of 250 – 450 nmol l−1 after CIT have been given in the diet (10 and 40 mg kg−1 daily for 13 days) or orally (40 mg kg−1 daily for 14 days). In the rats treated with 100 mg kg−1 day−1 for 10 days, very high levels of CIT were found in serum and the brain. These results cannot be easily compared with data from similar types of studies, since such investigations to the best of our knowledge have not yet been performed. A previous study on repeated administration of two CIT doses (32 and 320 mg kg−1 day−1) for 4 weeks to rats, though, reported mean CIT concentrations of 285 nmol l−1 and 3310 nmol l−1, respectively (Fredricson Overø, 1982a), when the racemic drug was administered via the diet. In animal safety studies over 1 – 2 years, rats were given the CIT doses 80 and 120 mg kg−1 daily, also via the diet, plasma levels of about 2000 – 4000 nmol l−1 were reached (Fredricson Overø, 1989). Besides the animal studies, our toxic racemic data can be compared with a clinical study including forensic cases by Worm et al. (1998). Given the limitations of post mortem data, Worm et al. (1998) found toxic whole blood concentrations of CIT in autopsy cases, where CIT was not considered the cause of death, which were in agreement with our total serum concentrations from the CIT-100 rats. It may therefore be concluded, that in the present study, a relevant non-fatal toxic dose of CIT has been achieved.
The total serum and brain levels of the main metabolites DCIT and DDCIT in the CIT-10 rats were found in similar amounts as in an earlier report (Wikell et al., 1999). The CIT/metabolite ratios in the CIT-20 rats were decreased in comparison with the ratios in the CIT-10 rats, indicating that the metabolites were not degraded to the same extent when the CIT-dose was increased. This finding was further stated in the CIT-100 group, which displayed higher serum DCIT levels than serum CIT levels. Furthermore, the serum levels of DDCIT were almost the same as the serum levels of CIT. In relation to the parent compound, less metabolite concentrations were found in the brain as compared to in serum. This indicates, that DCIT and DDCIT penetrate the blood – brain barrier less readily than CIT, which are in agreement with others (Caccia, 1998; Fredricson Overø, 1989; Wikell et al., 1999).
The uneven distribution of CIT in the blood and brain was in line with results presented by others (Melzacka et al., 1984; Wikell et al., 1999). Since CIT has a high volume of distribution in both man (Fredricson Overø, 1982b; Joffe et al., 1998) and in different animals (Fredricson Overø, 1982a), more CIT is likely to be found in the tissue compartments, like the brain, than in blood. The CIT concentrations in the cortex region were almost twice as high as in the mesencephalon-pons region. The implication of this finding is hard to discern, but one explanation could be that the blood flow through the two regions might be different. The parenchyma volume may also vary, but more importantly the lipophilicity may vary between the brain regions, and thus, result in different drug concentrations between the brain regions. It should also be noted, that the expression of the CYP-enzymes are present in the brain as well as in the liver (Ravindranath et al., 1995; Voirol et al., 2000; Warner et al., 1988).
In the behavioural test, where locomotor and rearing activities of the rats were measured, CIT appeared to affect the rats in different ways depending on the given dose. Accordingly, a statistically significant concentration-effect relationship in locomotor activity between the drug treated groups was observed. The rats treated with 100 mg kg−1 daily displayed a decreased activity during the testing period compared with the other CIT treated rats. The CIT-100 rats displayed a marked body weight loss compared with the other groups during the entire study, which could have affected the rats in a negative way. Furthermore, the reduced activity observed may also be attributed to a toxic effect of CIT. However, no differences in behavioural activities were seen when comparing all the CIT-treated groups with the control rats. This finding coincide with the results by Wikell et al. (1999), but it should be noted, that in the mentioned study the behaviour was tested at night.
In summary, the S- and R-enantiomers of CIT and metabolites were distributed differently in the three drug treated groups. The total CIT PK relationship between the different CIT doses was equally non-proportional in blood and brain, and CIT was unevenly distributed in the three compartments investigated. Furthermore, the behavioural test resulted in a statistically significant correlation between clinical and toxic drug concentrations versus the locomotor activity. Since this is the first study reporting enantiomer-specific findings of chronic toxic dose administration of CIT by using osmotic pumps, additional studies regarding this drug are warranted in order to further elucidate the PK and behavioural alterations observed after administration of high/toxic doses. This type of experimental design, where PK parameters like drug concentrations and S/R ratios in different compartments are scrutinized and also correlated to animal behaviour, may be a useful tool to acquire complementary information for improving drug safety in clinical psychiatry. Clearly, though, the potential species differences make direct transferral of such results to the human situation impossible, the conceptual insights demasked from in vivo animal experimentation may still possess an invaluable source of information in the continuation of CNS drug development in the important post-marketing phase.
Acknowledgments
The generous supply of citalopram by H. Lundbeck A/S, Copenhagen-Valby, Denmark, is gratefully acknowledged. This original work was supported by grants from the Swedish Medical Research Council (14X-012598; FB), Östergötland County Council, the Faculty of Health Sciences, Linköping University, the Director Albert Påhlsson Foundation, the Crafoord Foundation, the Fredrik and Ingrid Thuring Foundation, the Magnus Bergvall Foundation, and the Swedish Society for Medical Research.
Abbreviations
- CIT
citalopram
- DCIT
demethylcitalopram
- DDCIT
didemethylcitalopram
- PD
pharmacodynamic
- PK
pharmacokinetic
- SSRI
selective serotonin reuptake inhibitor
References
- ANDREWS J.M., NEMEROFF C.B. Contemporary management of depression. Am. J. Med. 1994;97:24S–32S. doi: 10.1016/0002-9343(94)90360-3. [DOI] [PubMed] [Google Scholar]
- APELQVIST G., HINDFELT B., ANDERSSON G., BENGTSSON F. Central vs peripheral spontaneous behavioral abnormalities in experimental hepatic encephalopathy. Physiol. Behav. 1997;61:851–856. doi: 10.1016/s0031-9384(96)00565-3. [DOI] [PubMed] [Google Scholar]
- APELQVIST G., HINDFELT B., ANDERSSON G., BENGTSSON F. Diurnal and gender effects by chronic portacaval shunting in rats on spontaneous locomotor and rearing activities in an open-field. Behav. Brain Res. 1998;93:25–32. doi: 10.1016/s0166-4328(97)00132-0. [DOI] [PubMed] [Google Scholar]
- BENGTSSON F., BUGGE M., BRUN A., FALCK B., HENRIKSSON K.G., NOBIN A. The impact of time after portacaval shunt in the rat on behavior, brain serotonin, and brain and muscle histology. J. Neurol. Sci. 1988;83:109–122. doi: 10.1016/0022-510x(88)90024-x. [DOI] [PubMed] [Google Scholar]
- BJERKENSTEDT L., FLYCKT L., OVERØ K.F., LINGJAERDE O. Relationship between clinical effects, serum drug concentration and serotonin uptake inhibition in depressed patients treated with citalopram. A double-blind comparison of three dose levels. Eur. J. Clin. Pharmacol. 1985;28:553–557. doi: 10.1007/BF00544066. [DOI] [PubMed] [Google Scholar]
- BOERNER R.J., MÖLLER H.J. The importance of new antidepressants in the treatment of anxiety/depressive disorders. Pharmacopsychiatry. 1999;32:119–126. doi: 10.1055/s-2007-979217. [DOI] [PubMed] [Google Scholar]
- CACCIA S. Metabolism of the newer antidepressants. An overview of the pharmacological and pharmacokinetic implications. Clin. Pharmacokinet. 1998;34:281–302. doi: 10.2165/00003088-199834040-00002. [DOI] [PubMed] [Google Scholar]
- CARLSSON B., NORLANDER B. Solid-phase extraction with end-capped C2 columns for the routine measurement of racemic citalopram and metabolites in plasma by high- performance liquid chromatography. J. Chromatogr. B. 1997;702:234–239. doi: 10.1016/s0378-4347(97)00366-6. [DOI] [PubMed] [Google Scholar]
- CARLSSON B., NORLANDER B.Optimisation and characterisation of the chiral separation of citalopram and its demethylated metabolites by response surface methodology Chromatographia 2001. in press
- DARCY P., DREDGE K., KELLEHIR P., KELLY J.P., LEONARD B.E., CHAMBERS P.L. Acute toxicity profile of maprotiline in the rat. Pharmacol. Toxicol. 1999;85:276–281. doi: 10.1111/j.1600-0773.1999.tb02022.x. [DOI] [PubMed] [Google Scholar]
- EVANS A.M., NATION R.L., SANSOM L.N., BOCHNER F., SOMOGYI A.A. Stereoselective drug disposition: potential for misinterpretation of drug disposition data. Br. J. Clin. Pharmacol. 1988;26:771–780. doi: 10.1111/j.1365-2125.1988.tb05318.x. [DOI] [PMC free article] [PubMed] [Google Scholar]
- FOGLIA J.P., POLLOCK B.G., KIRSHNER M.A., ROSEN J., SWEET R., MULSANT B. Plasma levels of citalopram enantiomers and metabolites in elderly patients. Psychopharmacol. Bull. 1997;33:109–112. [PubMed] [Google Scholar]
- FREDRICSON OVERØ K. Kinetics of citalopram in test animals; drug exposure in safety studies. Prog. Neuropsychopharmacol. Biol. Psychiatry. 1982a;6:297–309. doi: 10.1016/s0278-5846(82)80180-2. [DOI] [PubMed] [Google Scholar]
- FREDRICSON OVERØ K. Kinetics of citalopram in man; plasma levels in patients. Prog. Neuropsychopharmacol. Biol. Psychiatry. 1982b;6:311–318. doi: 10.1016/s0278-5846(82)80181-4. [DOI] [PubMed] [Google Scholar]
- FREDRICSON OVERØ K.The pharmacokinetic and safety evaluation of citalopram from preclinical and clinical data XXII Nordiske Psykiater-kongres 1989Reykjavik: Excerpta Medica; 22–30.ed. Montgomery, S.A. pp [Google Scholar]
- GRUNDEMAR L., WOHLFART B., LAGERSTEDT C., BENGTSSON F., EKLUNDH G. Symptoms and signs of severe citalopram overdose. Lancet. 1997;349:1602. doi: 10.1016/S0140-6736(05)61630-3. [DOI] [PubMed] [Google Scholar]
- HYTTEL J. Neurochemical characterization of a new potent and selective serotonin uptake inhibitor: Lu 10-171. Psychopharmacology (Berl). 1977;51:225–233. doi: 10.1007/BF00431629. [DOI] [PubMed] [Google Scholar]
- HYTTEL J., ARNT J., SÁNCHEZ C. The pharmacology of citalopram. Rev. Contemp. Pharmacother. 1995;6:271–285. [Google Scholar]
- HYTTEL J., BØGESØ K.P., PERREGAARD J., SÁNCHEZ C. The pharmacological effect of citalopram resides in the (S)-(+)-enantiomer. J. Neural. Transm. Gen. Sect. 1992;88:157–160. doi: 10.1007/BF01244820. [DOI] [PubMed] [Google Scholar]
- HYTTEL J., OVERØ K.F., ARNT J. Biochemical effects and drug levels in rats after long-term treatment with the specific 5-HT-uptake inhibitor, citalopram. Psychopharmacology. 1984;83:20–27. doi: 10.1007/BF00427416. [DOI] [PubMed] [Google Scholar]
- JOFFE P., LARSEN F.S., PEDERSEN V., RING-LARSEN H., AAES-JØRGENSEN T., SIDHU J. Single-dose pharmacokinetics of citalopram in patients with moderate renal insufficiency or hepatic cirrhosis compared with healthy subjects. Eur. J. Clin. Pharmacol. 1998;54:237–242. doi: 10.1007/s002280050452. [DOI] [PubMed] [Google Scholar]
- MELZACKA M., RURAK A., ADAMUS A., DANIEL W. Distribution of citalopram in the blood serum and in the central nervous system of rats after single and multiple dosage. Pol. J. Pharmacol. Pharm. 1984;36:675–682. [PubMed] [Google Scholar]
- OLESEN O.V., LINNET K. Studies on the stereoselective metabolism of citalopram by human liver microsomes and cDNA-expressed cytochrome P450 enzymes. Pharmacology. 1999;59:298–309. doi: 10.1159/000028333. [DOI] [PubMed] [Google Scholar]
- ÖSTRÖM M., ERIKSSON A., THORSON J., SPIGSET O. Fatal overdose with citalopram. Lancet. 1996;348:339–340. doi: 10.1016/s0140-6736(05)64513-8. [DOI] [PubMed] [Google Scholar]
- PERSONNE M., SJÖBERG G., PERSSON H. Citalopram overdose-review of cases treated in Swedish hospitals. J. Toxicol. Clin. Toxicol. 1997;35:237–240. doi: 10.3109/15563659709001206. [DOI] [PubMed] [Google Scholar]
- PRESKORN S.H. Comparison of the tolerability of bupropion, fluoxetine, imipramine, nefazodone, paroxetine, sertraline, and venlafaxine. J. Clin. Psychiatry. 1995;56:12–21. [PubMed] [Google Scholar]
- RAVINDRANATH V., BHAMRE S., BHAGWAT S.V., ANANDATHEERTHAVARADA H.K., SHANKAR S.K., TIRUMALAI P.S. Xenobiotic metabolism in brain. Toxicol. Lett. 1995;82–83:633–638. doi: 10.1016/0378-4274(95)03508-7. [DOI] [PubMed] [Google Scholar]
- RICKELS K., SCHWEIZER E. Clinical overview of serotonin reuptake inhibitors. J. Clin. Psychiatry. 1990;51:9–12. [PubMed] [Google Scholar]
- ROCHAT B., AMEY M., BAUMANN P. Analysis of enantiomers of citalopram and its demethylated metabolites in plasma of depressive patients using chiral reverse-phase liquid chromatography. Ther. Drug Monit. 1995a;17:273–279. doi: 10.1097/00007691-199506000-00011. [DOI] [PubMed] [Google Scholar]
- ROCHAT B., AMEY M., VAN GELDEREN H., TESTA B., BAUMANN P. Determination of the enantiomers of citalopram, its demethylated and propionic acid metabolites in human plasma by chiral HPLC. Chirality. 1995b;7:389–395. doi: 10.1002/chir.530070602. [DOI] [PubMed] [Google Scholar]
- ROCHAT B., BAUMANN P., AUDUS K.L. Transport mechanisms for the antidepressant citalopram in brain microvessel endothelium. Brain Res. 1999;831:229–236. doi: 10.1016/s0006-8993(99)01461-4. [DOI] [PubMed] [Google Scholar]
- SIDHU J., PRISKORN M., POULSEN M., SEGONZAC A., GROLLIER G., LARSEN F. Steady-state pharmacokinetics of the enantiomers of citalopram and its metabolites in humans. Chirality. 1997;9:686–692. doi: 10.1002/(SICI)1520-636X(1997)9:7<686::AID-CHIR9>3.0.CO;2-5. [DOI] [PubMed] [Google Scholar]
- VOIROL P., JONZIER-PEREY M., PORCHET F., REYMOND M.J., JANZER R.C., BOURAS C., STROBEL H.W., KOSEL M., EAP C.B., BAUMANN P. Cytochrome P-450 activities in human and rat brain microsomes. Brain Res. 2000;855:235–243. doi: 10.1016/s0006-8993(99)02354-9. [DOI] [PubMed] [Google Scholar]
- WARNER M., KÖHLER C., HANSSON T., GUSTAFSSON J.-Å. Regional distribution of cytochrome P-450 in the rat brain: spectral quantitation and contribution of P-450b,e, and P-450c,d. J. Neurochem. 1988;50:1057–1065. doi: 10.1111/j.1471-4159.1988.tb10573.x. [DOI] [PubMed] [Google Scholar]
- WIKELL C., APELQVIST G., CARLSSON B., HJORTH S., BERGQVIST P.B.F., KUGELBERG F.C., AHLNER J., BENGTSSON F. Pharmacokinetic and pharmacodynamic responses to chronic administration of the selective serotonin reuptake inhibitor citalopram in rats. Clin. Neuropharmacol. 1999;22:327–336. [PubMed] [Google Scholar]
- WORM K., DRAGSHOLT C., SIMONSEN K., KRINGSHOLM B. Citalopram concentrations in samples from autopsies and living persons. Int. J. Legal Med. 1998;111:188–190. doi: 10.1007/s004140050147. [DOI] [PubMed] [Google Scholar]
- ZHENG Z., JAMOUR M., KLOTZ U. Stereoselective HPLC-assay for citalopram and its metabolites. Ther. Drug Monit. 2000;22:219–224. doi: 10.1097/00007691-200004000-00014. [DOI] [PubMed] [Google Scholar]