Abstract
Nitrovasodilators produce characteristic changes in the shape of the peripheral pulse wave. Similar changes might also be caused by alteration of endogenous NO activity, which would allow such activity to be assessed in vivo.
We investigated whether manipulation of the NO pathway influences the pulse waveform, and the mechanisms involved. The pulse wave in the ear of normal rabbits was examined by reflectance photoplethysmography before and during infusion of vasoactive agents. Pulse wave velocity was assessed by using an additional sensor on the rear foot.
A diastolic peak was observed in the ear pulse; its timing was consistent with it being a reflection of the systolic peak from the lower body. The height of the dicrotic notch marking the start of this diastolic wave was decreased by acetylcholine or an NO donor, and further decreased by a phosphodiesterase type V inhibitor. The acetylcholine-induced decreases were blocked by inhibiting NO synthesis with NG-nitro-L-arginine methyl ester (L-NAME) but were unaffected by the inactive enantiomer D-NAME.
These data demonstrate that NO influences the height of the notch in the pulse wave. Heart rate and blood pressure were altered during acetylcholine or L-NAME infusion, but there were no changes in pulse wave amplitude or velocity, or in the timing of the diastolic peak or dicrotic notch. The slope of the pulse wave between the systolic peak and notch changed substantially. These effects are most convincingly explained by changes in wave reflection, not only from the lower body but also from more proximal sites.
Keywords: Pulse wave, dicrotic notch, nitric oxide, wave reflection, photoplethysmography, rabbit
Introduction
It was shown over a century ago that nitrovasodilators alter the peripheral pulse wave, in particular by lowering and exaggerating the point of inflection, termed the dicrotic notch, which occurs between the systolic and diastolic peaks (Murrell, 1879). Many subsequent studies, using either pressure or volume sensors, have confirmed this observation (Dillon & Hertzman, 1941; Imhof et al., 1980; Lund, 1986), but it appears that few, if any, other substances have the same effect. Morikawa (1967), for example, found that the dicrotic notch was affected by organic nitrates and nitrites but not by vasodilator or anti-hypertensive drugs such as dipyridamole, prenylamine, benzylimidazoline, ergot alkaloids, guanethidine or hexamethonium.
Since the action of nitrovasodilators involves the generation of nitric oxide (NO), such data have suggested that the shape of the pulse wave could be used as a simple non-invasive indicator of endogenous NO activity in vivo. Klemsdal et al. (1994) have shown in rabbits that acetylcholine, a stimulator of NO synthesis, reduces the height of the dicrotic notch, expressed as a fraction of the overall amplitude of the wave (‘relative height of the dicrotic notch,' or RHDN). Furthermore, the response to acetylcholine was blunted by hypercholesterolaemia, which impairs endothelial function, and by an inhibitor of NO synthesis. More recently, Chowienczyk et al. (1999) have shown that albutamol, a drug with NO-mediated vasodilator activity (Dawes et al., 1997), reduces RHDN in human subjects. The effect was blunted in type 2 diabetes, another condition associated with endothelial dysfunction, as well as by an NO synthase inhibitor. Aortic wavespeed was not affected.
Before RHDN can be used routinely to indicate vascular function and NO activity, more direct evidence for an effect of the NO pathway and more information about mechanisms are required. Here we describe two trials in rabbits designed to address these issues. The first investigated the effects on RHDN of acetylcholine and an NO donor, and the additional effects of an inhibitor of cyclic GMP degradation and an NO synthase inhibitor. The second investigated mechanisms by determining whether NO-dependent changes in RHDN were accompanied by alteration of pulse wave velocity or amplitude, the timing of the diastolic peak or dicrotic notch, or the slope of the pulse wave between the systolic peak and the notch. A preliminary report of this study has been published (Kengatharan et al., 1999).
Methods
The peripheral pulse wave was measured by reflectance photoplethysmography. In this technique, infrared light is generated by a light-emitting diode placed in contact with the skin, and the intensity of light reflected or back-scattered from the tissue affects a neighbouring photodetector. The technique gives similar results to transmitted light plethysmography (Uretzky & Palti, 1971), which in turn gives traces equivalent to mechanical plethysmography (Dillon & Hertzman, 1941). Hence our measurements indicate blood volume, although the precise transform and the volume sampled are unknown.
All animal procedures complied with Home Office and local regulations. For each rabbit, the sensor was placed approximately halfway along the dorsal surface of one ear. The light emitter and detector straddled the central artery, which lies close to the surface. To aid optical coupling of the sensor to the skin, the ear was shaved and cleaned with ethanol, and the sensor was attached by using electrode stickdiscs (3 M). To optimize signal quality, recordings were made under subdued lighting, the ear was manually supported in an upright position if necessary, and the room temperature was kept at ⩾21°C. Drugs were administered via the marginal vein of the contralateral ear in order to avoid interference with the measurements. Sensor voltages were digitized and recorded by computer. Sensors were a.c.-coupled to the digitiser, and low frequency signals indicating mean blood volume were thus rejected. Precise details of the instrumentation and recording protocols differed between Trials 1 and 2, as described below.
The dicrotic notch (which should not be confused with the incisura caused by aortic valve closure) was often seen as a distinct local minimum in the pulse wave, but it was sometimes apparent only as a change in the gradient of the downslope following peak systole. Therefore, in order to obtain consistency, it was defined as the point where a deviation in this gradient first occurred, even if a true minimum was observed.
Trial 1 protocols
Male New Zealand White rabbits (Highgate Farms, Market Rasen, or Rosemead Rabbit, Essex) of 3 – 4.5 kg were maintained on a standard laboratory diet (Special Diet Services) and housed at 18°C on a 12 h light cycle. Each rabbit was mildly sedated with fentanyl fluanisone (Hypnorm, Janssen, 0.032 mg kg−1 fentanyl citrate and 1 mg kg−1 fluanisone IM) 20 min prior to the experiment. A 2-channel photoplethysmograph (Microlab Stranden, Oslo) was used; it was attached to a PhotoPulse sensor system (16 bit sampling at 1 kHz, Microlab Stranden, Oslo) and a Macintosh computer running Maclab software (AS Instruments).
To help locate the notch, the voltage and the differentiated voltage (dV dt−1) were displayed simultaneously. RHDN was calculated as the height of the wave at the notch divided by the height of the systolic peak, both expressed relative to the lowest part of the pulse wave in the same cardiac cycle. It was obtained for 5 – 10 heart beats before administration of any drugs and for 5 – 10 heart beats during administration, as described below. The RHDN obtained during drug administration was divided by the pre-drug value and the result expressed as a percentage.
To determine the effects of acetylcholine and their dependence on NO synthesis, rabbits were administered a 5 mg bolus and a 10 mg min−1 infusion of the NO synthase inhibitor NG-nitro-L-arginine methyl ester (L-NAME; n=6), its inactive stereoisomer D-NAME (n=4), or vehicle (saline, n=7) for 10 min, followed in each case by a further 5 min with the same infusion to which acetylcholine (2 μg kg−1 min−1) was added. (The total dose of L-NAME was thus >30 mg kg−1). Pulse waves from the end of this period were analysed.
To determine the effects of an NO donor, and to compare them with the effects of endogenous NO synthesis, rabbits were administered acetylcholine (n=5) or sodium nitroprusside (SNP, n=5) at increasing doses (0.5, 1 and 2 μg kg−1 min−1 for 5 min each). To investigate the dependence of these effects on cyclic GMP degradation, rabbits were administered a bolus of Zaprinast (10 mg kg−1; Sigma) or vehicle (saline) followed after 10 min by acetylcholine (n=6) or SNP (n=5) at increasing doses (0.5, 1 and 2 μg kg−1 min−1 for 5 min each). Pulse waves from the end of each period were analysed. All drugs were obtained from Sigma.
To determine whether effects of L-NAME on RHDN were accompanied by changes in mean arterial blood pressure, an intra-arterial catheter was placed in the central ear artery and connected to a pressure transducer (SensorNor 840, Horten, Norway). L-NAME was infused at 1 and then 10 mg min−1 for 15 min at each dose (n=7). (A total of >35 mg kg−1 was thus received by each rabbit). Arterial pressure was determined at the end of each infusion, concomitant values of RHDN and heart rate being obtained from the photoplethysmograph trace.
Trial 2 protocols
Male New Zealand White rabbits (Harlan Interfauna, Huntington) of 3.6 – 4.7 kg were fed a standard laboratory diet (9603 TRB, Harlan Teklad) and housed at 18°C on a 12 h light cycle. Two photoplethysmographs were used simultaneously on each animal. The first (model 1020, UFI) was placed over the central ear artery as described above. A similar probe was placed on the pad of a rear foot. Although resolution of the foot trace was not as good as that of the ear trace, it was sufficient for defining the systolic peak. Output of both probes was digitized using a Pico ADC-100 analogue-to-digital converter (12 bit sampling at 500 Hz) and Picolog software (Pico Technology Ltd).
Three baseline recordings were made in each rabbit, after which infusion of acetylcholine (12 μg min−1, n=6) or L-NAME (5 mg min−1, n=4) was started. These drugs were obtained from Sigma. Five further recordings were made, at approximately 2 min-intervals after the start of the infusions. Thus the duration of the infusion was c.10 min and the total dose of L-NAME was >10 mg kg−1. Each recording comprised 4 – 8 s of output from both sensors.
Since Trial 2 used longer recordings, and more of them, than Trial 1, a method for obtaining representative RHDN's without individually analysing each heartbeat was required. This method had to take into account beat-to-beat variations in wave and notch height (Lund, 1986). Inspection of the recordings showed that diastolic waves sometimes ran into the foot of the next systolic wave, thus raising the minimum diastolic value, and sometimes ran into the succeeding systolic peak, raising the maximum value. Therefore the minimum and maximum values for each recording were defined as the lowest minimum and the lowest peak seen: these values should be least influenced by such interference. Notch height was defined as the midpoint between the lowest and highest notches observed. This was considered preferable to the mean value since notch height varied cyclically and recordings did not necessarily contain an integer number of cycles. These procedures (Figure 1a) gave excellent consistency: it was common for RHDN's calculated in this way from successive recordings to agree to two significant figures.
Figure 1.
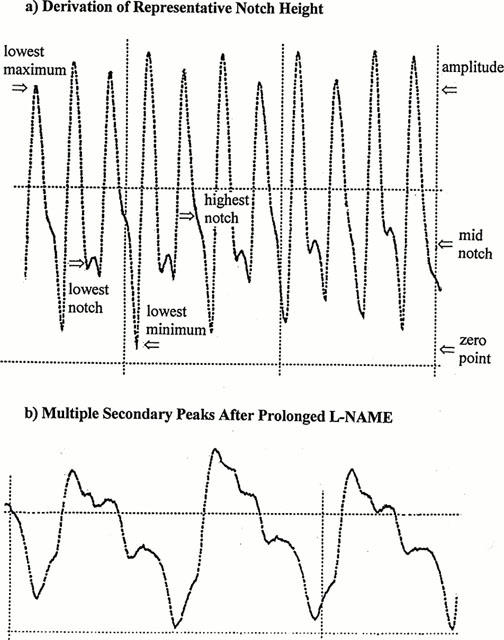
(a) An illustration of the techniques used to obtain a representative value of RHDN in Trial 2. Zero on the ordinate was defined by the lowest diastolic minimum, and the overall amplitude of the wave as the distance from this zero to the lowest systolic maximum. The notch height was defined as the distance from the zero to the mid-point between the lowest and the highest notches (notches being defined by the change in gradient in the post-systolic falloff). RHDN was calculated as notch height divided by overall amplitude (0.41 in this case). (b) A recording showing the multiple peaks which can occur after prolonged infusion with L-NAME. In both (a) and (b), the distance between vertical grid lines corresponds to 1 s.
Statistics
Data are given as mean±s.e.mean and n refers to the number of rabbits from which data were obtained, unless otherwise stated. Comparison between means was made by Student's unpaired t-test. Differences of mean ratios from unity were also tested by using the t-statistic. ANOVA with a Bonferroni correction for multiple comparisons was used to determine the significance of effects of Zaprinast. Statistical significance was assumed at P<0.05.
Results
Effect on RHDN of modifying NO activity
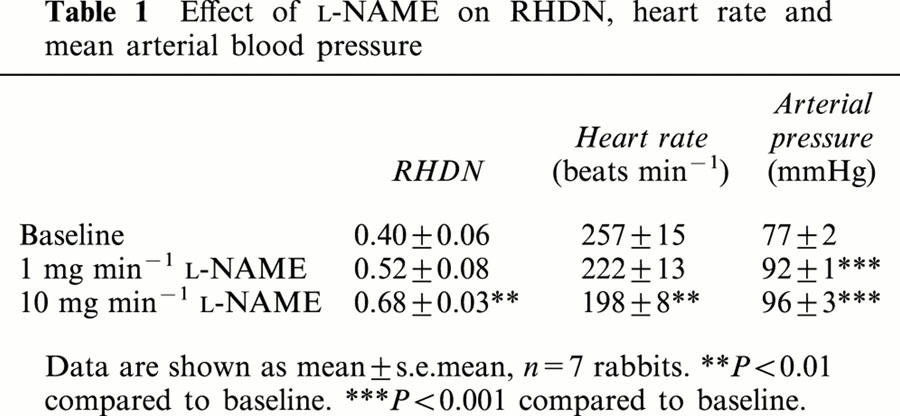
Acetylcholine produced a large drop in RHDN (Figure 2a). This drop was abolished by L-NAME but was unaffected by D-NAME (Figure 2a), consistent with it being mediated by endogenous NO synthesis. The effects of acetylcholine, and those of the NO donor SNP, were dose-dependent (Figure 2b). The dose-responses to acetylcholine and SNP were enhanced by the phosphodiesterase type V inhibitor Zaprinast compared to vehicle alone (Figure 2c), indicating the involvement of cyclic GMP. Zaprinast had no effect on basal values (data not shown), as previously observed in experiments examining the effects of these concentrations on cyclic GMP levels (Dundore et al., 1993). Effects of L-NAME on baseline RHDN were accompanied by decreases in heart rate and increases in mean arterial blood pressure (Table 1).
Figure 2.
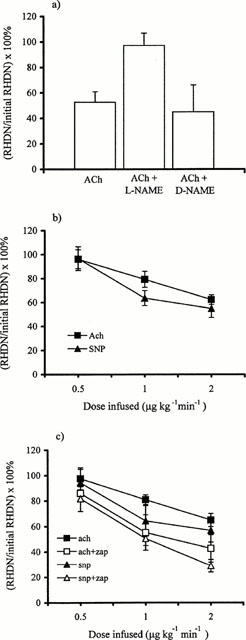
(a) In Trial 1, acetylcholine (Ach; 2 μg kg−1 min−1) reduced RHDN (P<0.01, n=7). This drop was abolished by L-NAME (5 mg bolus and 10 mg min−1 infusion; P<0.01 compared to acetylcholine, P>0.05 compared to baseline, n=6) but was unaffected by D-NAME (P>0.05, n=4). (b) The effects of acetylcholine (n=5) and SNP (n=5) were dose-dependent and were significant (P<0.05) at doses ⩾1 μg kg−1 min−1. (Significance in (a) and (b) was assessed by Student's unpaired t-test.) (c) The responses to acetylcholine (n=6) and SNP (n=5) were higher after administration of Zaprinast than after vehicle alone (P<0.005 by ANOVA).
Table 1.
Effect of L-NAME on RHDN, heart rate and mean arterial blood pressure
Timecourses of changes induced by acetylcholine and L-NAME
In Trial 2, effects of acetylcholine or L-NAME infusion were monitored over a 10 min period. The reduction in RHDN induced by acetylcholine was maximal within 2 min, and there was a partial recovery by 10 min (Figure 3a). Absolute values of RHDN before and after intervention were close to those of Klemsdal et al. (1986), demonstrating that differences in instrumentation, experimental protocol and the methods used to obtain typical values of RHDN have little influence. L-NAME produced a steady increase in RHDN over the course of the experiment (Figure 3a). The interval between heart beats showed similar changes (Figure 3b).
Figure 3.
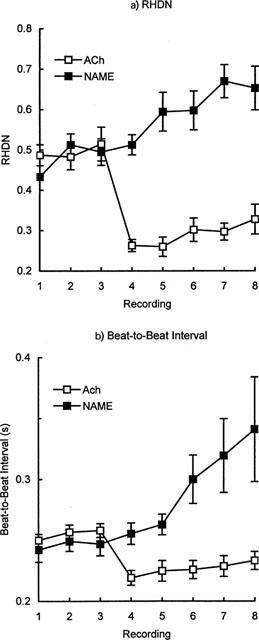
Timecourse of mean changes (±s.e.mean) in (a) RHDN and (b) beat-to-beat interval during infusion of acetylcholine (12 μg min−1; n=6) or L-NAME (5 mg min−1; n=4, except for final timepoint where n=3) in Trial 2. Recordings were made at approximately 2-min intervals, and infusion commenced immediately after the third recording.
On rare occasions, prolonged infusion with L-NAME gave rise to traces that were hard to interpret. First, vasoconstriction sometimes made it difficult to obtain an adequate signal; for this reason, one of the 20 recordings required by the protocol during L-NAME infusion could not be obtained despite repeated attempts. Second, periods occurred where more than one secondary peak could be seen during a cardiac cycle (Figure 1b). For two of the 19 recordings made during L-NAME infusion it was not possible to determine which was the main diastolic wave in every beat. However, there were never less than 8 beats which could be analysed in each recording.
Peak changes in RHDN and heart rate
For the statistical analysis of changes in RHDN during Trial 2, values from two periods during acetylcholine or L-NAME infusion were averaged and divided by the similarly-averaged values from two baseline periods in the same animal. These ratios were then averaged across all the animals in a group, and their difference from unity (which would indicate no effect of the intervention) was assessed by Student's unpaired t-test.
For animals receiving acetylcholine, the two recordings during infusion chosen for this analysis were always the first two, made approximately 2 and 4 min after the start of the infusion, where the maximum effect of the drug was observed (Figure 3). The two recordings during L-NAME infusion chosen for analysis were selected from the last three in each animal, where the effect of L-NAME was at or close to its maximum (Figure 3), except that one earlier recording was used because of the problems with signal quality described above. The same procedures and recordings were used when assessing the other waveform characteristics described below.
Using these methods, RHDN was found to be decreased by acetylcholine and increased by L-NAME from its baseline average of 0.48 (Figure 4a). The changes were highly significant despite the small sample sizes, reflecting their large magnitude and consistency. The interval between heart beats was also decreased by acetylcholine and increased by L-NAME, from a baseline of 0.25 s (Figure 4b). The percentage changes were smaller than those in RHDN, but were still highly significant.
Figure 4.
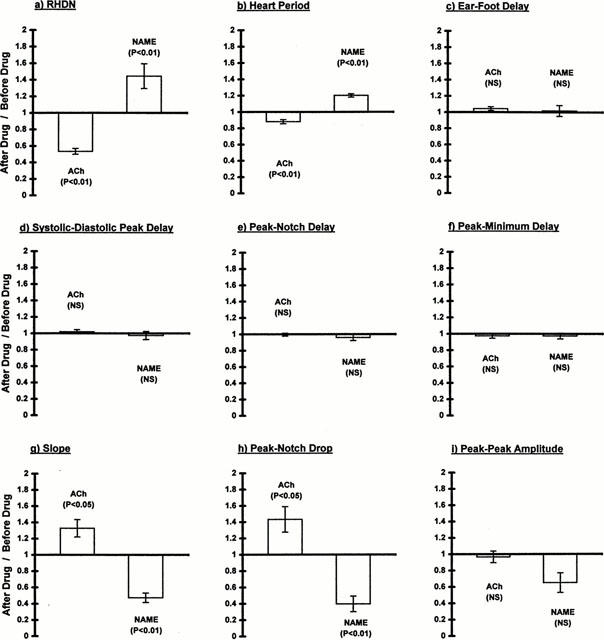
Ratios of various attributes of the pulse wave before and after infusion of acetylcholine (12 μg min−1) or L-NAME (5 mg min−1) in Trial 2. (a) RHDN, (b) interval between heart beats, (c) delay between arrival of the systolic peak at the ear and its arrival at a rear foot, indicating wavespeed, (d) delay between the arrival in the ear of the systolic and diastolic peaks, (e) delay between the arrival in the ear of the systolic peak and the notch, (f) delay between the arrival in the ear of the systolic peak and the minimum of the point of inflection, (g) the slope of the linear part of the wave between the systolic peak and the notch, (h) the drop in height of the wave between the systolic peak and the notch, and (i) the peak-to-peak amplitude of the wave. Bars show mean±s.e.mean (n=6 for acetylcholine and 4 for L-NAME), and significance was assessed by Student's unpaired t-test.
Changes in wavespeed
Altered NO synthesis might have affected arterial stiffness and hence the speed of pulse waves. A change in wavespeed could, in principle, account for the alterations in notch height (see below). Wavespeed was assessed from the delay between the arrival of the systolic peak at the ear sensor and its arrival at the foot sensor. Wave peaks could be used for this analysis because both measurements were made at the periphery; the changes in waveform that occur between the heart and the periphery (Nichols & O'Rourke, 1998) are therefore not relevant. A delay arises because the heart-to-foot pathlength is greater than the heart-to-ear pathlength. The mean delay before intervention of 0.054 s and the previously-determined wavespeed of 4.2 to 4.5 m s−1 (Avolio et al., 1976) imply a difference in pathlength of 24 cm; this is approximately the difference expected on anatomical grounds.
Although absolute wavespeeds cannot be obtained without knowledge of the precise distances involved, changes in the delay still indicate changes in wavespeed. Neither acetylcholine nor L-NAME had a significant effect on wavespeed (Figure 4c). Furthermore, there was no evidence for a nonsignificant trend and no indication that acetylcholine and L-NAME had opposing influences.
Changes in the timing of peripheral wave features
Another possible cause of the alterations in notch height is a change in the relative timing of different features of the pulse wave (see below). Changes in timing could arise in the absence of altered wavespeed. Therefore we examined the delay between the systolic peak and the following diastolic peak in traces from the ear sensor in Trial 2. Only beats with a discrete diastolic peak could be analysed in this way; such beats comprised, on average, 65% of each recording (s.d.=17%, n=40 recordings). Before infusion, the mean delay was 0.12 s. Neither acetylcholine nor L-NAME had a significant effect on this value, nor was there any obvious nonsignificant trend (Figure 4d). Chowienczyk et al. (1999) have shown a similar invariance in the human digital pulse.
A better test of whether changes in RHDN might reflect changes in the timing of the notch is to examine the delay between the systolic peak and the notch itself. Again there was no evidence for a change, significant or otherwise, from the baseline value of 0.076 s (Figure 4e). Indeed, the delay was altered by less than 1% during acetylcholine infusion. In order to determine whether this invariance depended on how the notch was defined, the analysis was repeated using the minimum of the point of inflection to characterize the notch, where such a minimum could be discerned. (Beats with an identifiable minimum comprised 63%, s.d.=16%, of each recording.) This delay, which averaged 0.091 s before intervention, was also unaffected by acetylcholine or L-NAME (Figure 4f).
Changes in other waveform characteristics
Since changes in RHDN could not be attributed to alterations in the timing of waveform components, distortions of the relative amplitudes of these components must have been responsible. We examined the gradient of the downslope between peak systole and the notch. It was measured well away from the plateau occurring around peak systole and from the notch itself, in order to avoid influences of ejection parameters or the diastolic wave; the gradient is remarkably constant during this period. Acetylcholine significantly steepened the downslope, while L-NAME reduced it (Figure 4g). We also measured the drop in wave height occurring between peak systole and the notch. Consistent with the changes in slope, this drop was increased by acetylcholine and reduced by L-NAME (Figure 4h).
If such changes merely represented a vertical scaling of the entire wave, they would have had no influence on RHDN. Consequently, we also examined the peak-to-peak height of the wave. There was no significant change in this amplitude either with acetylcholine or with L-NAME (Figure 4i). The amplitude of the wave changed by <5% with acetylcholine. Although it was reduced 35% by L-NAME, a trend that might have become significant with a larger sample size, this change in overall amplitude was significantly less than the change in the drop occurring between peak systole and the notch: the ratio of the two parameters was 0.60±0.15 (mean±s.d.; P<2%).
Changes in RHDN thus appear to result from changes in the downslope of the pulse wave prior to the notch (and the concomitant changes in the amplitude of this part of the cardiac cycle) in conjunction with an absence of change in peak-to-peak amplitude and timing.
Construction of typical waves
The digital storage of recordings in Trial 1 allowed the construction of typical pulse waves. Three baseline pulse waves and three pulse waves during acetylcholine or L-NAME perfusion were averaged for each animal. For comparability with the peak changes in Trial 2, presented above, averages were calculated for pulse waves obtained after 2 min of acetylcholine perfusion and 10 min of L-NAME infusion. The resulting curves were then averaged across the five animals receiving each treatment. When averaging within and across animals, waves were aligned at the start of systole, defined as the point where a positive gradient first occurred, and were truncated at the point where the shortest wave ended.
Figure 5 shows the resulting curves; for simplicity, the baseline waves from the L-NAME and acetylcholine experiments have been combined. To allow the timing intervals described above to be compared between groups, these curves have been aligned at peak systole. Furthermore, the overall amplitude of each has been adjusted to a value of 100 so that RHDN is directly indicated by the height of each notch. The data clearly show the large changes which occurred in RHDN, a near 3 fold difference being evident between the L-NAME and acetylcholine treatments. It is also clear that there was no systematic trend across the curves in the timing of the notch or diastolic peak.
Figure 5.
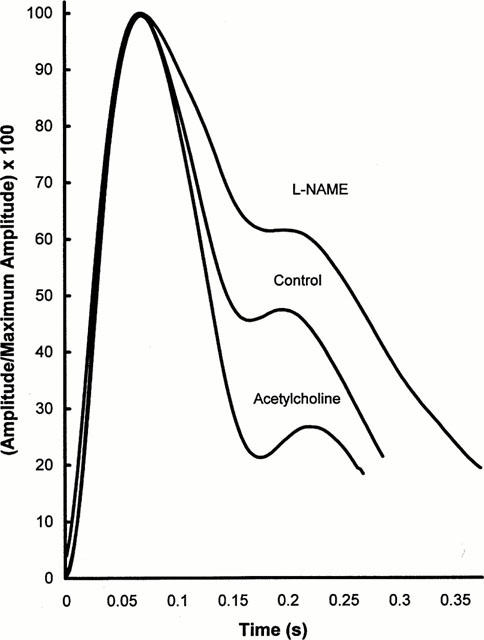
Average pulse waves. Three pulse waves from each of five animals infused with acetylcholine or L-NAME were averaged; three waves obtained prior to each infusion were also combined. The average waves were scaled to give the same peak amplitude, and were aligned at their peaks. They were truncated at the point where the shortest wave for each condition terminated. Large changes in RHDN are apparent, but there are no systematic trends in the timing of the notch or of the diastolic peak across the three curves.
Discussion
In the present study, manipulation of the NO pathway induced large changes in the characteristics of the volume pulse wave measured in the rabbit ear. RHDN was reduced in a dose-dependent manner by acetylcholine and by SNP, an NO donor. The effect of acetylcholine was abolished by the NO synthase inhibitor L-NAME, but was unaffected by D-NAME, and the effects of SNP and acetylcholine were augmented by Zaprinast, an inhibitor of cyclic GMP degradation. The changes in baseline RHDN induced by acetylcholine or L-NAME were associated with alterations of the slope and amplitude of the pulse wave between peak systole and the dicrotic notch, but there was no alteration of wavespeed, the intervals between different components of the wave, or the overall amplitude of the wave.
The secondary peak in the pulse waveform, which defines the notch, arises from wave reflections within the vasculature. Nichols & O'Rourke (1998) have shown that the nature of the reflections involved varies according to body plan, wavespeed, heart rate and measuring site. One obvious explanation for the prominent diastolic peak in the rabbit ear is that it is a direct reflection of the systolic wave from the lower body, particularly from the large, muscular hindlegs. The distance from the heart to the lumped lower body reflection site is approximately 25 cm in the rabbit, and the wavespeed is between 4.2 and 4.5 m s−1 (Avolio et al., 1976). Taking a middle value for the wavespeed, and ignoring the pathway between the heart and the ear (since it would affect the primary and reflected waves equally) gives a predicted delay between the systolic peak and its lower body reflection of 0.12 s in the ear. The delay between the systolic and diastolic peaks measured in the present study was 0.12±0.01 s (mean±s.d. for the 10 animals of Trial 2, before intervention). Because of the excellent agreement, we assume this mechanism to be correct in the following discussion.
At least three different effects of vasodilators could theoretically lead to a fall in the height of the notch preceding the diastolic wave. These are (i) a decrease in pulse wave velocity, (ii) a reduced diastolic reflection of the systolic wave, and (iii) a reduction in total peripheral resistance. (There are other possibilities, particularly concerning influences on cardiac performance, which lie outside the scope of this discussion.) Figure 6 shows in diagrammatic form how each of these three influences would act, and additionally shows that they lead to different predictions about the timing and shape of the pulse waveform. Vasodilators do not necessarily alter all three properties together, presumably because different types of vessel, with different sensitivities to a variety of agonists, are involved.
Figure 6.
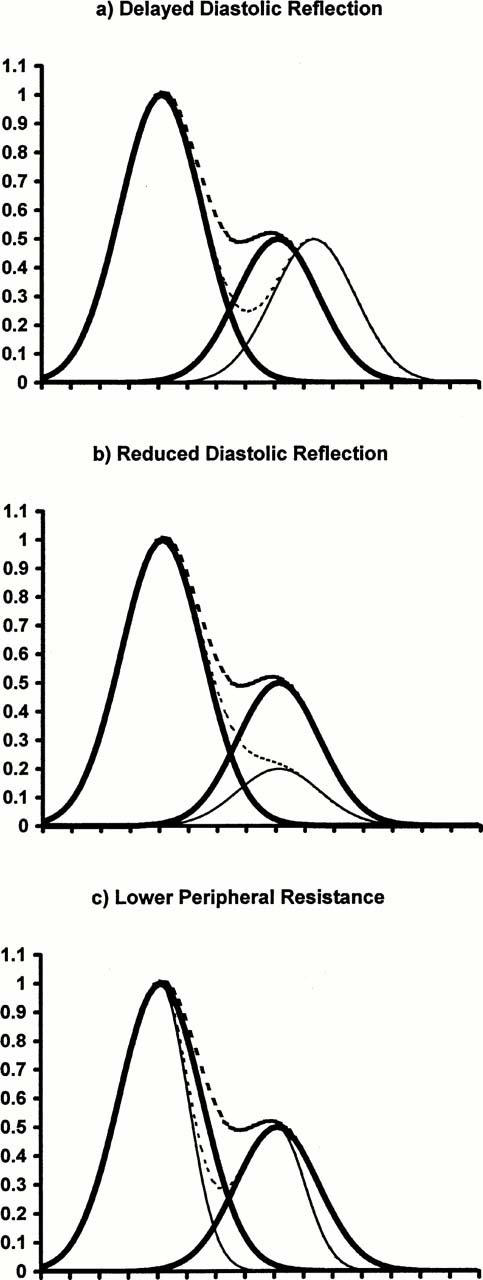
A decrease in vascular tone could theoretically lower RHDN (a) by decreasing wavespeed–the resulting increase in transmission time between the heart and the reflection site would also delay both the notch and the second peak relative to the systolic peak, (b) by reducing the magnitude of the diastolic reflection of the systolic peak–the delay between primary and secondary peaks would not be altered, but the notch would be delayed as well as lowered, or (c) by allowing a faster decay in pressure and volume–the notch would be detectable at an earlier time, as well as being lowered, but the peak-to-peak delay would not be affected. In this simplified model, the normal systolic peak and its diastolic reflection are represented by Gaussians (heavy solid lines), and their sum is also shown (heavy dotted lines). Effects of modifications are indicated by the lighter solid and dotted lines. Notch heights and their reductions are realistic.
The evidence from the present study clearly argues against the involvement of changes in pulse wave velocity in the NO-mediated effects. Not only did acetylcholine fail to decrease wavespeed, assessed from the ear-to-foot delay, but within the ear trace alone it also failed to increase the delays between the systolic peak and the diastolic peak, and between the systolic peak and the notch, both of which would be predicted from a decrease in velocity. Nor were there any effects in the opposite direction when L-NAME was infused. There is a wealth of supporting evidence that wavespeed and distensibility (on which wavespeed depends) are resistant to pharmacological change, at least so long as blood pressure is unaltered, in aortas of human subjects and other species (Chowienczyk et al., 1999; Yaginuma et al., 1986; Fitchett et al., 1988; Latson et al., 1988). Although these properties may be modified in more peripheral vessels (Simon et al., 1982; Safar et al., 1983; Tamawski et al., 1998), the absence of timing changes in the present study suggests that manipulations of the NO pathway do not have such effects, that our measures of velocity are dominated by the aortic transit time, or that the vessels susceptible to change are distal to the reflection sites.
The lack of effect of NO on aortic wavespeed contrasts with the large changes associated with ageing. The loss of ‘dicrotism' that occurs with age (Lund, 1986) may therefore have different mechanisms from the loss produced by inhibiting NO synthesis. The invariant wavespeed also rules out explanations for NO-dependent changes in RHDN based on altered Windkessel properties (Klemsdal et al., 1994).
Although a reduced diastolic reflection of the systolic wave would cause a fall in RHDN, it would also delay the notch (Figure 6). We found that the timing of the notch was changed less than 5% by L-NAME and less than 1% by acetylcholine (neither effect being statistically significant) while RHDN was altered approximately 50%. Hence this mechanism on its own seems unable to account for our data. A reduction in peripheral resistance would also lower RHDN but, conversely, would advance the notch (Figure 6). Again, this mechanism alone cannot explain our results. Theoretically, a combination of the two mechanisms could account for the observed changes, since the effects on timing would tend to cancel each other. In practice, however, the relation between resistance and notch height seems weak: either one can be altered without a statistically-significant change in the other (Sundberg & Castren, 1986). Furthermore, this combination of changes is unable to explain the multiple secondary peaks occurring during infusion of L-NAME (Figure 1b).
The changes we observed can be explained by altered wave reflection alone providing that events in addition to the main diastolic reflection of the systolic wave are considered. If reflections occurred before the notch as well as after it, and were strongly affected by the NO pathway, changes in NO synthesis would be associated with alterations of the height of the notch but not of its timing. Such effects would also readily explain the strong influence of NO on the gradient of the wave before the notch. In principle, reflections and re-reflections from many sites could arrive in the ear before the notch. The emergence of secondary peaks before the notch during L-NAME infusion is evidence for their existence and for their dependence on NO.
Vasodilatation resulting from enhanced NO synthesis could induce such alterations not only by decreasing positive reflections, as commonly assumed, but also by increasing negative ones. Dilatation of conduit arteries by nitrates appears to have such effects (Yaginuma et al., 1986). Increases in early negative reflections of the systolic wave from such sites could account for the drop in the height of the notch and for changes in slope prior to it – indeed, could account for the notch itself. The involvement of such reflections could be investigated further by making simultaneous measurements of pressure and flow; this allows incident and reflected components of pressure waves to be calculated (Nichols & O'Rourke, 1998), although uncertainty still arises from the need to assume linear pulse wave travel (Parker & Jones, 1990) and the difficulty in obtaining a characteristic impedance (Nichols & O'Rourke, 1998).
Of the many compounds so far investigated, only NO and nitrovasodilators appear to induce significant changes in RHDN. This specificity, if it is borne out by more systematic studies, must be related to some equally specific influence these compounds have on the vasculature and not to effects such as hypotension which are exerted by many vasoactive agents. The change induced by nitrates has been attributed to their targeting of conduit arteries (Yaginuma et al., 1986). The endogenous NO pathway is also particularly effective in such vessels, although at least partly for different reasons (Harrison & Bates, 1993; Xu et al., 1996; Shirai et al., 1999; Archer et al., 1996). We speculate that few other pharmacological agents affect these vessels, accounting for the apparent specificity. A critical role for reflections from conduit arteries, rather than from more peripheral vessels, would explain why altered NO synthesis affects features of the waveform occurring shortly after the systolic peak, and not those occurring later in the cardiac cycle.
Basal RHDN seems surprisingly refractory to change; it is unaltered in cholesterol-fed rabbits (Klemsdal et al., 1994) and in type 2 diabetics (Chowienczyk et al., 1999). An extra intervention (e.g. administration of an agonist or antagonist of NO synthesis) is thus required in order to assess endothelial impairment. Infusion of compounds that reduce NO synthesis to low levels theoretically provides an ideal method for assessing the basal level of NO synthesis, and makes the attribution of any effects to the NO pathway unequivocal. In practice, however, we found that such inhibitors made pulse waves harder to record and interpret. Acetylcholine did produce readily-detectable changes in RHDN that were decreased in the hypercholesterolaemic rabbit (Klemsdal et al., 1994). However, the signalling pathway involved is different from the one involved in the basal, flow-dependent release of NO (Ayajiki et al., 1996); it may not be affected by hypercholesterolaemia to the same extent (Hutcheson et al., 1994).
In summary, this study supports the view that RHDN could provide a readily-obtained measure of NO activity in vivo. The data may be relevant not only to the rabbit, a species widely used in studies of physiology, pharmacology and experimental pathology, but also to the human vasculature. The influence of NO on RHDN in rabbits appears to be mediated by altered wave reflection, and the same mechanism may apply in man (Chowienczyk et al., 1999). Further work is required in order to define the nature of the wave reflections involved, to determine how specific the effects are to the NO pathway, and to find a more appropriate method for modifying NO activity during measurement.
Acknowledgments
This study was supported by the British Heart Foundation and AstraZeneca.
Abbreviations
- RHDN
relative height of the dicrotic notch
References
- ARCHER S.L., HUANG J.M.C., REEVE H.L., HAMPL V., TOLAROVA S., MICHELAKIS E., WEIR E.K. Differential distribution of electrophysiologically distinct myocytes in conduit and resistance arteries determines their response to nitric oxide and hypoxia. Circ. Res. 1996;78:431–442. doi: 10.1161/01.res.78.3.431. [DOI] [PubMed] [Google Scholar]
- AVOLIO A.P., O'ROURKE M.F., MANG K., BASON P.T., GOW B.S. A comparative study of pulsatile arterial hemodynamics in rabbits and guinea pigs. Am. J. Physiol. 1976;230:868–875. doi: 10.1152/ajplegacy.1976.230.4.868. [DOI] [PubMed] [Google Scholar]
- AYAJIKI K., KINDERMANN M., HECKER M., FLEMING I., BUSSE R. Intracellular pH and tyrosine phosphorylation but not calcium determine shear stress-induced nitric oxide production in native endothelial cells. Circ. Res. 1996;78:750–758. doi: 10.1161/01.res.78.5.750. [DOI] [PubMed] [Google Scholar]
- CHOWIENCZYK P.J., KELLY R., MACCALLUM H., MILLASSEAU S.C., ANDERSSON T., GOSLING R.G., RITTER J.M., ANGGARD E.E. Photoplethysmographic assessment of pulse wave reflection: blunted response to endothelium-dependent β2-adrenergic vasodilation in type 2 diabetes. J. Am. Coll. Cardiol. 1999;34:2007–2014. doi: 10.1016/s0735-1097(99)00441-6. [DOI] [PubMed] [Google Scholar]
- DAWES M., CHOWIENCZYK P.J., RITTER J.M. Effects of inhibition of the L-arginine/nitric oxide pathway on vasodilation caused by beta-adrenergic agonists in the human forearm. Circulation. 1997;95:2293–2297. doi: 10.1161/01.cir.95.9.2293. [DOI] [PubMed] [Google Scholar]
- DILLON J.B., HERTZMAN A.B. The form of the volume pulse in the finger pad in health, arteriosclerosis and hypertension. Am. Heart J. 1941;21:172–190. [Google Scholar]
- DUNDORE R.L., CLAS D.M., WHEELER L.T., HABEEB P.G., BODE D.C., BUCHHOLZ R.A., SILVER P.J., PAGINI E.D. Zaprinast increases cyclic GMP lavels in plasma and aortic tissue of rats. Eur. J. Pharmacol. 1993;249:293–297. doi: 10.1016/0014-2999(93)90525-m. [DOI] [PubMed] [Google Scholar]
- FITCHETT D.G.H., SIMKUS G.J., BEAUDRY J.P., MARPOLE D.G.H. Reflected pressure waves in the ascending aorta: effect of glyceryl trinitrate. Cardiovasc. Res. 1988;22:494–500. doi: 10.1093/cvr/22.7.494. [DOI] [PubMed] [Google Scholar]
- HARRISON D.G., BATES J.N. The nitrovasodilators: new ideas about old drugs. Circulation. 1993;87:1461–1467. doi: 10.1161/01.cir.87.5.1461. [DOI] [PubMed] [Google Scholar]
- HUTCHESON I.R., SMITH J.A., GRIFFITH T.M. Abolition of flow-dependent EDRF release before that evoked by agonists in hypercholesterolaemic rabbits. Br. J. Pharmacol. 1994;113:190–194. doi: 10.1111/j.1476-5381.1994.tb16192.x. [DOI] [PMC free article] [PubMed] [Google Scholar]
- IMHOF P.R., OTT B., FRANKHAUSER P., CHU L.C., HODLER J. Difference in nitroglycerin dose-response in the venous and arterial beds. Eur. J. Clin. Pharmacol. 1980;18:455–460. doi: 10.1007/BF00874655. [DOI] [PubMed] [Google Scholar]
- KENGATHARAN M., HABENS F., BARNES S.E., CARRIER M.J., ANGGARD E.E., WEINBERG P.D. Characteristics of the pulse waveform during altered nitric oxide synthesis in the New Zealand White rabbit. Br. J. Pharmacol. 1999;128:P64. doi: 10.1038/sj.bjp.0704084. [DOI] [PMC free article] [PubMed] [Google Scholar]
- KLEMSDAL T.O., ANDERSSON T.L.G., MATZ J., FERNS G.A.A., GJESDAL K., ANGGARD E.E. Vitamin E restores endothelium dependent vasodilatation in cholesterol fed rabbits: in vivo measurements by photoplethysmography. Cardiovasc. Res. 1994;28:1397–1402. doi: 10.1093/cvr/28.9.1397. [DOI] [PubMed] [Google Scholar]
- LATSON K., HUNTER W.C., KATOH N., SAGAWA K. Effect of nitroglycerin on aortic impedance, diameter and pulse wave velocity. Circ. Res. 1988;62:884–890. doi: 10.1161/01.res.62.5.884. [DOI] [PubMed] [Google Scholar]
- LUND F. Digital pulse plethysmography (DPG) in studies of the hemodynamic response to nitrates - A survey of recording methods and principles of analysis. Acta. Pharmacol. Toxicol. 1986;59 Suppl VI:79–96. doi: 10.1111/j.1600-0773.1986.tb02551.x. [DOI] [PubMed] [Google Scholar]
- MORIKAWA Y. Characteristic pulse wave caused by organic nitrates. Nature. 1967;213:841–842. doi: 10.1038/213841a0. [DOI] [PubMed] [Google Scholar]
- MURRELL W. Nitro-glycerin as a remedy for angina pectoris. Lancet. 1879;80:113–115. [Google Scholar]
- NICHOLS W.W., O'ROURKE M.F. McDonald's Blood Flow in Arteries: Theoretical, Experimental and Clinical Principles (4th edn) 1998Oxford: Oxford University Press; Chapters 9 & 11 [Google Scholar]
- PARKER K.H., JONES C.H. Forward and backward running waves in arteries: analysis using the method of characteristics. Trans. A.S.M.E. J. Biomech. Eng. 1990;112:322–326. doi: 10.1115/1.2891191. [DOI] [PubMed] [Google Scholar]
- SAFAR M.E., BOUTHIER J.A., LEVENSON J.A., SIMON A.C. Peripheral large arteries and their response to antihypertensive treatment. Hypertension. 1983;5 Suppl III:63–68. doi: 10.1161/01.hyp.5.5_pt_2.iii63. [DOI] [PubMed] [Google Scholar]
- SHIRAI M., IKEDA S., MIN K.Y., SHIMOUCHI A., KAWAGUCHI A.T., NINOMIYA I. Segmental differences in vasodilatation due to basal NO release in in vivo cat pulmonary vessels. Resp. Physiol. 1999;116:159–169. doi: 10.1016/s0034-5687(99)00053-5. [DOI] [PubMed] [Google Scholar]
- SIMON A.CH., LEVENSON J.A., LAURENT S.P., SAFAR M.E. Estimation of forearm arterial compliance in hypertension: a preliminary report. Clin. Sci. 1982;63:87s–88s. [Google Scholar]
- SUNDBERG S., CASTREN M. Drug- and temperature-induced changes in peripheral circulation measured by laser-Doppler flowmetry and digital-pulse plethysmography. Scand. J. Clin. Lab. Invest. 1986;46:359–365. doi: 10.3109/00365518609083683. [DOI] [PubMed] [Google Scholar]
- TARNAWSKI M., MCLEAN M., CARO C.G., DOORLY D.J., DUMOULIN C.L. Effect of nicotine transdermal patch on femoral artery wavespeed in healthy human subjects measured by MRI. J. Physiol. 1998;506P:P16. [Google Scholar]
- URETZKY G., PALTI Y. A method for comparing transmitted and reflected light photoelectric plethysmography. J. Appl. Physiol. 1971;31:132–135. doi: 10.1152/jappl.1971.31.1.132. [DOI] [PubMed] [Google Scholar]
- XU X.P., TANNER M.A., STUREK M., MYERS P.R. Differences in nitric oxide production in porcine resistance arteries and epicardial coronary arteries. J. Cellular Physiol. 1996;168:539–548. doi: 10.1002/(SICI)1097-4652(199609)168:3<539::AID-JCP6>3.0.CO;2-Q. [DOI] [PubMed] [Google Scholar]
- YAGINUMA T., AVOLIO A., O'ROURKE M., NICHOLS W., MORGAN J.P., ROY P., BARON D., BRANSON J., FENELEY M. Effects of glyceryl trinitrate on peripheral arteries alters left ventricular hydraulic load in man. Cardiovasc. Res. 1986;20:153–160. doi: 10.1093/cvr/20.2.153. [DOI] [PubMed] [Google Scholar]


