Abstract
Individual pancreatic β-cells are functionally heterogeneous. Their sensitivity to glucose is variable, so that the proportion of active cells increases with the glucose concentration (recruitment).
We have investigated whether sulphonylureas also recruit β-cells, by measuring cytoplasmic Ca2+ ([Ca2+]i) – the triggering signal of insulin secretion – in single cells and clusters of cells prepared from mouse islets.
In 4 mM glucose, the threshold concentration of tolbutamide inducing a [Ca2+]i rise was variable (5 – 50 μM). The proportion of responsive cells and clusters therefore increased with the tolbutamide concentration, to reach a maximum of 90% of the cells and 100% of the clusters. This recruitment occurred faster when the glucose concentration was increased from 4 to 5 mM (EC50 of ∼14 and ∼4 μM tolbutamide respectively).
Within responsive clusters little recruitment was observed; when a cluster was active, all or nearly all cells were active probably because of cell coupling. Thus, tolbutamide-induced [Ca2+]i oscillations were synchronous in all cells of each cluster, whereas there was no synchrony between clusters or individual cells.
Independently of cell recruitment, tolbutamide gradually augmented the magnitude of the [Ca2+]i rise in single cells and clusters. This increase occurred over a broader range of concentrations than did recruitment (EC50 of ∼50 and 25 μM tolbutamide at 4 and 5 mM glucose respectively).
Tolbutamide (10 μM) accelerated the recruitment of single cells and clusters brought about by increasing glucose concentrations (range of 3 – 7 mM instead of 4 – 10 mM glucose), and potentiated the amplification of the individual responses that glucose also produced.
In conclusion, both metabolic (glucose) and pharmacologic (sulphonylurea) inhibition of K+-ATP channels recruits β-cells to generate a [Ca2+]i response. However, the response is not of an all-or-none type; it increases in amplitude with the concentration of either glucose or tolbutamide.
Keywords: Pancreatic islets, sulphonylureas, tolbutamide, cytoplasmic Ca2+, K+-ATP channels, β-cell heterogeneity, insulin secretion
Introduction
Glucose and other nutrient secretagogues control insulin secretion by activating two pathways in pancreatic β-cells (Henquin, 2000). The triggering pathway involves a sequence of now well characterized events: glucose metabolism by oxidative glycolysis causes a rise in the ATP:ADP ratio, which closes ATP-sensitive K+ (K+-ATP) channels, leading to membrane depolarization, opening of voltage-dependent Ca2+ channels, Ca2+ influx, rise in cytoplasmic Ca2+ concentration ([Ca2+]i) and activation of the exocytotic machinery (Ashcroft & Rorsman, 1989; Gilon & Henquin, 1992). The more recently identified (Gembal et al., 1992; 1993; Sato et al., 1992) amplifying pathway also requires glucose metabolism and leads to an increase in the efficacy of Ca2+ on exocytosis by as yet incompletely understood mechanisms (Sato & Henquin, 1998). In β-cells, hypoglycaemic sulphonylureas bind to the sulphonylurea receptor SUR-1, which is the regulatory subunit of the K+-ATP channel (Aguilar-Bryan & Bryan, 1999; Ashcroft & Gribble, 1999). This binding causes closure of the channel, membrane depolarization and eventual rise of [Ca2+]i, thus the same triggering pathway as that set in motion by glucose metabolism (Gilon & Henquin, 1992; Panten et al., 1996; Satin, 1996).
Individual β-cells are functionally heterogeneous. Their sensitivity to glucose is variable, so that the proportion of β-cells showing a metabolic (Kiekens et al., 1992), biosynthetic (Schuit et al., 1988; Bosco & Meda, 1991) or secretory (Salomon & Meda, 1986; Lewis et al., 1988; Hiriart & Ramirez-Medeles, 1991) response increases with the concentration of glucose. This has led to the proposal that the glucose dose-response relationship largely reflects recruitment of β-cells into an active state (Pipeleers et al., 1994). We have recently reported that β-cell recruitment also occurs at the stage of the [Ca2+]i response, but that β-cell association in clusters, a situation that is closer to that within islets, decreases the heterogeneity of the individual responses (Jonkers et al., 1999). Moreover, besides recruitment, an increase in the magnitude of the [Ca2+]i changes in individual β-cells markedly contributes to the concentration-dependent effects of glucose (Jonkers & Henquin, 2001).
The functional responses of individual β-cells to sulphonylureas have not been extensively studied, and not compared to those of coupled β-cells in clusters. It has been reported that, in the presence of 3 mM glucose, single rat and mouse β-cells respond heterogeneously to tolbutamide in terms of sensitivity and pattern of the [Ca2+]i rise (Grapengiesser et al., 1990; Herchuelz et al., 1991; Yaekura et al., 1996). Experiments using an insulin-secreting cell line (MIN6 cells) have also shown that a higher proportion of cells respond to tolbutamide with an elevation of [Ca2+]i when the cells are aggregated than isolated (Hauge-Evans et al., 1999).
In the present study, single cells and clusters were prepared from normal mouse islets and used to investigate whether pharmacological blockade of the K+-ATP channel by therapeutical concentrations of tolbutamide recruits β-cells to generate a [Ca2+]i response and suffices to modulate the amplitude of the individual responses. We also evaluated whether tolbutamide interferes with the effects of increasing glucose concentrations.
Methods
Solutions
The medium used for islet isolation and for the experiments was a bicarbonate-buffered solution that contained (mM): NaCl 120, KCl 4.8, CaCl2 2.5, MgCl2 1.2 and NaHCO3 24. It was gassed with O2 – CO2 (94 : 6) to maintain pH 7.4 and was supplemented with 0.5 mg ml−1 bovine serum albumin (BSA, fraction V). The Ca2+-free solution used to disperse islets in isolated cells and clusters contained (mM): NaCl 138, KCl 5.6, MgCl2 1.2, HEPES 5 and EGTA 1, with 100 iu ml−1 penicillin and 100 μg ml−1 streptomycin, and its pH was adjusted to 7.35 with NaOH. The culture medium was RPMI 1640 medium containing 10 mM glucose, 2 mM glutamine, 10% heat-inactivated foetal calf serum, and 100 iu ml−1 penicillin and 100 μg ml−1 streptomycin.
Preparation
The pancreas from female NMRI mice was digested with collagenase, and the isolated islets were collected by hand-picking under stereomicroscope (Jonas et al., 1998). Islet cells and clusters were obtained by incubating the islets for 5 min in Ca2+-free medium followed by dissociation in RPMI medium by gentle pipetting through a siliconized glass pipette. Cells and clusters were then cultured for 1 day on 22 mm circular, untreated glass coverslips to which they spontaneously attached (Jonkers et al., 1999). All recordings were performed with single cells or clusters between 2 and 20 cells.
Measurements of [Ca2+]i
Islet cells and clusters attached to the coverslip were loaded with fura-PE3 by incubation for 90 min in control medium containing 10 mM glucose and 1 μM fura-PE3 acetoxymethylester. The coverslip was then transferred into a temperature-controlled perifusion chamber (Intracell, Royston, Herts, U.K.) of which it formed the bottom. The chamber was placed on the stage of an inverted microscope (40×objective) and perifused (1.5 ml min−1) at 37°C with control medium containing increasing concentrations of tolbutamide or glucose. Cells and clusters were successively excited at 340 and 380 nm, and the fluorescence emitted at 510 nm was captured by a CCD camera (Photonic Science Ltd, Turnbridge Wells, U.K.). The images were analysed by the MagiCal system (Applied Imaging, Sunderland, U.K.). Further details of the technique, including the method for in vitro calibration of the signals, have been reported elsewhere (Gilon & Henquin, 1992; Jonkers et al., 1999).
At the end of each experiment, the perifusion chamber was filled with 1 ml of control solution containing 1 μM bisbenzimide for 30 min. The preparation was then excited at 365 nm to reveal fluorescent nuclei, permitting unambiguous identification of single cells and counting of the number of cells within clusters.
Experimental protocols
The effects of tolbutamide and glucose were studied in parallel, often with islet cells and clusters from the same preparations. In the first experimental series, the concentration of tolbutamide was increased stepwise (0, 5, 10, 15, 25, 50 and 100 μM) for periods of 12 min each, in the continuous presence of either 4 or 5 mM glucose. In early experiments, however, 5 or 50 μM tolbutamide was not tested. In the second experimental series, the concentration of glucose was increased stepwise (3, 4, 5, 6, 7, 8, 10 and 20 mM) for periods of 12 min each, in the absence or presence of 10 μM tolbutamide. However, because of memory limitations of the recording system only seven concentrations could be tested in sequence; therefore, either 8, 10 or 20 mM glucose was omitted when tolbutamide was present, whereas 3 or 20 mM glucose was omitted in the absence of tolbutamide.
Characterization of the preparations
We first determined the percentage of endocrine non-β-cells in the mouse islets in situ. The whole pancreas of three mice was stretched on cork, fixed in Bouin's fluid for 24 h, and embedded in paraffin. Longitudinal slices (5 μm thick) were then cut and processed to immunostain α- and δ-cells with a cocktail of anti-glucagon and anti-somatostatin serum, at a dilution of 1/1800 and 1/2000 respectively (Novo Biolabs, Bagsvaerd, Denmark). Positive cells were identified by a peroxidase method using 3,3′-diaminobenzidine as the substrate for staining. The method has been described in full elsewhere (Sempoux et al., 1998). Two slices separated by 500 μm were completely examined in each pancreas. In all islet sections, the number of endocrine cell nuclei was counted and the percentage of stained nucleated cells was determined.
We also measured the proportion of α- and δ-cells in preparations of islet cells and clusters similar to those used for the experiments. After one day of culture, coverslips were fixed in formol (4% in phosphate buffer) during 18 h at room temperature. Cells were then permeabilized with 0.02% Triton X-100 (Fluka Chemica, Switzerland) and processed to immunostain α-cells or δ-cells separately, with anti-glucagon or anti-somatostatin serum (Novo Biolabs) at a dilution of 1 : 10,000 or 1 : 25,000, respectively. Positive cells were identified by a streptavidin-biotin peroxidase system using 3,3′-diaminobenzidine as the substrate for staining. The preparations were then counterstained with hemalun. Labelled non-β-cells were counted (at a final magnification of 400×) in preparations from four different cultures, and their proportion was determined by counting the number of nuclei.
Presentation of results
The experiments are illustrated by representative recordings, and quantified data are presented as means±s.e.mean.
Results
Cellular composition of the preparation
The proportion of non-β-cells was counted in 133 islet sections (20,290 cells), in the pancreas of three mice. It averaged 19.8% (19, 19.2 and 21.1%), which is clearly less than the 35% classically reported for rat islets (Baetens et al., 1979).
The preparations used for the experiments contained a higher proportion of non-β-cells among the isolated cells: 21% α-cells and 12% δ-cells. In contrast, clusters contained only 6% α-cells and 7% δ-cells, which is in agreement with the 9% non-β-cells previously found with a double labelling for α- and δ-cells (Jonkers & Henquin, 2001). The latter approach also showed that 58% of the clusters did not contain non-β-cells. These characteristics are ascribed to the particular localization of the different types of cells within the islets: peripheral non-β-cells readily dissociate from other cells whereas central β-cells are more prone to form clusters without non-β-cells.
To increase the probability of studying single β-cells rather than single non-β-cells, fields containing relatively large cells were selected. Mouse β-cells are larger than α-and δ-cells (Berts et al., 1995). The studied clusters were selected on their size that was between two and a maximum of 20 cells (mean of 7.4±0.3 cells, n=284).
Influence of increasing tolbutamide concentrations on [Ca2+]i in islet single cells and clusters
Islet single cells and clusters were continuously perifused with a medium containing 4 or 5 mM glucose, and stimulated by stepwise increases in the tolbutamide concentration (5 – 100 μM). In this series, only few cells (7%) or clusters (1%) were found to show [Ca2+]i elevations in response to these glucose concentrations. These cells and clusters were not included in the calculations to permit strict evaluation of the effects of tolbutamide. The typical response to tolbutamide was characterized by repetitive transient elevations of [Ca2+]i (Figure 1).
Figure 1.
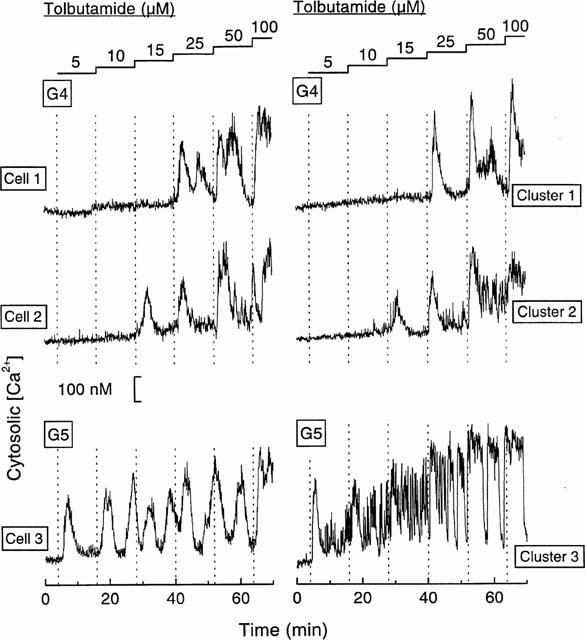
Examples of [Ca2+]i responses to increasing tolbutamide concentrations in islet single cells or clusters perifused with 4 or 5 mM glucose (G). Each tolbutamide concentration was applied for 12 min except 100 μM (6 min). Cells 1 and 2, and clusters 1 and 2 showed different sensitivities to tolbutamide in the presence of 4 mM glucose. Cell 3 and cluster 3 already responded to 5 μM tolbutamide in 5 mM glucose. The quantification of these different responses is presented in Figures 2 and 3.
Cells and clusters exhibited different sensitivity thresholds to tolbutamide. Figure 1 illustrates the responses of two cells and two clusters which started to respond to 25 and 15 μM tolbutamide in the presence of 4 mM glucose. It also shows the increase in sensitivity to tolbutamide observed in single cells and clusters when the glucose concentration was raised to 5 mM: a rise in [Ca2+]i was already elicited by 5 μM tolbutamide.
The percentage of islet single cells showing a [Ca2+]i rise increased with the concentration of tolbutamide, to a maximum of about 90% (Figure 2A). The cells that remained silent under these conditions were probably α-cells that are known not to respond to sulphonylureas in the mouse (Nadal et al., 1999), but we cannot exclude the possibility that some of these cells were unresponsive β-cells. The percentage of clusters responding to tolbutamide also increased with the concentration of the drug, but reached a maximum of 100% at 25 – 50 μM tolbutamide (Figure 2B). Both single cells and clusters were sensitized to tolbutamide by changing the glucose concentration from 4 to 5 mM. Thus, the EC50 values decreased from 13 to 3.9 μM tolbutamide in single cells and from 14.8 to 3.8 μM in clusters.
Figure 2.
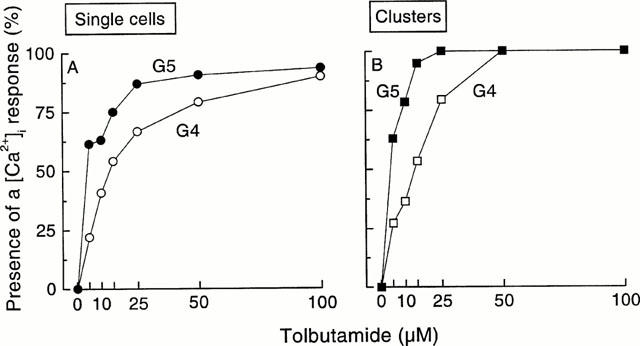
Influence of the tolbutamide concentration on the percentage of single islet cells and clusters showing a [Ca2+]i response (recruitment). The results were obtained from experiments similar to those shown in Figure 1. The total numbers of studied single cells were 98 in 4 mM glucose (G4) and 84 in G5, and those of studied clusters were 88 in G4 and 79 in G5. These cells and clusters were obtained in 17 different cultures.
The influence of the tolbutamide concentration on the magnitude of the mean [Ca2+]i response, was also measured. In both single cells and clusters, tolbutamide induced a concentration-dependent rise in mean [Ca2+]i that was not yet maximal at 100 μM of the drug (Figure 3A,B). In other series of experiments, the maximum [Ca2+]i concentrations reached in the presence of tolbutamide were 330 nM in single cells and 420 nM in clusters (Jonkers & Henquin, 2001). The recruitment of active cells contributes to this rise in mean [Ca2+]i at least in the low-tolbutamide concentration range. However, when only those cells or clusters active at a given tolbutamide concentration were taken into consideration, a rise in mean [Ca2+]i was still observed as the tolbutamide concentration was raised (Figure 3C,D). The phenomenon can be seen in Figure 1. Except at the lowest (5 – 10 μM) and highest (100 μM) concentrations of tolbutamide, [Ca2+]i was higher in 5 than 4 mM glucose. In high tolbutamide (50 – 100 μM), [Ca2+]i was higher in clusters than in single cells. Altogether these experiments indicate that tolbutamide augments the amplitude of the individual response and that this effect is larger in clusters that in single cells. Again, the slight increase in the glucose concentration from 4 to 5 mM lowered the EC50 values from 50 to 28 μM tolbutamide in single cells, and from 47 to 23 μM in clusters (Figure 3A,B).
Figure 3.
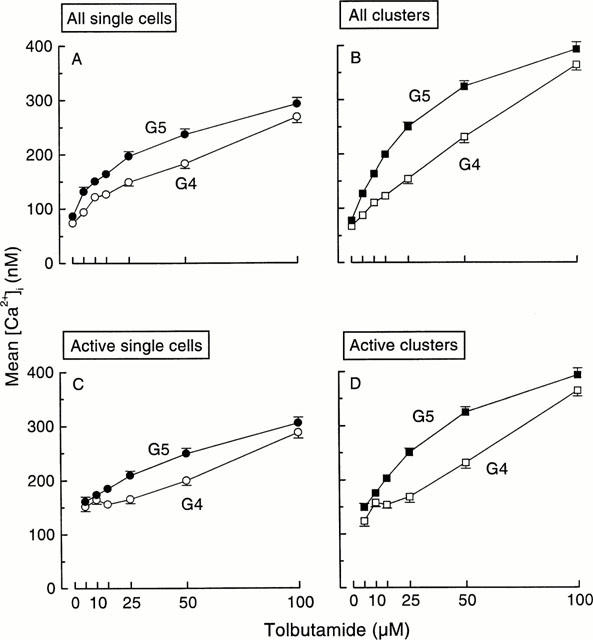
Influence of the tolbutamide concentration on average [Ca2+]i in islet single cells and clusters. At each tolbutamide concentration, mean [Ca2+]i was calculated for each cell and cluster even when there was no elevation of [Ca2+]i. (A and B) show the results for all, active and inactive, single cells and clusters. The observed increase in [Ca2+]i thus reflects both the recruitment of cells and clusters and the increase in the individual responses. (C and D) only consider those single cells and clusters showing a [Ca2+]i rise above basal values. The n values thus increase with the tolbutamide concentration. These curves therefore illustrate the increase in the amplitude of the individual responses.
The presence of a [Ca2+]i response within a cluster does not necessarily imply that all cells of the cluster are active. This was examined by analysing the signal over different regions of the cluster. Figure 4 illustrates [Ca2+]i changes in three regions of two near clusters in the same preparation. An excellent synchrony of the [Ca2+]i oscillations was observed within each cluster, even when the amplitude was different, as it sometimes happens (cell 1 in cluster 1). It is also striking that, except during the first minutes following application of 15 μM tolbutamide, there was no synchrony between the two clusters or with a nearby single cell (Figure 4). The synchrony of the [Ca2+]i signal between cells of a cluster is shown with a higher resolution in Figure 5. Only those transients of small amplitude and short duration differed between the five different regions, each covering a portion of the five cells composing the cluster.
Figure 4.
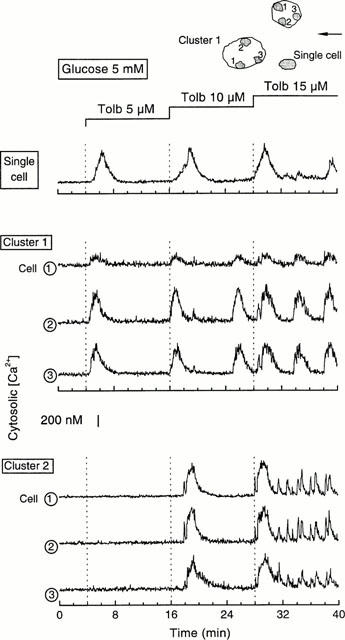
Synchrony of tolbutamide-induced [Ca2+]i changes within clusters and asynchrony of the signals between clusters and single cells. On top of the figure are drawn the two clusters comprising 14 cells (cluster 1) and seven cells (cluster 2), and the single cell that were studied simultaneously. The arrow indicates the direction of the perifusion flow. In each cluster, the signal was analysed on three regions marked 1–3. The concentration of tolbutamide was increased stepwise in the presence of 5 mM glucose.
Figure 5.
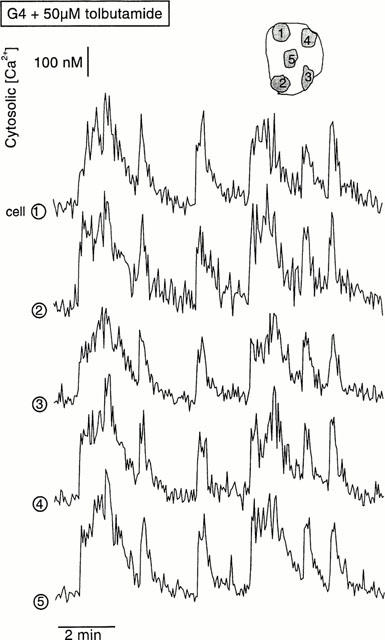
Example of the synchronization of [Ca2+]i changes induced by tolbutamide in the different cells of a cluster. The signal was analysed in the five non-contiguous regions marked 1–5, and covering each a portion of the five cells composing the cluster. The recording corresponds to steady-state stimulation with 50 μM tolbutamide in the presence of 4 mM glucose.
In only 4.5% of the clusters did we observe some cells that started to respond at different tolbutamide concentrations, and in only 2% of the clusters did we find occasional cells that remained inert in the presence of 100 μM tolbutamide. These small percentages are in keeping with those previously reported for glucose-stimulated clusters (Jonkers & Henquin, 2001). However, we cannot exclude the possibility that they are slightly underestimated because not all clusters were strictly monolayers, and inactive cells may have been masked by active ones. Anyhow, these experiments indicate that tolbutamide recruits islet single cells and clusters to generate a [Ca2+]i response, and that, within the recruited clusters, all or nearly all cells are active and respond synchronously.
Influence of tolbutamide on the [Ca2+]i responses induced in islet single cells and clusters by increasing glucose concentrations
We have recently described the characteristics of the effects of glucose concentrations between 6 and 20 mM (Jonkers & Henquin, 2001). The present study confirms that glucose recruits single β-cells and clusters over a narrow range of concentrations and that it also increases the amplitude of the individual response. Here, our aim was to investigate how a sulphonylurea influences these effects of glucose. To address this question we selected a concentration of tolbutamide (10 μM) that caused about 50% recruitment between 4 and 5 mM glucose.
Figure 6 illustrates the [Ca2+]i response recorded in different cells and clusters stimulated by increasing glucose concentrations in the absence or presence of 10 μM tolbutamide. The differences in threshold sensitivities are evident. Tolbutamide increased the sensitivity to glucose (Figure 7). Whereas the recruitment of active cells and clusters occurred between 5 and 10 mM glucose in the absence of the drug, it occurred between 3 and 6 – 7 mM glucose in its presence. Not more than 5% of single cells (probably α-cells) did not respond to high glucose in the presence of tolbutamide, as compared with 22% in its absence (Figure 7A). These experiments show that tolbutamide shifts to lower values the narrow range of concentrations over which glucose recruits single cells and clusters into an active [Ca2+]i state. The drug lowered the EC50 value from 6.0 to 4.3 mM glucose in single cells and from 5.8 to 4.2 mM in clusters (Figure 7).
Figure 6.
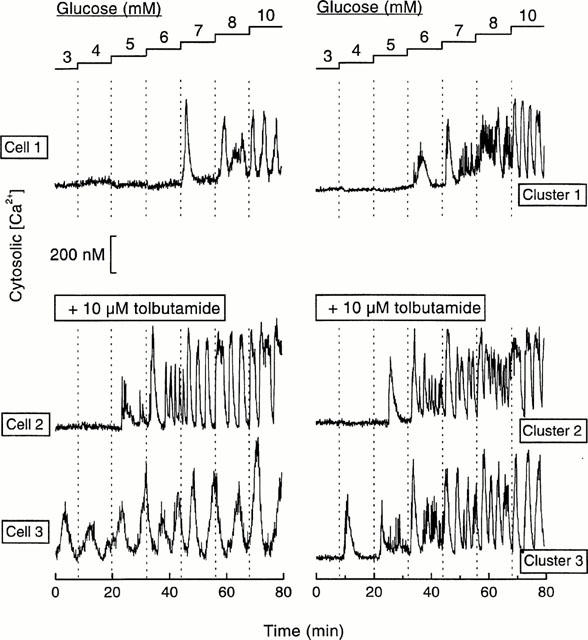
Examples of [Ca2+]i responses to increasing glucose concentrations in islet single cells or clusters perifused without or with 10 μM tolbutamide. Each glucose concentration was applied for 12 min. Cell 1 and cluster 1 showed a glucose sensitivity threshold at 7 and 6 mM, respectively, in the absence of tolbutamide. Cells 2 and 3, and clusters 2 and 3 showed different sensitivities to glucose in the presence of 10 μM tolbutamide. The quantification of these results are shown in Figures 7 and 8.
Figure 7.
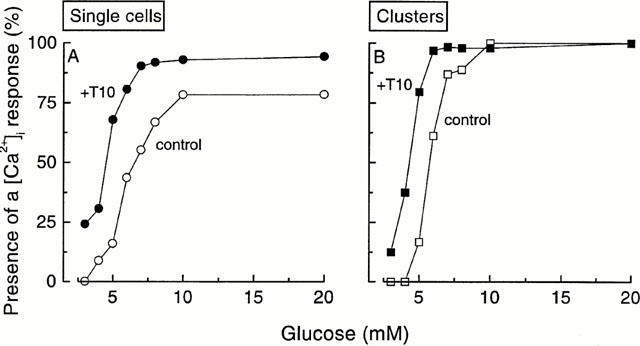
Influence of 10 μM tolbutamide (T10) on the recruitment of single islet cells and clusters by increasing glucose concentrations. The results were obtained from experiments similar to those shown in Figure 6. The total numbers of single cells and clusters analysed without tolbutamide were 69 and 54, respectively, and those in the presence of tolbutamide were 62 single cells and 64 clusters. These cells and clusters were obtained in 13 different cultures.
Raising the glucose concentration also augmented mean [Ca2+]i in control single cells and clusters (Figure 8) as a result of both recruitment of more and more active cells and increase in their individual response (Figure 8C,D). Similar changes were observed in the presence of 10 μM tolbutamide, with, however, an increase in the amplitude of the maximum response and a slight lowering of the EC50 values: from 7.4 to 6.3 mM glucose in single cells and 7.4 to 6.5 mM glucose in clusters (Figure 8A,B). Tolbutamide, therefore, sensitizes to glucose and augments the magnitude of the mean [Ca2+]i rise that increasing glucose concentrations produce in individual cells and clusters.
Figure 8.
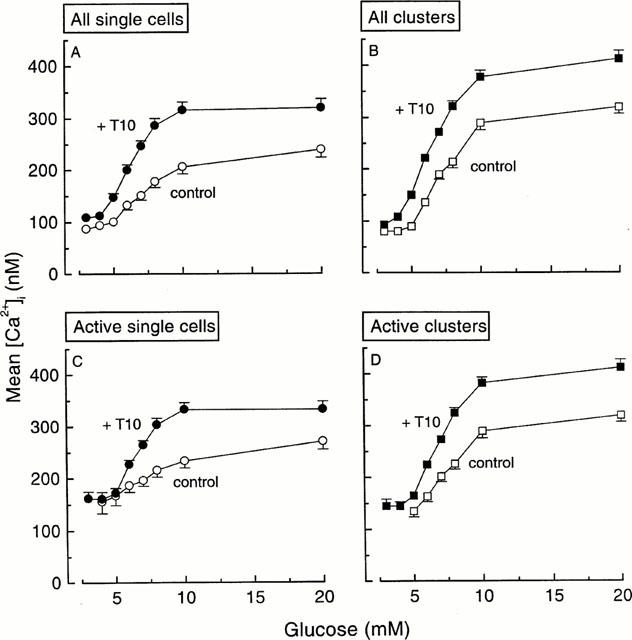
Influence of 10 μM tolbutamide (T10) on the rise in average [Ca2+]i produced in single cells and clusters by increasing glucose concentrations. At each glucose concentration mean [Ca2+]i was calculated for every single cell and cluster. (A and B) show mean [Ca2+]i for all cells and clusters even when there was no elevation of [Ca2+]i. The observed increase in [Ca2+]i thus reflects both the recruitment of cells and clusters and the increase in the individual responses. (C and D) show mean [Ca2+]i when only active cells and clusters are considered. The n values thus increase with the glucose concentrations. These curves therefore illustrate the increase in amplitude of the individual responses.
Discussion
The rise in [Ca2+]i produced by tolbutamide in β-cells results from a closure of K+-ATP channels by the drug, with subsequent membrane depolarization and Ca2+ influx through voltage-dependent Ca2+ channels (Grapengiesser et al., 1990; Herchuelz et al., 1991; Gilon & Henquin, 1992). By monitoring this rise we show here that tolbutamide recruits β-cells as does glucose (Jonkers & Henquin, 2001). Our model of single cells and clusters of cells prepared from the same islets also permitted us to evaluate the impact of cell association (as in the intact islet) on the individual β-cell response to the drug.
The threshold concentration of tolbutamide inducing a [Ca2+]i rise was variable between individual isolated β-cells. Hence, the proportion of active cells increased with the rise in the tolbutamide concentration (recruitment). This variability might reflect marked differences in the number of K+-ATP channels in the plasma membrane of distinct β-cells. The hypothesis is difficult to test directly. Estimates of the whole cell K+-ATP current have yielded variable results between studies and, within individual studies, also between β-cells (discussed by Kinard et al., 1999). The significance of these differences is unclear when one considers that over 95% of the channels have to be closed for the β-cell to depolarize (Cook et al., 1988) and that the recruitment of β-cells by glucose occurs over a narrow range of concentrations (Jonkers & Henquin, 2001; this study). One indirect argument against the hypothesis is provided by the measurements of similar total K+-ATP currents in single β-cells that did or did not release insulin in response to glucose (Soria et al., 1991). An alternative explanation is that the observed differences in sensitivity to tolbutamide are only apparent and reflect differences in glucose metabolism between β-cells (Kiekens et al., 1992). As a result, the ATP : ADP ratio might be different (Detimary et al., 1998) and the K+-ATP channels closed to different extents by glucose. This would of course explain β-cell recruitment by increasing glucose concentrations, but might also account for the effects of tolbutamide: a higher drug concentration is needed to close enough channels in the less metabolically active cells. Another factor further complicates the mechanistic interpretation. Changes in adenine nucleotides in β-cells not only directly influence K+-ATP channels but may also modulate the inhibitory action of sulphonylureas (Schwanstecher et al., 1994; Panten et al., 1996; Ashcroft & Gribble, 1999). This interaction is too complex, with paradoxical enhancing effects of Mg2+ ADP, to permit any prediction of how the small changes in glucose concentration applied here will influence the genuine action of tolbutamide on the channel.
Recruitment by tolbutamide, and glucose (Jonkers & Henquin, 2001), was also observed when β-cells were associated in clusters which are more representative of the physiological situation of the cells within islets. Raising the tolbutamide concentration induced a [Ca2+]i response in an increasing proportion of clusters. The difference with single cells did not reside in the tolbutamide or glucose sensitivities (EC50 were similar: ∼14 and ∼4 μM tolbutamide in 4 and 5 mM glucose) but in the maximum response. All clusters responded, whereas 25% of single cells did not respond to glucose alone and 5 – 10% did not respond to the combination of glucose and tolbutamide. These silent cells may be unrecognized α-cells included in the analysis. Although differences were observed between clusters, virtually no recruitment occurred within clusters. Thus, in less than 5% of the active clusters was there evidence for the presence of cells with different threshold sensitivities to tolbutamide. Once a cluster was active, all cells were active. We attribute this homogeneity of the response to the electrical coupling of β-cells (Meissner, 1976; Eddlestone et al., 1984). The synchrony of the membrane potential changes induced by sulphonylureas in distinct β-cells from the same islet does not seem to have been verified experimentally. However, our results show that tolbutamide-induced [Ca2+]i oscillations are as well synchronized as are glucose-induced oscillations (Jonkers & Henquin, 2001). The synchronization was excellent between all cells of the clusters but not between clusters or isolated cells. This supports the interpretation that electrical coupling rather than an extracellular, diffusible factor, ensures the homogeneity of the response. Further argument for this proposal is provided by the fact that the [Ca2+]i signals are synchronized when they are driven by changes in membrane potential and Ca2+ influx (glucose and tolbutamide) (Jonkers & Henquin, 2001; this study) and asynchronous when they result from a mobilization of intracellular Ca2+ (acetylcholine in the absence of Ca2+ influx) (Jonkers et al., 1999). A different view has been expressed on the basis of experiments using aggregated insulin-secreting MIN6 cells. Tolbutamide also induced synchronous [Ca2+]i oscillations in adjacent cells, but this synchrony was not disrupted by putative blockers of gap junctions (Squires et al., 2000). However, it is not certain that electrical coupling was abrogated under these experimental conditions. In our hands, blockers of gap junctions such as heptanol or 18-α-glycyrrehetinic acid cannot reliably be used to uncouple β-cells because of side effects that alter [Ca2+]i even in isolated cells (Perez-Armendariz et al., 1991; Jonkers et al., 1999).
An important observation of the present study is that tolbutamide causes a concentration-dependent increase in the magnitude of the individual [Ca2+]i responses, as does glucose (Jonkers & Henquin, 2001; this study). Recruitment of single β-cells or clusters into an active state was complete well before the elevation of [Ca2+]i reached a maximum; EC50 values for recruitment were 3.5 – 5-fold lower (∼14 and ∼4 μM tolbutamide at 4 and 5 mM glucose) than EC50 values for the elevation of mean [Ca2+]i (∼50 and ∼25 μM tolbutamide). The bursts of action potentials that sulphonylureas produce in β-cells in vitro (Henquin & Meissner, 1982) and in vivo (Gomis & Valdeolmillos, 1998), reflect the influx of Ca2+. In intact mouse islets studied in vitro, this Ca2+-dependent electrical activity increases with the concentration of tolbutamide provided a minimum concentration of glucose is present (Henquin, 1998). The present study establishes that this holds true for the [Ca2+]i changes. Gradual blockade of K+-ATP channels by a pharmacological agent largely reproduces the effects of a gradual rise in the glucose concentration. This similarity, therefore, reinforces the view that K+-ATP channels remain the major target (not necessarily the only one) on which suprathreshold glucose concentrations act to control the production of a triggering signal for insulin secretion (Henquin, 1988). The increase in the maximum [Ca2+]i rise brought about by tolbutamide can be explained by the fact that maximally effective concentrations of glucose do not close all K+-ATP channels in mouse β-cells studied at 37°C. Tolbutamide still increases Ca2+-dependent electrical activity and insulin secretion in mouse islets stimulated by 30 – 40 mM glucose (Henquin, 1988).
The reported effects of tolbutamide on β-cell [Ca2+]i occurred over a similar concentration range as that characterizing stimulation by the drug of β-cell electrical activity and insulin secretion in mouse islets (Henquin, 1988; 1998; Panten et al., 1989). It may seem surprising that marked effects of tolbutamide were already observed at lower concentrations than the therapeutic plasma concentrations (Sartor et al., 1980; Cattaneo et al., 1990). However, one should always bear in mind that sulphonylureas are largely bound to albumin the concentration of which is lower in the solutions used in vitro than in plasma. The range of 5 – 50 μM tolbutamide in our solutions covers the range of free tolbutamide concentrations in the plasma of chronically treated patients (Panten et al., 1989). At these concentrations, the drug does not erase the differences in glucose sensitivity existing between β-cells or between clusters. At higher concentrations causing a [Ca2+]i rise in all cells, tolbutamide would obviously mask the recruiting effect of glucose. A similar confounding action might also be expected from the use of low concentrations of sulphonylureas which, like glibenclamide (Hellman et al., 1984), accumulate in β-cells and become more and more active with time (Panten et al., 1989). Nevertheless, complete recruitment of β-cells to generate a triggering signal does not imply complete functional homogeneity. A variable secretory response remains possible in face of a similar triggering signal if the amplifying signals are different (Henquin, 2000; Jonkers & Henquin, 2001). This might explain the heterogeneous degranulation of β-cells within islets of rats treated with glibenclamide in vivo (Stefan et al., 1987; Rahier et al., 1989; Jorns, 1994).
Acknowledgments
This work was supported by grants 3.4552.98 and 3.4594.99 from the Fonds de la Recherche Scientifique Médicale, Brussels; by grant ARC 00/05-260 from the General Direction of Scientific Research of the French Community of Belgium; and by the Interuniversity Poles of Attraction Programme (P4/21), Belgian State Prime Minister's Office. F. Jonkers was holding a research fellowship from the FRIA, Brussels. We are grateful to V. Lebec for editorial assistance.
Abbreviations
- [Ca2+]i
cytoplasmic Ca2+ concentration
- K+-ATP channels
ATP-sensitive K+ channels
References
- AGUILAR-BRYAN L., BRYAN J. Molecular biology of adenosine triphosphate-sensitive potassium channels. Endocr. Rev. 1999;20:101–135. doi: 10.1210/edrv.20.2.0361. [DOI] [PubMed] [Google Scholar]
- ASHCROFT F.M., GRIBBLE F.M. ATP-sensitive K+ channels and insulin secretion: their role in health and disease. Diabetologia. 1999;42:903–919. doi: 10.1007/s001250051247. [DOI] [PubMed] [Google Scholar]
- ASHCROFT F.M., RORSMAN P. Electrophysiology of the pancreatic beta-cell. Prog. Biophys. Mol. Biol. 1989;54:87–143. doi: 10.1016/0079-6107(89)90013-8. [DOI] [PubMed] [Google Scholar]
- BAETENS D., MALAISSE-LAGAE F., PERRELET A., ORCI L. Endocrine pancreas: three-dimensional reconstruction shows two types of islets of Langerhans. Science. 1979;206:1323–1324. doi: 10.1126/science.390711. [DOI] [PubMed] [Google Scholar]
- BERTS A., GYLFE E., HELLMAN B. Ca2+ oscillations in pancreatic islet cells secreting glucagon and somatostatin. Biochem. Biophys. Res. Commun. 1995;208:644–649. doi: 10.1006/bbrc.1995.1387. [DOI] [PubMed] [Google Scholar]
- BOSCO D., MEDA P. Actively synthesizing β-cells secrete preferentially after glucose stimulation. Endocrinology. 1991;129:3157–3166. doi: 10.1210/endo-129-6-3157. [DOI] [PubMed] [Google Scholar]
- CATTANEO A.G., CAVIEZEL F., POZZA G. Pharmacological interaction between tolbutamide and acetylsalicylic acid: study on insulin secretion in man. Int. J. Clin. Pharmacol. Ther. Toxicol. 1990;28:229–234. [PubMed] [Google Scholar]
- COOK D.L., SATIN L.S., ASHFORD M.L., HALES C.N. ATP-sensitive K+ channels in pancreatic β-cells. Spare-channel hypothesis. Diabetes. 1988;37:495–498. doi: 10.2337/diab.37.5.495. [DOI] [PubMed] [Google Scholar]
- DETIMARY P., DEJONGHE S., LING Z., PIPELEERS D., SCHUIT F., HENQUIN J.C. The changes in adenine nucleotides measured in glucose-stimulated rodent islets occur in β-cells but not in α-cells and are also observed in human islets. J. Biol. Chem. 1998;273:33905–33908. doi: 10.1074/jbc.273.51.33905. [DOI] [PubMed] [Google Scholar]
- EDDLESTONE G.T., GONCALVES A., BANGHAM J.A., ROJAS E. Electrical coupling between cells in islets of Langerhans from mouse. J. Membr. Biol. 1984;77:1–14. doi: 10.1007/BF01871095. [DOI] [PubMed] [Google Scholar]
- GEMBAL M., DETIMARY P., GILON P., GAO Z.Y., HENQUIN J.C. Mechanisms by which glucose can control insulin release independently from its action on adenosine triphosphate-sensitive K+ channels in mouse β-cells. J. Clin. Invest. 1993;91:871–880. doi: 10.1172/JCI116308. [DOI] [PMC free article] [PubMed] [Google Scholar]
- GEMBAL M., GILON P., HENQUIN J.C. Evidence that glucose can control insulin release independently from its action on ATP-sensitive K+ channels in mouse B-cells. J. Clin. Invest. 1992;89:1288–1295. doi: 10.1172/JCI115714. [DOI] [PMC free article] [PubMed] [Google Scholar]
- GILON P., HENQUIN J.C. Influence of membrane potential changes on cytoplasmic Ca2+ concentration in an electrically excitable cell, the insulin-secreting pancreatic B-cell. J. Biol. Chem. 1992;267:20713–20720. [PubMed] [Google Scholar]
- GOMIS A., VALDEOLMILLOS M. Regulation by tolbutamide and diazoxide of the electrical activity in mouse pancreatic β-cells recorded in vivo. Br. J. Pharmacol. 1998;123:443–448. doi: 10.1038/sj.bjp.0701628. [DOI] [PMC free article] [PubMed] [Google Scholar]
- GRAPENGIESSER E., GYLFE E., HELLMAN B. Sulfonylurea mimics the effect of glucose in inducing large amplitude oscillations of cytoplasmic Ca2+ in pancreatic β-cells. Mol. Pharmacol. 1990;37:461–467. [PubMed] [Google Scholar]
- HAUGE-EVANS A.C., SQUIRES P.E., PERSAUD S.J., JONES P.M. Pancreatic β-cell-to-β-cell interactions are required for integrated responses to nutrient stimuli. Enhanced Ca2+ and insulin secretory responses of MIN6 pseudoislets. Diabetes. 1999;48:1402–1408. doi: 10.2337/diabetes.48.7.1402. [DOI] [PubMed] [Google Scholar]
- HELLMAN B., SEHLIN J., TALJEDAL I.B. Glibenclamide is exceptional among hypoglycaemic sulphonylureas in accumalating progressively in β-cell-rich pancreatic islets. Acta Endocrinol. 1984;105:385–390. doi: 10.1530/acta.0.1050385. [DOI] [PubMed] [Google Scholar]
- HENQUIN J.C. ATP-sensitive K+ channels may control glucose-induced electrical activity in pancreatic β-cells. Biochem. Biophys. Res. Commun. 1988;156:769–775. doi: 10.1016/s0006-291x(88)80910-0. [DOI] [PubMed] [Google Scholar]
- HENQUIN J.C. A minimum of fuel is necessary for tolbutamide to mimic the effects of glucose on electrical activity in pancreatic B-cells. Endocrinology. 1998;139:993–998. doi: 10.1210/endo.139.3.5783. [DOI] [PubMed] [Google Scholar]
- HENQUIN J.C. Triggering and amplifying pathways of regulation of insulin secretion by glucose. Diabetes. 2000;49:1751–1760. doi: 10.2337/diabetes.49.11.1751. [DOI] [PubMed] [Google Scholar]
- HENQUIN J.C., MEISSNER H.P. Opposite effects of tolbutamide and diazoxide on 86Rb+ fluxes and membrane potential in pancreatic β-cells. Biochem. Pharmacol. 1982;31:1407–1415. doi: 10.1016/0006-2952(82)90036-3. [DOI] [PubMed] [Google Scholar]
- HERCHUELZ A., POCHET R., PASTIELS C., VAN PRAET A. Heterogeneous changes in [Ca2+]i induced by glucose, tolbutamide and K+ in single rat pancreatic B-cells. Cell Calcium. 1991;12:577–586. doi: 10.1016/0143-4160(91)90076-q. [DOI] [PubMed] [Google Scholar]
- HIRIART M., RAMIREZ-MEDELES M.C. Functional subpopulations of individual pancreatic B-cells in culture. Endocrinology. 1991;128:3193–3198. doi: 10.1210/endo-128-6-3193. [DOI] [PubMed] [Google Scholar]
- JONAS J.C., GILON P., HENQUIN J.C. Temporal and quantitative correlations between insulin secretion and stably elevated or oscillatory cytoplasmic Ca2+ in mouse pancreatic β cells. Diabetes. 1998;47:1266–1273. doi: 10.2337/diab.47.8.1266. [DOI] [PubMed] [Google Scholar]
- JONKERS F., JONAS J.C., GILON P., HENQUIN J.C. Influence of cell number on the characteristics and synchrony of Ca2+ oscillations in clusters of mouse pancreatic islet cells. J. Physiol. 1999;520:839–849. doi: 10.1111/j.1469-7793.1999.00839.x. [DOI] [PMC free article] [PubMed] [Google Scholar]
- JONKERS F.C., HENQUIN J.C. Cytosolic Ca2+ measurements in islet cell clusters reveal β-cell recruitment and increase of the individual responses by glucose. Diabetes. 2001;50:540–550. doi: 10.2337/diabetes.50.3.540. [DOI] [PubMed] [Google Scholar]
- JORNS A. Immunocytochemical and ultrastructural heterogeneities of normal and glibenclamide stimulated pancreatic beta cells in the rat. Virchows Archiv. 1994;425:305–313. doi: 10.1007/BF00196154. [DOI] [PubMed] [Google Scholar]
- KIEKENS R., IN'T VELD P.A., MAHLER T., SCHUIT F., VAN DE WINKEL M., PIPELEERS D.G. Differences in glucose recognition by individual rat pancreatic B cells are associated with intercellular differences in glucose-induced biosynthetic activity. J. Clin. Invest. 1992;89:117–125. doi: 10.1172/JCI115551. [DOI] [PMC free article] [PubMed] [Google Scholar]
- KINARD T.A., DE VRIES G., SHERMAN A., SATIN L.S. Modulation of the bursting properties of single mouse pancreatic β-cells by artificial conductances. Biophys. J. 1999;76:1423–1435. doi: 10.1016/S0006-3495(99)77303-0. [DOI] [PMC free article] [PubMed] [Google Scholar]
- LEWIS C.E., CLARK A., ASHCROFT S.J.H., COOPER G.J.S., MORRIS J.F. Calcitonin gene-related peptide and somatostatin inhibit insulin release from individual rat B-cells. Mol. Cell. Endocrinol. 1988;57:41–49. doi: 10.1016/0303-7207(88)90030-5. [DOI] [PubMed] [Google Scholar]
- MEISSNER H.P. Electrophysiological evidence for coupling between β-cells of pancreatic islets. Nature. 1976;262:502–504. doi: 10.1038/262502a0. [DOI] [PubMed] [Google Scholar]
- NADAL A., QUESADA I., SORIA B. Homologous and heterologous asynchronicity between identified α-, β- and δ-cells within intact islets of Langerhans in the mouse. J. Physiol. 1999;517:85–93. doi: 10.1111/j.1469-7793.1999.0085z.x. [DOI] [PMC free article] [PubMed] [Google Scholar]
- PANTEN U., BURGFELD J., GOERKE F., RENNICKE M., SCHWANSTECHER M., WALLASCH A., ZÜNKLER B.J., LENZEN S. Control of insulin secretion by sulfonylureas, meglitinide and diazoxide in relation to their binding to the sulfonylurea receptor in pancreatic islets. Biochem. Pharmacol. 1989;38:1217–1229. doi: 10.1016/0006-2952(89)90327-4. [DOI] [PubMed] [Google Scholar]
- PANTEN U., SCHWANSTECHER M., SCHWANSTECHER C.Mode of action of sulfonylureas Oral Antidiabetics 1996Berlin, Heidelberg: Springer Verlag; 129–159.eds. Kuhlmann, J., Puls, W. pp [Google Scholar]
- PEREZ-ARMENDARIZ M., ROY C., SPRAY D.C., BENNETT M.V. Biophysical properties of gap junctions between freshly dispersed pairs of mouse pancreatic beta cells. Biophys. J. 1991;59:76–92. doi: 10.1016/S0006-3495(91)82200-7. [DOI] [PMC free article] [PubMed] [Google Scholar]
- PIPELEERS D., KIEKENS R., LING Z., WILIKENS A., SCHUIT F. Physiologic relevance of heterogeneity in the pancreatic beta-cell population. Diabetologia. 1994;37:S57–S64. doi: 10.1007/BF00400827. [DOI] [PubMed] [Google Scholar]
- RAHIER J., STEVENS M., DE MENTEN Y., HENQUIN J.C. Determination of antigen concentration in tissue sections by immunodensitometry. Lab. Invest. 1989;61:357–363. [PubMed] [Google Scholar]
- SALOMON D., MEDA P. Heterogeneity and contact-dependent regulation of hormone secretion by individual B cells. Exp. Cell. Res. 1986;162:507–520. doi: 10.1016/0014-4827(86)90354-x. [DOI] [PubMed] [Google Scholar]
- SARTOR G., MELANDER A., SCHERSTEN B., WAHLIN-BOLL E. Influence of food and age on the single-dose kinetics and effects of tolbutamide and chlorpropamide. Eur. J. Clin. Pharmacol. 1980;17:285–293. doi: 10.1007/BF00625802. [DOI] [PubMed] [Google Scholar]
- SATIN L.S. New mechanisms for sulfonylurea control of insulin secretion. Endocrine. 1996;4:191–198. doi: 10.1007/BF02738684. [DOI] [PubMed] [Google Scholar]
- SATO Y., AIZAWA T., KOMATSU M., OKADA N., YAMADA T. Dual functional role of membrane depolarization/Ca2+ influx in rat pancreatic β-cell. Diabetes. 1992;41:438–443. doi: 10.2337/diab.41.4.438. [DOI] [PubMed] [Google Scholar]
- SATO Y., HENQUIN J.C. The K+-ATP channel-independent pathway of regulation of insulin secretion by glucose. In search of the underlying mechanism. Diabetes. 1998;47:1713–1721. doi: 10.2337/diabetes.47.11.1713. [DOI] [PubMed] [Google Scholar]
- SCHUIT F.C., IN'T VELD P.A., PIPELEERS D.G. Glucose stimulates proinsulin biosynthesis by a dose-dependent recruitment of pancreatic β cells. Proc. Natl. Acad. Sci. U.S.A. 1988;85:3865–3869. doi: 10.1073/pnas.85.11.3865. [DOI] [PMC free article] [PubMed] [Google Scholar]
- SCHWANSTECHER C., DICKEL C., PANTEN U. Interaction of tolbutamide and cytosolic nucleotides in controlling the ATP-sensitive K+ channel in mouse β-cells. Br. J. Pharmacol. 1994;111:302–310. doi: 10.1111/j.1476-5381.1994.tb14060.x. [DOI] [PMC free article] [PubMed] [Google Scholar]
- SEMPOUX C., GUIOT Y., DUBOIS D., NOLLEVAUX M.C., SAUDUBRAY J.M., NIHOUL-FEKETE C., RAHIER J. Pancreatic β-cells proliferation in persistent hyperinsulinemic hypoglycemia of infancy: an immunohistochemical study of 18 cases. Mod. Pathol. 1998;11:444–449. [PubMed] [Google Scholar]
- SORIA B., CHANSON M., GIORDANO E., BOSCO D., MEDA P. Ion channels of glucose-responsive and -unresponsive β-cells. Diabetes. 1991;40:1069–1078. doi: 10.2337/diab.40.8.1069. [DOI] [PubMed] [Google Scholar]
- SQUIRES P.E., HAUGE-EVANS A.C., PERSAUD S.J., JONES P.M. Synchronization of Ca2+-signals within insulin-secreting pseudoislets: effects of gap-junctional uncouplers. Cell Calcium. 2000;27:287–296. doi: 10.1054/ceca.2000.0117. [DOI] [PubMed] [Google Scholar]
- STEFAN Y., MEDA P., NEUFELD M., ORCI L. Stimulation of insulin secretion reveals heterogeneity of pancreatic B cells in vivo. J. Clin. Invest. 1987;80:175–183. doi: 10.1172/JCI113045. [DOI] [PMC free article] [PubMed] [Google Scholar]
- YAEKURA K., KAKEI M., YADA T. cAMP signaling pathway acts in selective synergism with glucose or tolbutamide to increase cytosolic Ca2+ in rat pancreatic β-cells. Diabetes. 1996;45:295–301. doi: 10.2337/diab.45.3.295. [DOI] [PubMed] [Google Scholar]


