

Abstract
The present work was devoted to the study of A3 adenosine receptors in Jurkat cells, a human leukemia line.
The A3 subtype was found by means of RT-PCR experiments and characterized by using the new A3 adenosine receptor antagonist [3H]-MRE 3008F20, the only A3 selective radioligand currently available. Saturation experiments revealed a single high affinity binding site with KD of 1.9±0.2 nM and Bmax of 1.3±0.1 pmol mg−1 of protein.
The pharmacological profile of [3H]-MRE 3008F20 binding on Jurkat cells was established using typical adenosine ligands which displayed a rank order of potency typical of the A3 subtype.
Thermodynamic data indicated that [3H]-MRE 3008F20 binding to A3 subtype in Jurkat cells was entropy- and enthalpy-driven, according with that found in cells expressing the recombinant human A3 subtype.
In functional assays the high affinity A3 agonists Cl-IB-MECA and IB-MECA were able to inhibit cyclic AMP accumulation and stimulate Ca2+ release from intracellular Ca2+ pools followed by Ca2+ influx.
The presence of the other adenosine subtypes was investigated in Jurkat cells. A1 receptors were characterized using [3H]-DPCPX binding with a KD of 0.9±0.1 nM and Bmax of 42±3 fmol mg−1 of protein. A2A receptors were studied with [3H]-SCH 58261 binding and revealed a KD of 2.5±0.3 nM and a Bmax of 1.4±0.2 pmol mg−1 of protein.
In conclusion, by means of the first antagonist radioligand [3H]-MRE 3008F20 we could demonstrate the existence of functional A3 receptors on Jurkat cells.
Keywords: Jurkat T cells, A3 receptors, [3H]-MRE 3008F20 binding, adenylyl cyclase, calcium
Introduction
Adenosine exerts a number of physiological functions through activation of four cell membrane receptors classified as A1, A2A, A2B and A3 (Olah & Stiles, 1995). The latter most recently discovered subtype (Zhou et al., 1992) is the subject of intensive pharmacological characterization. Although all adenosine subclasses belong to the G protein-coupled receptors they are associated with different second messenger systems (Linden et al., 1999; Fredholm et al., 2000). The A3 subtype has a characteristic second messenger profile, in that it has been shown to mediate adenylyl cyclase inhibition (Zhou et al., 1992; Olah & Stiles, 1995) and phospholipase C activation (Ramkumar et al., 1993; Abbracchio et al., 1995). In vitro studies revealed that in the promyelocytic HL-60 human leukemia cells, stimulation of A3 receptors results in the mobilization of Ca2+ from intracellular and extracellular sources (Kohno et al., 1996a). Similar effects have been observed in human peripheral blood eosinophils which have been demonstrated to express high levels of the A3 receptor (Kohno et al., 1996b) and in rat cardiomyocytes (Shneyvays et al., 2000). Development of high affinity agonists and antagonists has made possible pharmacologic studies of the A3 receptor to obtain important information on the pathophysiological function of this adenosine subtype (Jacobson et al., 1995; Baraldi & Borea, 2000). The A3 receptor plays a role in modulation of cerebral ischemia (von lubitz et al., 1999), inflammation (Ezeamuzie & Philips, 1999), hypotension (Hannon et al., 1995), mast cell degranulation (Fozard et al., 1996), asthma (Forsythe & Ennis, 1999), ischaemic heart pre-conditioning (Liang & Jacobson, 1998) and cell growth (Jacobson et al., 1998; Abbracchio et al., 1998; Brambilla et al., 2000). These and other findings have made the A3 receptor a promising therapeutic target (Jacobson, 1998). However activation of A3 receptors would require relatively high physiological concentrations of adenosine, such as those occurring during hypoxic stress, inflammation or cancer; the Ki value of adenosine in binding to the rat A3 receptor has been estimated to be about 1 μM versus 10 and 30 nM at rat A1 and A2A receptors (Jacobson et al., 1995). Thus the physiological role of A3 receptors may be very different from that of A1 and A2A subtypes, which are likely to be partially activated by adenosine under basal conditions.
Earlier pharmacological works indicated that Jurkat T cells express mRNA for the A2A and A2B but not the A3 receptors (van der Ploegh et al., 1996; Mirabet et al., 1997). The goal of our work was to demonstrate the constitutive presence of A3 receptors in Jurkat cells, a human leukemia line, by means of RT-PCR experiments and radioligand binding assays performed with the selective antagonist radioligand [3H]-5N-(4-methoxyphenylcarbamoyl)amino-8-propyl-2-(2-furyl)-pyrazolo[4,3-e]1,2,4-triazolo [1,5-c]-pyrimidine ([3H]-MRE 3008F20) (Varani et al., 2000). Moreover, the effects of high affinity and selective A3 agonists on the inhibition of adenylyl cyclase activity and on the induction of Ca2+ release have been evaluated. Finally, to obtain insights on the forces driving the coupling of the human A3 adenosine receptor with a selective ligand, a thermodynamic analysis of [3H]-MRE 3008F20 binding was performed (Borea et al., 1995).
Methods
Cell culture conditions
Jurkat cells were grown in RPMI-1640 medium supplemented with L-glutamine (2 mM), penicillin (100 u ml−1), streptomycin (100 μg ml−1) and 10% foetal calf serum, at 37°C in humidified air with 5% carbon dioxide.
Membrane preparation
Cells were harvested and homogenized in ice-cold hypotonic buffer (5 mM Tris HCl, 2 mM EDTA, pH 7.4) with a Polytron (Kinematica). After 30 min on ice, the homogenate was spun for 10 min at 1,000×g. The supernatant was then centrifuged for 30 min at 100,000×g. The membrane pellet was resuspended in 50 mM Tris HCl buffer pH 7.4 (50 mM Tris HCl, 10 mM MgCl2, 1 mM EDTA) and incubated with 3 IU ml−1 of adenosine deaminase for 30 min at 37°C. Then the suspension was frozen at −80°C.
RT-PCR
Total cytoplasmic RNA was extracted by the acid guanidinium thiocyanate phenol method (Chomczynski & Sacchi, 1987). The human A3 adenosine receptor sequence was amplified with 5′ primer sequence (ACG GTG AGG TAC CAC AGC TTG TG) and 3′ primer sequence (ATA CCG CGG GAT GGC AGA CC) giving a 156 bp product. RT-PCR was carried out by using Access RT-PCR System (Promega), in 50 μl at the following conditions: first strand cDNA synthesis at 48°C for 45 min and 94°C for 2 min. Second strand cDNA synthesis and PCR amplification at 94°C for 30 s, 59.5°C for 30 s and 68°C for 2 min (40 cycles). The oligonucleotide used as probe in Southern blot analysis was: ATG ATG AAC CCT ATC GTC TAT GCC TAT AAA. Sequence primers for β-actin were: 5′: TGG GAA TGG GTC AGA AGG ACT; 3′ TTT CAC GGT TGG CCT TAG GGT. Oligonucleotides were synthesized by M-Medical (Genenco-Life Science, Florence, Italy). Labelling of the probe and blotting were conducted as described in Dig-labelling and detection protocols (Boehringer-Mannheim, Mannheim, Germany). Briefly, RT-PCR products were separated in 1.2% agarose gel and transferred to a positively charged nylon membrane (ICN Biomedicals, Aurora, OH, U.S.A.) by Turboblotter system (Schleicher & Schuele, Keene, NH, U.S.A.) for 2 h. After hybridization, the digoxigenin-labelled A3-specific internal oligoprobe was visualized by chemiluminescent detection after incubation with a dilution of anti-digoxigenin Fab conjugated to alkaline phosphatase.
The human A1 adenosine receptor sequence was amplified with 5′ primer sequence (GGA TGC CAC CTT CTG CTT CAT) and 3′ primer sequence (CTC GAA CTC GCA CTT GAT CAC) giving a 394 bp product. The human A2A adenosine receptor sequence was amplified with 5′ primer sequence (GGG GTA CCA GTG GAG GGA GTG C) and 3′ primer sequence (AAG CCG CGG AGA AAG ATA AAG A) giving a 208 bp product. The human A2B adenosine receptor sequence was amplified with 5′ primer sequence (ACG GTA CCA CAA GAA ACA AAG AGG AC) and 3′ primer sequence (AAG CCG CGG AGC CTA CTA CTG ACA) giving a 153 bp product. The PCR was carried out in 50 μl using the following conditions: first strand cDNA synthesis: 48°C for 45 min and 94°C for 2 min. Second strand cDNA synthesis and PCR amplification: 94°C for 30 s, 59.5°C for 30 s (for A1) or 58.6°C (for A2A) or 54°C (for A2B) and 68 °C for 2 min (35 – 40 cycles). Subsequently, 10 μl of PCR products were run on the 2% agarose gel and examined by ethidium bromide staining.
[3H]-MRE 3008F20 binding assay
Binding assays were carried out according to Varani et al., 2000. In kinetic studies, Jurkat cells membranes were incubated with 2 nM [3H]-MRE 3008F20 in a thermostatic bath at 4°C. For the measurement of the association rate, the reaction was terminated at time points ranging from 5 to 200 min by rapid filtration under vacuum, followed by washing with 5 ml ice-cold buffer four times. The dissociation of [3H]-MRE 3008F20 from binding sites previously incubated with [3H]-MRE 3008F20 at 4°C for 120 min, was determined at time points ranging from 5 to 100 min after the addition of 1 μM MRE 3008F20. The binding of [3H]-MRE 3008F20 to Jurkat cells was carried out in a 96-well microplate in a total volume of 250 μl containing 50 mM Tris HCl buffer, 10 mM MgCl2, 1 mM EDTA, pH 7.4. In saturation experiments, 100 μl of membrane homogenate (60 μg of protein assay−1) were incubated in duplicate with 10 – 12 different concentrations of [3H]-MRE 3008F20 in the range 0.2 – 20 nM. In competition experiments, 2 nM [3H]-MRE 3008F20 was incubated in duplicate with at least 12 – 14 different concentrations of each of the agonists or antagonists examined. Incubation time was 120 min at 4°C to allow equilibrium to be reached. This temperature was chosen in consideration of the fact that A3 antagonist binding is prevalently enthalpy-driven (Varani et al., 2000). Analogous experiments were performed in the presence of 100 μM GTP. Non-specific binding, defined as binding in the presence of 1 μM MRE 3008F20, at the KD value for the radioligand was ≈30% of total binding. Bound and free radioactivity were separated by filtering the assay mixture through Whatman GF/B glass-fibre filters using a Micro-Mate 196 cell harvester (Packard Instrument Company). The filter bound radioactivity was counted on Top Count Microplate Scintillation Counter (efficiency 57%) with Micro-Scint 20. The protein concentration was determined according to a Bio Rad method (Bradford, 1976) with bovine albumin as a standard reference. Binding to A1 and A2A adenosine receptors was performed using [3H]-DPCPX and [3H]-SCH 58261, respectively, as already described (Varani et al., 2000).
Measurement of cyclic AMP levels
Jurkat cells (5×10⁶ cells assay−1) were suspended in 0.5 ml of incubation mixture (in mM): NaCl 150, KCl 2.7, NaH2PO4 0.37, MgSO4 1, CaCl2 1, glucose 5, HEPES 1, MgCl2 10, pH 7.4 37°C, containing 0.5 mM 4-(3-butoxy-4-methoxybenzyl)-2-imidazolidinone (Ro 20-1724) as phosphodiesterase inhibitor, 2.0 IU ml−1 adenosine deaminase and preincubated for 10 min in a shaking bath at 37°. Then typical A3 adenosine agonists plus forskolin (10 μM) were added to the mixture and incubated for a further 5 min. The effect of MRE 3008F20 was determined by antagonism of the inhibition of cyclic AMP production induced by 100 nM Cl-IB-MECA or IB-MECA. Analogous experiments were performed to evaluate the effect of HE-NECA and NECA on cyclic AMP levels production and their inhibition from SCH 58261. The reaction was terminated by the addition of cold 6% trichloroacetic acid (TCA). The TCA suspension was centrifuged at 2,000×g for 10 min at 4°C and the supernatant was extracted four times with water-saturated diethyl ether. The final aqueous solution was tested for cyclic AMP levels by a competition protein binding assay carried out essentially according to Varani et al., 1998. Samples of cyclic AMP standards (0 – 10 pmol) were added to each test tube containing Trizma base 0.1 M; aminophylline 8.0 mM; 2 mercaptoethanol 6.0 mM; pH 7.4 and [3H]-cyclic AMP in a total volume of 0.5 ml. The binding protein, previously prepared from bovine adrenal glands, was added to the samples previously incubated at 4°C for 150 min and, after the addition of charcoal, were centrifuged at 2,000 g for 10 min. The clear supernatant (0.2 ml) was mixed with 4 ml of Atomlight and counted in a LS-1800 Beckman scintillation counter.
Measurement of cytosolic Ca2+ concentration
Changes in [Ca2+]i were measured with the fluorescent indicator fura 2-AM, according to Mutini et al., 1999. Briefly, cells were loaded for 15 min with 2 μM fura 2-AM in RPMI 1640 at 37°C. The cells were centrifuged at 1,000×g for 10 min to remove extracellular dye and were resuspended in HBSS buffer (in mM): NaCl 120, KCl 5, MgCl2 0.4, CaCl2 0.4, HEPES 10, NaHCO3 10, glucose 10 and Na2HPO4 5, pH 7.4, at 2×10⁶ cells ml−1. Fluorescence was monitored with a LS50 (Perkin-Elmer, Norwalk, CT, U.S.A.) spectrofluorimeter in cuvettes thermostatically controlled at 37 °C and continuously stirred.
Thermodynamic analysis
For a generic binding equilibrium L+R=LR (L=ligand, R=receptor) the affinity association constant KA=KD−1 is directly related to the standard free energy ΔG° (ΔG°=− RT lnKA) which can be separated in its enthalpic and entropic contributions according to the Gibbs equation: ΔG°=ΔH° − TΔS°. The standard free energy was calculated as ΔG°=− RTlnKA at 298.15 K, the standard enthalpy, ΔH°, from the van't Hoff plot lnKA versus (1 T−1) (the slope of which is −ΔH° R−1) and the standard entropy as ΔS°=(ΔH° – ΔG°)T−1 with T=298.15 K and R=8.314 JK−1mol−1.
KA values were obtained from saturation experiments of [3H]-MRE 3008F20 binding to the A3 adenosine receptors in Jurkat cells performed at 0, 10, 15, 20, 25 and 30°C.
Data analysis
All binding studies (kinetics, saturation, competition) were analysed with the program LIGAND (Munson & Rodbard, 1980), which performs weighted, nonlinear, least squares curve-fitting to the general model of Feldman (Feldman, 1972), involving the interaction of several ligands with several independent classes of sites according to the law of mass action. Deviations of the observed points from the predicted values were weighted according to the reciprocal of the predicted variance. Competition curves were analysed using models for competition of radioligand and competitor for one or two independent sites. Results from fits using a two-site model were retained only when the two-site model fit the data significantly better than a one-site model, as determined by the partial F test at a significance level of P<0.05. EC50 and IC50 values in the cyclic AMP assay were calculated by non-linear regression analysis using the equation for a sigmoid concentration-response curve (GraphPAD Prism, San Diego, CA, U.S.A.). Data are presented as the arithmetic mean±s.e.mean. Schild analysis (Schild, 1957) was used to calculate pKB values of MRE 3008F20.
Materials
[3H]-MRE 3008F20 (specific activity 67 Ci mmol−1) was obtained from Amersham International (Buckinghamshire, U.K.). [3H]-DPCPX (specific activity 120 Ci mmol−1) was purchased from NEN Research Products (Boston, MA, U.S.A.). [3H]-SCH 58261 (specific activity 68 Ci mmol−1) was a kind gift of Dr E. Ongini, Schering-Plough Research Institute, Milan, Italy. NECA, R-PIA, S-PIA, CGS 21680, Cl-IB-MECA, IB-MECA, AB-MECA, CGS 15943, ZM 241385, DPCPX and XAC were obtained from Sigma-RBI (St. Louis, MO, U.S.A.). HE-NECA was a kind gift of Prof G. Cristalli, Department of Pharmaceutical Sciences, Camerino, Italy. SCH 58261, MPC-NECA, MPC-MECA, MRE 3010F20, MRE 3008F20, MRE 3019F20, MRE3023F20, MRE 3001F20 were synthesized by Prof P.G. Baraldi. Fura-2 acetoxymethyl ester (fura 2-AM) was from Calbiochem, Inalco, Spain. All other reagents were of analytical grade and obtained from commercial sources. Jurkat cells were kindly provided by Prof S. Capitani, Department of Morphology and Embryology, Human Anatomy Section, Ferrara, Italy.
Results
RT-PCR
Expression of the A3 adenosine receptors in Jurkat cells was shown by RT-PCR and detection using specific primers and an internal probe, respectively. Figure 1A shows the A3 amplification product from Jurkat cells (lane 2) compared with that of CHO cells stably transfected with human A3 receptors (positive control); no differences in β-actin mRNA levels were found between these samples (data not shown). Figure 1B displays the specificity of A3 primers to the A3 transcript. Jurkat cells contain also A1, A2A and A2B adenosine subtypes as revealed by RT-PCR experiments (Figure 1C).
Figure 1.
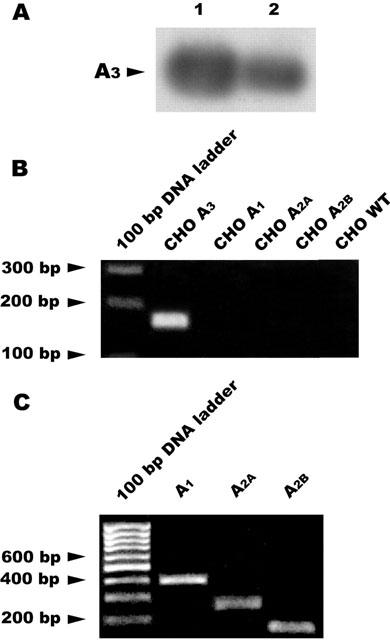
(A) Expression of the A3 transcript in Jurkat cells and in CHO cells transfected with hA3 receptors (positive control). Total RNA was extracted as described in Methods and used for RT-PCR. Lane 1, hA3CHO cells; lane 2, Jurkat cells. (B) Negative control of A3 primers using untransfected CHO cells (WT) and CHO cells transfected with A1, A2A and A2B receptors. (C) RT-PCR products obtained from Jurkat cells.
Kinetic studies
Kinetic studies showed that [3H]-MRE 3008F20 binding reached equilibrium after approximately 50 min and was stable for at least 7 h (Figure 2A). [3H]-MRE 3008F20 binding was rapidly reversed by the addition of 1 μM MRE 3008F20 (Figure 2B). Computer analysis revealed that both association and dissociation data fit a one component model significantly better than a two-component model (P<0.05), with the following rate constants: kobs=0.106±0.011 min−1 and k−1=0.048±0.004 min−1. From the k+1 (k+1=0.029±0.003 min−1 nM−1) and k−1 values, the apparent equilibrium dissociation constant (KD) was calculated to be 1.7 nM.
Figure 2.
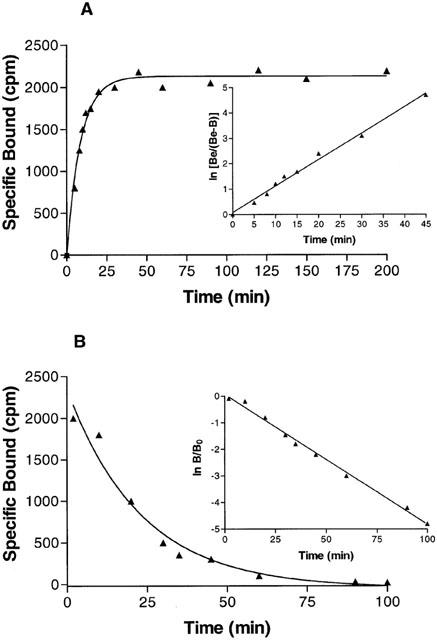
(A) Kinetics of [3H]-MRE 3008F20 binding to human A3 adenosine receptors with association curves representative of a single experiment. Inset, first-order plots of [3H]-MRE 3008F20 binding. (B) Kinetics of [3H]-MRE 3008F20 binding to human A3 adenosine receptors with dissociation curves representative of a single experiment. Inset, first-order plots of [3H]-MRE 3008F20 binding. The data shown are representative of three experiments, each performed in triplicate.
Saturation studies to A3 receptor subtype
Figure 3 reports a saturation curve of [3H]-MRE 3008F20 binding to the adenosine A3 receptor in Jurkat cells. The linearity of the Scatchard plot in the inset failed to show a significantly better fit to a two-site than to a one-site binding model, indicating that only one class of high affinity binding sites was present under our experimental conditions (Munson & Rodbard, 1980). The KD value was 1.9±0.2 nM and Bmax value was 1.3±0.1 pmol mg−1 protein (n=4).
Figure 3.
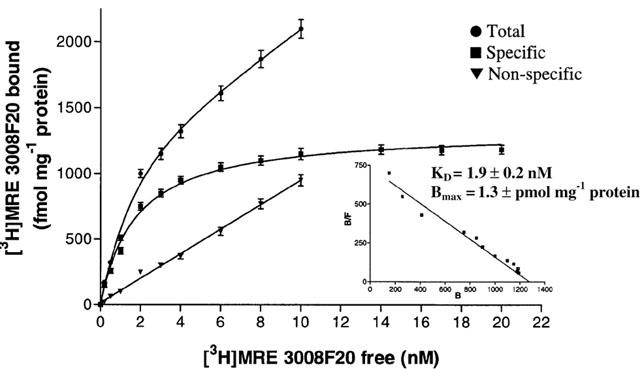
Saturation of [3H]-MRE 3008-F20 binding to A3 adenosine receptors in Jurkat cells. Experiments were performed as described in Methods. Values are the means and vertical lines s.e.mean of four separate experiments performed in triplicate. In the inset the Scatchard plot of the same data is shown.
Competition studies
Antagonist competition curves for [3H]-MRE 3008F20 binding showed a rank order of potency of MRE3001F20> MRE3008F20>MRE 3010F20>MRE 3019F20>MRE 3023F20>XAC>CGS 15943>DPCPX each of which exhibited Hill slopes near to unity (Figure 4A, Table 1). SCH 58261 showed a Ki value>10 μM. The competition curves of all agonists were best fitted assuming a two-state model corresponding to high and low affinity states of the A3 adenosine receptor for agonists (Figure 4B), a phenomenon expected for a G-protein-coupled receptor. Affinities are reported in Table 1 as Ki, KH and KL values, the percentage of receptors in the high affinity state (RH) and Hill coefficients are also shown. The order of potency in [3H]-MRE 3008F20 inhibition assays for adenosine receptor agonists resulted to be: Cl-IB-MECA>IB-MECA>MPC-NECA>AB-MECA>HE-NECA>NECA>R-PIA>MPC-MECA>S-PIA>CGS 21680. R-PIA was approximately 6 – 7 times more active (KH=110 nM; KL=4500 nM) than its stereoisomer, S-PIA (KH=750 nM; KL=26000 nM) showing the stereoselectivity of agonist binding.
Figure 4.
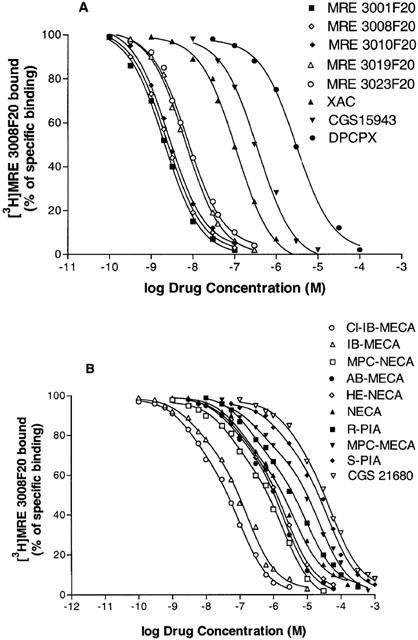
Competition curves of specific [3H]-MRE 3008F20 binding to human A3 adenosine receptors in Jurkat cells by adenosine antagonists (A) and agonists (B). Curves are representative of a single experiment from a series of four independent experiments. Competition experiments were performed as described in Methods.
Table 1.
Affinities, expressed as KH, KL and Ki, values, of selected adenosine receptor agonists and antagonists to A3 receptors in Jurkat cells
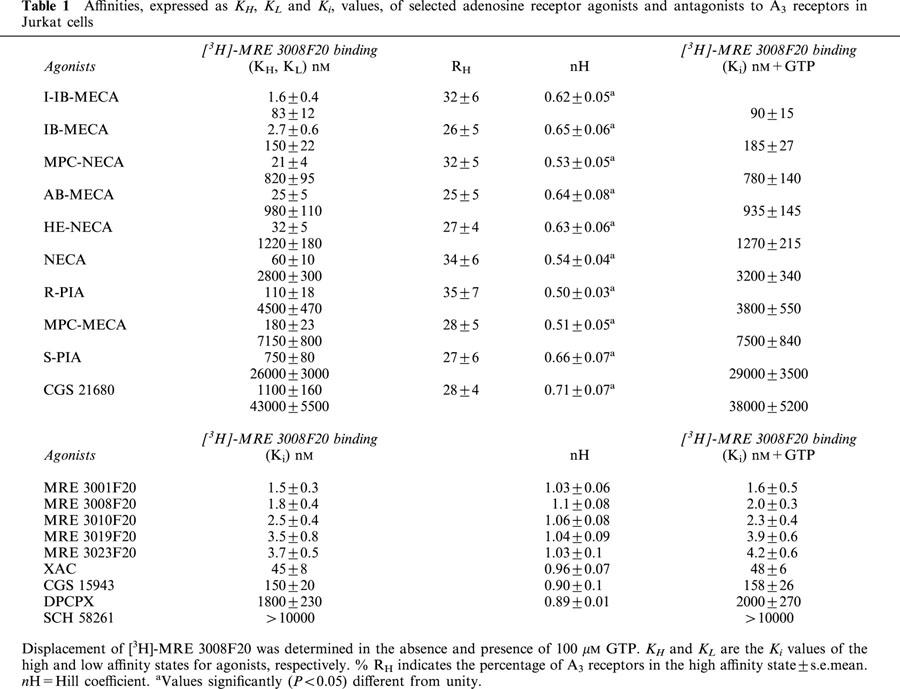
To test whether the high affinity state of the A3 receptor was linked to a guanine nucleotide regulatory protein, the effect of GTP on the affinity states was examined. The presence of 100 μM GTP shifted the competition curves with agonists from a biphasic to a monophasic shape (LIGAND, P<0.01), with a Ki value in the range of the low affinity sites, as shown in Table 1. In contrast, the above treatment did not change the shape of the competition curves with antagonists.
Thermodynamic studies
Thermodynamic studies revealed that KD values obtained from the saturation experiments of [3H]-MRE 3008F20 binding to A3 adenosine receptors, performed at the six temperatures selected, were in the range 1.9 – 5.6 nM. While the dissociation constant (KD) changed with temperature, Bmax values obtained from [3H]-MRE 3008F20 saturation experiments appeared to be largely independent of it. Figure 5 shows the van't Hoff plot of lnKA versus 1 T−1 for [3H]-MRE 3008F20 binding to the A3 adenosine receptor in Jurkat cells, and the final equilibrium thermodynamic parameters (expressed as mean values±standard error of three independent determinations) were: ΔG°=47.31±0.14 kJ mol−1; ΔH°=−27.97±3.18 kJ mol−1; ΔS°=64.89±6.35 J mol−1 K−1.
Figure 5.
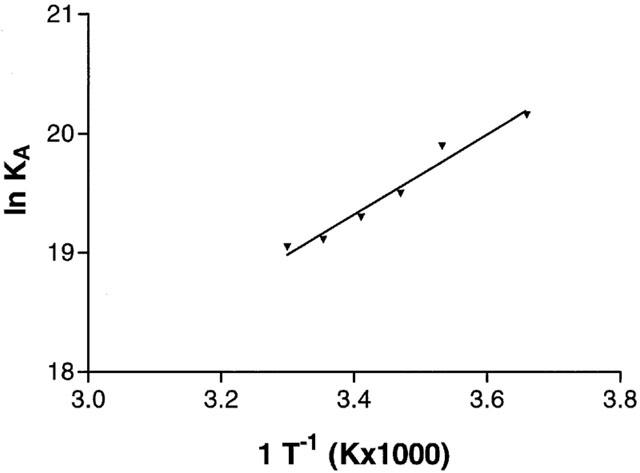
Van't Hoff plot showing the effect of temperature on the equilibrium binding association constant, KA=KD−1 of [3H]-MRE 3008F20. The plot is essentially linear in the temperature range investigated 0 – 30°C.
Saturation studies to A1 and A2A receptor subtypes
The level of expression of the other adenosine receptors in Jurkat cells was also determined in saturation binding experiments with [3H]-DPCPX and [3H]-SCH 58261 to label A1 and A2A receptors, respectively. A single saturable binding site was detected for both adenosine receptors. Saturation of [3H]-DPCPX (0.1 – 10 nM) shows a KD value of 0.9 nM±0.1 and Bmax of 42±3 fmol mg−1 of protein (Figure 6). [3H]-SCH 58261 exhibits high affinity for A2A receptors with a KD value of 2.5 nM±0.3 and Bmax of 1.4±0.2 pmol mg−1 of protein (Figure 7).
Figure 6.
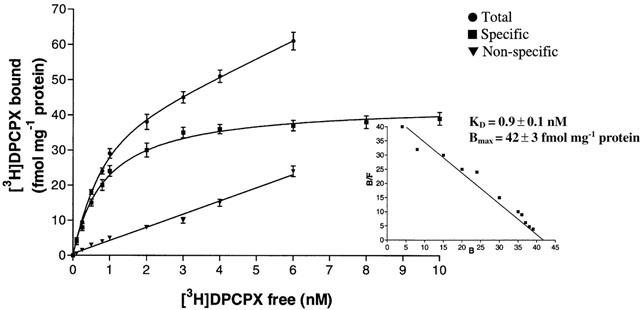
Saturation of [3H]-DPCPX binding to A1 adenosine receptors. Values are the means and vertical lines s.e.mean of four separate experiments performed in triplicate. In the inset the Scatchard plot of the same data is shown.
Figure 7.
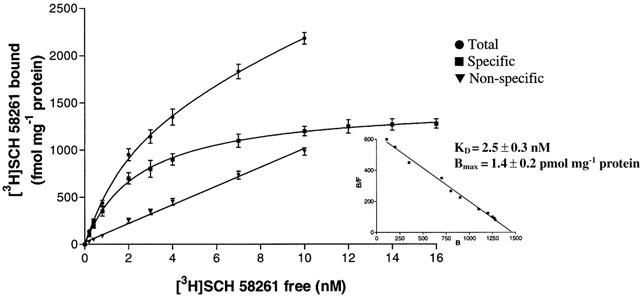
Saturation of [3H]-SCH 58261 binding to A2A adenosine receptors. Values are the means and vertical lines s.e.mean of four separate experiments performed in triplicate. In the inset the Scatchard plot of the same data is shown.
Cyclic AMP assays
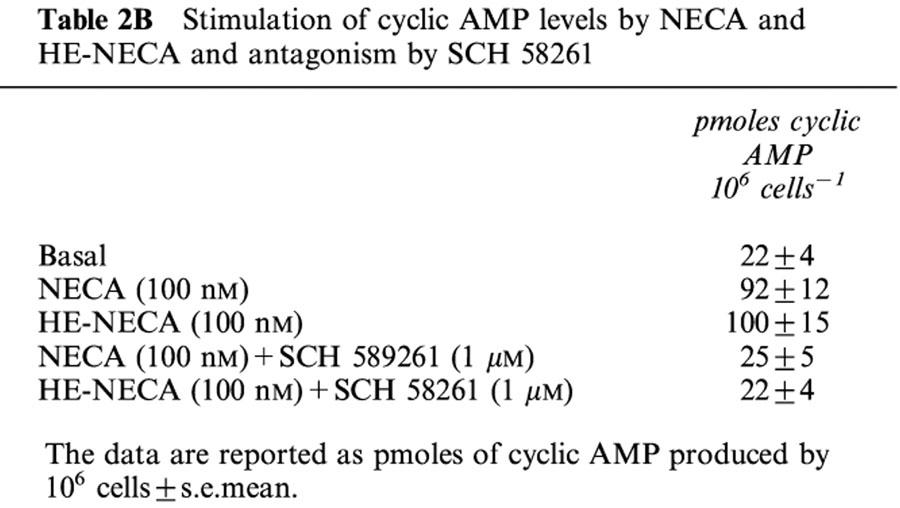
As a further validation of the new radioligand binding assay in Jurkat cells, we determined the potencies of the most selective A3 agonists in cyclic AMP determinations. Cl-IB-MECA and IB-MECA were able both to inhibit forskolin-stimulated cyclic AMP levels with IC50 values of 3.5±0.3 and 12±1 nM, respectively, according to the affinities determined in radioligand binding assays (Figure 8A). The effect of a single concentration (100 nM) of Cl-IB-MECA and IB-MECA, which inhibited forskolin-stimulated cyclic AMP levels by ≈#38;40%, was fully antagonized by MRE 3008F20 at a concentration of 1 μM (Table 2A). To evaluate the potency of MRE 3008F20 to antagonize cyclic AMP inhibition induced by Cl-IB-MECA a Schild analysis was performed. MRE 3008F20 shifted the concentration-response curve of Cl-IB-MECA to the right, in a concentration-dependent manner (Figure 9A). A Schild plot of the data gave a line with a slope near unity (0.98±0.06) and pKB value of 8.22±0.04 (Figure 9B). NECA and HE-NECA elicited a stimulation of cyclic AMP levels, with EC50 values of 550±60 and 50±4 nM (Figure 8B). The selective A2A antagonist SCH 58261 totally inhibited the rise in cyclic AMP levels induced by HE-NECA and NECA (100 nM) suggesting that the stimulatory effect was essentially A2A-mediated (Table 2B).
Figure 8.
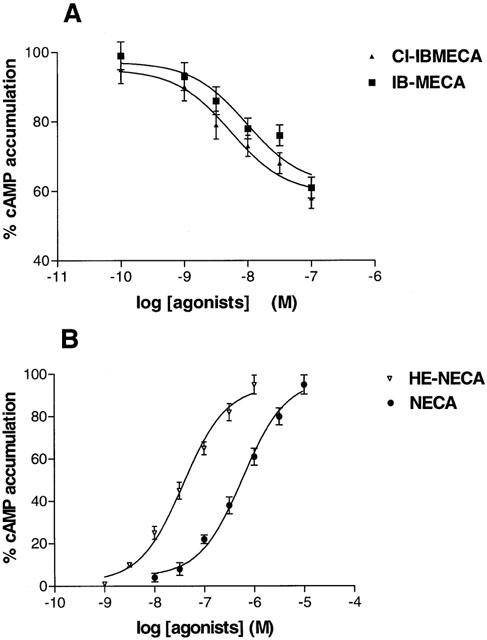
(A) Inhibition curves of forskolin (10 μM) stimulated-cyclic AMP levels by Cl-IB-MECA and IB-MECA. (B) Stimulation curves of cyclic AMP levels by HE-NECA and NECA in Jurkat cells. Data (mean of three experiments±s.e.mean) are given in percentages.
Table 2A.
Inhibition of forskolin-stimulated cyclic AMP levels by CI-IB-MECA and IB-MECA and antagonism by MRE 3008F20
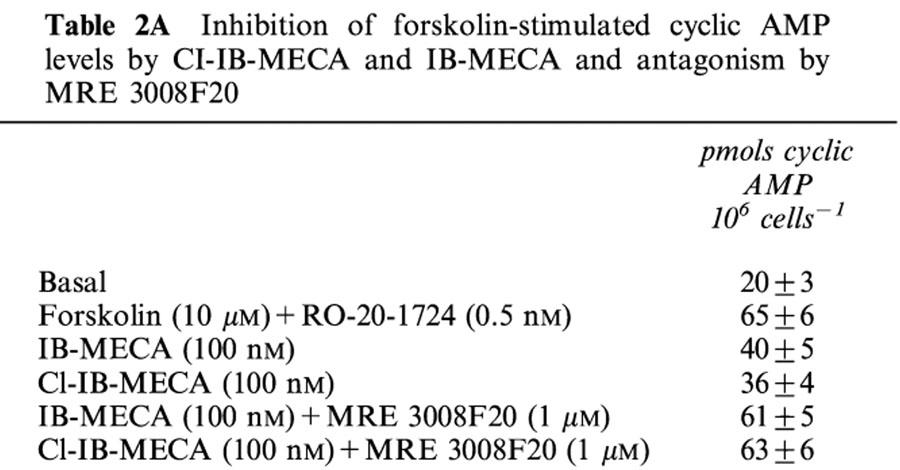
Figure 9.
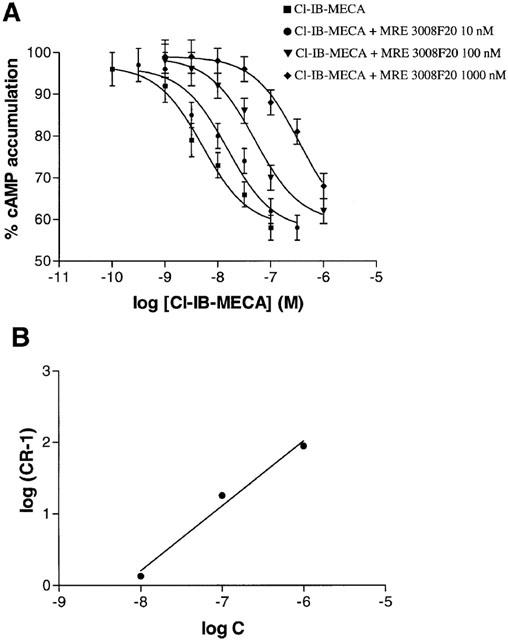
(A) Effect of the adenosine antagonist MRE 3008F20 on the Cl-IB-MECA-induced reduction of cyclic AMP levels in Jurkat cells. (B) Schild plot of the data. C, concentration of MRE3008F20 (in M); CR, ratio of the IC50 values of Cl-IB-MECA in the presence and absence of MRE 3008F20. Data are means of three experiments.
Table 2B.
Stimulation of cyclic AMP levels by NECA and HE-NECA and antagonism by SCH 58261
Calcium mobilization studies
Since A3 adenosine receptors are commonly associated with a stimulation of [Ca2+]i increase, we investigated the possible functional linkage of A3 receptors with this pathway in Jurkat leukemia line. The most selective A3 receptor agonists Cl-IB-MECA and IB-MECA increase, in the micromolar range, the concentrations of intracellular free Ca2+. Both drugs produced a rapid rise that slowly declined to baseline. Chelation of extracellular Ca2+ with EGTA (0.5 mM) largely reduced, but did not fully obliterate, the rise in [Ca2+]i thus suggesting that A3 agonists were also able to release Ca2+ from intracellular stores (Figure 10A, B). Pretreatment of cells with MRE 3008F20 (1 μM) potently reduced the rise in intracellular calcium induced by Cl-IB-MECA 10 μM (Figure 10C).
Figure 10.
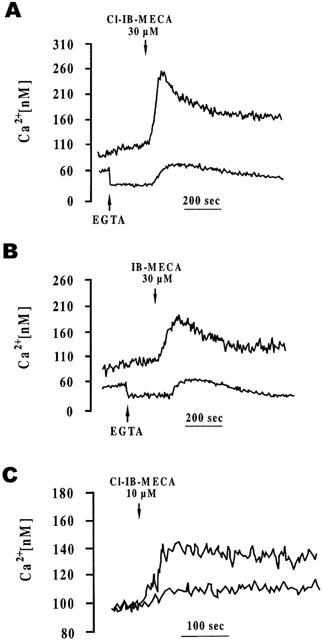
Effect of Cl-IB-MECA (30 μM) (A) and IB-MECA (30 μM) (B), in the absence or presence of 0.5 mM EGTA, on intracellular Ca2+ levels in Jurkat cells. (C) Stimulation of intracellular Ca2+ levels by Cl-IB-MECA (10 μM) (upper trace) and antagonism by MRE 3008F20 1 μM (lower trace). Cells were pretreated with MRE 3008F20 for 10 min. The results are typical of triplicate experiments.
Discussion
Earlier pharmacological evidence revealed the existence of A2B and A2A adenosine receptors in Jurkat cells, while it did not show the expression of the A3 subtype (van der Ploeg et al., 1996; Mirabet et al., 1997). In the past, the lack of high affinity and selective A3 radioligands prevented the study of this receptor. The newly developed A3 adenosine receptor antagonist, [3H]-MRE 3008F20, which has been recently shown to label recombinant hA3 receptors and to display negligible affinity for the other adenosine receptors (Ki (nM) 1100, 140, 2100 at A1, A2A and A2B receptors, respectively Varani et al., 2000), represents a key advance towards the characterization of A3 receptors on cells or tissues that possess multiple subtypes of adenosine receptors. In the present work we studied the ligand binding and the signalling properties of the A3 adenosine receptor in Jurkat cells by using [3H]-MRE 3008F20. Different experimental approaches attest to the existence of adenosine A3 receptors on this human leukemic cell line. In hybridization experiments following RT-PCR amplification, mRNA encoding the A3 receptor was detected (Figure 1A). Association and dissociation kinetic parameters of [3H]-MRE 3008F20 binding revealed a KD value (1.7 nM) of the same order of magnitude as that determined by saturation experiments (1.9±0.2 nM) (Figures 2 and 3). The results of competition binding studies showed that a series of adenosine receptor agonists and antagonists bound to human A3 adenosine receptors in Jurkat cells with a rank order of potency and affinity range typical of the A3 subtypes (Varani et al., 2000). All agonist competition curves exhibited Hill coefficients less than unity and were best described by the existence of one high (KH) and one low (KL) affinity agonist receptor binding state (Table 1, Figure 4B). Approximately 30% of the A3 receptor existed in the high-affinity state under the present assay conditions. The percentage of high-affinity sites was similar regardless of the adenosine agonists used, indicating that the recognition of both high and low-affinity states of the [3H]-MRE 3008F20 binding sites is not an artifact particular to a specific agonist. The addition of GTP, and subsequent uncoupling of receptors from G-proteins, converted the agonist displacement curves from biphasic to monophasic. The similarity between Ki values determined in the presence of GTP and KL values obtained in the absence of GTP indicated a guanine nucleotide-mediated shift of the high affinity binding sites to a low affinity form, a finding in agreement with that reported for hA3 receptors transfected in CHO cells (Table 1) (Varani et al., 2000). On the contrary, competition binding curves with antagonists, that include a series of new substituted pyrazolo triazolo pyrimidines (Baraldi et al., 1999), were monophasic and did not change upon addition of GTP. Thermodynamic parameters obtained from the van't Hoff plot indicate that [3H]-MRE 3008F20 binding to A3 adenosine receptors is enthalpy- and entropy-driven, with a major contribution of the enthalpic component (ΔH°=−27.97±3.18 kJmol−1, ΔS°=64.89±6.35 J mol−1 K−1), in agreement with data obtained in CHO cells expressing hA3 receptors (Varani et al., 2000).
As revealed in RT-PCR experiments, all adenosine subclasses are present in Jurkat cells (Figure 1C). Binding studies performed by using as radioligands [3H]-CGS 21680 and [3H]-NECA, (Mirabet et al., 1997; van der ploegh et al., 1996) demonstrated that the relative proportion of A2A was lower than that of A2B. However CGS 21680 and NECA are not high affinity ligands to label A2A and A2B receptors respectively, and their use may generate some confusion in pharmacological studies performed in systems containing multiple adenosine subtypes. In order to establish the amount of A2A receptors present on Jurkat cells, the selective antagonist [3H]-SCH 58261 was used as the ligand (Bmax of 1.4 pmol mg−1 protein and KD of 2.5 nM). Moreover under our experimental conditions we could detect A1 receptors, at variance with previous results (Mirabet et al., 1997). The expression of A1 receptors was first revealed by RT-PCR experiments and then confirmed by [3H]-DPCPX binding (KD value of 0.9 nM and a Bmax of 42 fmol mg−1 protein) even though, in the range of [3H]-DPCPX binding investigated (1 – 10 nM), a percentage of A2B receptors could be occupied. The lack of selective ligands for A2B receptors impeded the direct labelling of these subtypes in systems, as Jurkat cells, containing other adenosine receptors.
To further characterize A3 adenosine receptors expressed in Jurkat cells, we investigated the ability of these receptors to modulate adenylyl cyclase activity. Forskolin-stimulated cyclic AMP levels were inhibited by Cl-IB-MECA and IB-MECA, the most potent and selective A3 agonists actually available, and MRE 3008F20 was able to antagonize this effect (Figure 9). As for NECA, HE-NECA, R-PIA, these compounds even if able to compete for [3H]-MRE 3008F20 binding did not inhibit cyclic AMP levels. Most probably their effect on the stimulation of cyclic AMP levels prevailed over the A3-mediated inhibitory action and their stimulatory effect was totally antagonized by SCH 58261 (1 μM) suggesting the involvement of A2A receptors (Table 2B).
Expression of more than one subtype of adenosine receptors on the same cell may allow the non selective endogenous agonist, adenosine, to activate multiple signalling pathways. Adenylyl cyclase is a common effector, negatively coupled to A1 and A3 receptors and positively coupled to A2A and A2B receptors, affording the opportunity for reciprocal control and, therefore, fine tuning of this signalling pathway (Ralevic & Burnstock, 1998). mRNA encoding A2A, A2B and A3 receptors, have been found in rat RBL-2H3 mast cells (Ramkumar et al., 1993) and coexpression of A2A and A2B has been demonstrated even in PC12 cells (van der Ploeg et al., 1996), human mast HMC-1 cells (Feoktistov & Biaggioni, 1995) and human neutrophil leukocytes (Fredholm et al., 1996). It is possible, therefore, that more examples of cells coexpressing adenosine receptors may become apparent after that selective adenosine ligands are applied in the pharmacological studies. The functional meaning of this simultaneous expression of multiple adenosine receptor subtypes in a single target cell is not known. Because the different adenosine receptors have quite different affinities for the endogenous agonist, the local concentration of adenosine in physiopathological conditions may determine the pattern of differential activation of coexpressed adenosine receptors. It is possible that the relative importance of A3 receptors is greater in situations in which high interstitial levels of adenosine are reached, e.g. when metabolic demands are increased or oxygen supply is decreased, whereas the high affinity A1 and A2A receptors may modulate cellular functions in response to lower concentrations of this autacoid. Activation of A3 receptors triggered an increase in [Ca2+]i that was dependent on both influx across the plasma membrane and release from intracellular stores (Figure 10A, B). The agonist-induced effects on Ca2+ mobilization in Jurkat cells were similar in intensity and pharmacology to those observed in HL-60 cells and human eosinophils, for which a functional A3 receptor has been proposed (Khono et al., 1996a,1996b; Shneyvays et al., 2000). Moreover, the strikingly large potency differential between adenylyl cyclase inhibition and intracellular Ca2+ elevation by the same agonists that is observed in Jurkat cells and in other models, could be explained on the basis of a differential activation of different second messengers by the same receptor at low and high doses (Jacobson, 1998). In conclusion, all the data reported indicate that Jurkat cells express A3 adenosine receptors with a pharmacological, biochemical and thermodynamic profile typical of the human A3 subtype found in other cell types. The presence of A3 receptors associated with the inhibition of adenylyl cyclase activity and calcium modulation in Jurkat line is strongly supportive of an important role of adenosine in leukemic T cells.
Acknowledgments
The authors are grateful to Prof Bertil Fredholm, Department of Physiology and Pharmacology, Section of Molecular Neuropharmacology, Karolinska Institutet, Stockolm, Sweden for providing adenosine receptors primers sequences and to Prof Francesco di Virgilio, Department of Experimental and Diagnostic Medicine, Biotechnology Center, University of Ferrara, Italy for helpful discussion during the study.
Abbreviations
- AB-MECA
4-amino-benzyl-5′-N-methyl carboxamidoadenosine
- cAMP
cyclic AMP
- CGS 21680
2-[p-(2-carboxyethyl)-phenetylamino]-5′-N-ethyl-carboxamidoadenosine
- CGS 15943
5-amino-9-chloro-2-(furyl)1,2,4-triazolo[1,5-c] quinazoline
- Cl-IB-MECA
N6-(3-iodo-benzyl)-2-chloro-adenosine-5′-N-methyluronamide
- DPCPX
1,3-dipropyl-8-cyclopentyl-xanthine
- hA3
human adenosine A3 receptor
- HE-NECA
2-hexynyl-5′-N-ethyl-carboxamidoadenosine
- IB-MECA
N6-(3-iodo-benzyl) adenosine-5′-N-methyluronamide
- MPC-MECA
N6-(4-methoxy phenylcarbamoyl)-adenosine-5′-N-methyluronamide
- MPC-NECA
N6-(4-methoxy phenylcarbamoyl)-adenosine-5′-N-ethyluronamide
- MRE 3010F20
5-N-(3-chlorophenyl-carbamoyl)amino-8-propyl-2-(2-furyl)-pyrazolo[4,3-e]-1,2,4-triazolo[1,5-c] pyrimidine
- MRE 3008F20
5-N-(4-methoxyphenyl-carbamoyl)amino-8-propyl-2(2furyl)-pyrazolo-[4,3e]-1,2,4-triazolo [1,5-c] pyrimidine
- MRE 3001F20
5-[[(4-Methoxyphenyl)amino]carbonyl]amino-8-ethyl-2-(2-furyl)-pyrazolo[4,3-e] 1,2,4-triazolo[1,5-c]pyrimidine
- MRE 3019F20
5-[[(3-Chlorophenyl)amino]carbonyl]amino-8-methyl-2-(2-furyl)-pyrazolo[4,3-e]1,2,4 triazolo[1,5-c]pyrimidine
- MRE3023F20
5-[[(4-Methoxyphenyl)amino]carbonyl]amino-8-n-butyl-2-(2-furyl)-pyrazolo[4,3-e]1,2,4-triazolo1,5-c]pyrimidine
- NECA
5′-N-ethyl-carboxamidoadenosine
- R-PIA
R(−)-N6(2-phenyl-isopropyl)-adenosine
- SCH 58261
7-(2-phenylethyl)-2-(2-furyl)-pyrazolo[4,3-e]-1,2,4-triazolo[1,5-c]-pyrimidine
- S-PIA
S(−)-N6(2-phenylisopropyl)adenosine
- XAC
8-[4-[[[[(2-amino ethyl)amino]-carbonyl]methyl]-oxy]-phenyl]-1,3-dipropylxanthine
- ZM
241385 (4-(2-[7-amino-2-(2-furyl)-[1,2,4]triazolo-[2,32][1,3,6]triazinyl-amino]ethyl)-phenol)
References
- ABBRACCHIO M.P., BRAMBILLA R., CERUTI S., KIM H.O., VON LUBITZ D.K.J.E., JACOBSON K.A., CATTABENI F. G Protein-dependent activation of phospholipase C by adenosine A3 receptors in rat brain. Mol. Pharmacol. 1995;48:1038–1045. [PubMed] [Google Scholar]
- ABBRACCHIO M.P., CERUTI S., BRAMBILLA R., BARBIERI D., CAMURRI A., FRANCESCHI C., GIAMMARIOLI A.M., JACOBSON K.A., CATTABENI F., MALORNI W. Adenosine A3 receptors and viability of astrocytes. Drug. Dev. Res. 1998;45:379–386. doi: 10.1002/(sici)1098-2299(199811/12)45:3/4<379::aid-ddr38>3.0.co;2-y. [DOI] [PMC free article] [PubMed] [Google Scholar]
- BARALDI P.G., BOREA P.A. New potent and selective human adenosine A3 receptor antagonists. Trends Pharmacol. Sci. 2000;21:456–459. doi: 10.1016/s0165-6147(00)01581-9. [DOI] [PubMed] [Google Scholar]
- BARALDI P.G., CACCIARI B., ROMAGNOLI R., SPALLUTO G., KLOTZ K.-N., LEUNG E., VARANI K., GESSI S., MERIGHI S., BOREA P.A. Pyrazolo[4,3-e]1,2,4-triazolo[1,5-c]-pyrimidine derivatives as highly potent and selective human A3 adenosine receptor antagonists. A possible template for adenosine receptor subtypes. J. Med. Chem. 1999;42:4473–4478. doi: 10.1021/jm991114s. [DOI] [PubMed] [Google Scholar]
- BOREA P.A., DALPIAZ A., VARANI K., GUERRA L., GILLI G. Binding thermodynamics of adenosine A2A receptor ligands. Biochem. Pharmacol. 1995;49:461–469. doi: 10.1016/0006-2952(94)00464-w. [DOI] [PubMed] [Google Scholar]
- BRADFORD M.M. A rapid and sensitive method for the quantification of microgram quantities of protein utilizing the principle of protein dye-binding. Anal. Biochem. 1976;72:248–254. doi: 10.1016/0003-2697(76)90527-3. [DOI] [PubMed] [Google Scholar]
- BRAMBILLA R., CATTABENI F., CERUTI S., BARBIERI D., FRANCESCHI C., KIM Y., JACOBSON K.A., KLOTZ K.N., LOHSE, ABBRACCHIO M.P. Activation of the A3 adenosine receptor affects cell cycle progression and cell growth. Naunyn-Schmiedeberg's Arch. Pharmacol. 2000;361:225–234. doi: 10.1007/s002109900186. [DOI] [PMC free article] [PubMed] [Google Scholar]
- CHOMCZYNSKI P., SACCHI N. Single-step method of RNA isolation by acid guanidinium thiocyanate-phenol-chloroform extraction. Anal. Biochem. 1987;162:156–159. doi: 10.1006/abio.1987.9999. [DOI] [PubMed] [Google Scholar]
- EZEAMUZIE C.I., PHILIPS E. Adenosine A3 receptors on human eosinophils mediate inhibition of degranulation and superoxide anion release. Br. J. Pharmacol. 1999;127:188–194. doi: 10.1038/sj.bjp.0702476. [DOI] [PMC free article] [PubMed] [Google Scholar]
- FELDMAN H.A. Mathematical theory of complex ligand-binding systems at equilibrium. Anal. Biochem. 1972;48:317–338. doi: 10.1016/0003-2697(72)90084-x. [DOI] [PubMed] [Google Scholar]
- FEOKTISTOV I., BIAGGIONI I. Adenosine A2B receptors evoke interleukin-8 secretion in human mast cells: an enprofylline-sensitive mechanism with implications for asthma. J. Clin. Invest. 1995;96:1979–1986. doi: 10.1172/JCI118245. [DOI] [PMC free article] [PubMed] [Google Scholar]
- FORSYTHE P., ENNIS M. Adenosine, mast cells and asthma. Inflamm. Res. 1999;48:301–307. doi: 10.1007/s000110050464. [DOI] [PubMed] [Google Scholar]
- FOZARD J.R., PFANNKUCHE H.J., SCHUURMAN H.J. Mast cell degranulation following adenosine A3 receptor activation in rats. Eur. J. Pharmacol. 1996;298:293–297. doi: 10.1016/0014-2999(95)00822-5. [DOI] [PubMed] [Google Scholar]
- FREDHOLM B.B., ARSLAN G., HALLDNER L., KULL B., SCHULTE G., WASSERMAN W. Structure and function of adenosine receptors and their genes. Naunyn-Schmiedeberg's Arch. Pharmacol. 2000;362:364–374. doi: 10.1007/s002100000313. [DOI] [PubMed] [Google Scholar]
- FREDHOLM B.B., ZHANG Y., VAN DER PLOEG I. Adenosine A2A receptors mediate the inhibitory effect of adenosine on formyl-Met-Leu-Phe-stimulated respiratory burst in neutrophil leukocytes. Naunyn-Schmiedeberg's Arch. Pharmacol. 1996;354:262–267. doi: 10.1007/BF00171056. [DOI] [PubMed] [Google Scholar]
- HANNON J.P., PFANNKUCHE H.J., FOZARD J.R. A role for mast-cells in adenosine A3 receptor-mediated hypotension in the rat. Br. J. Pharmacol. 1995;115:945–952. doi: 10.1111/j.1476-5381.1995.tb15902.x. [DOI] [PMC free article] [PubMed] [Google Scholar]
- JACOBSON K.A., KIM H.O., SIDDIQI S.M., OLAH M.E., STILES G.L., VON LUBITZ D.K.J.E. A3 adenosine receptors: design of selective ligands and therapeutic prospects. Drugs future. 1995;20:689–699. doi: 10.1358/dof.1995.020.07.531583. [DOI] [PMC free article] [PubMed] [Google Scholar]
- JACOBSON K.A., MORO S., KIM Y.C., LI A.H. A3 adenosine receptors: protective vs. damaging effects identified using novel agonists and antagonists. Drug. Dev. Res. 1998;45:113–124. doi: 10.1002/(SICI)1098-2299(199811/12)45:3/4<113::AID-DDR5>3.0.CO;2-S. [DOI] [PMC free article] [PubMed] [Google Scholar]
- JACOBSON K.A. Adenosine A3 receptors: novel ligands and paradoxical effects. Trends Pharmacol. Sci. 1998;19:184–191. doi: 10.1016/s0165-6147(98)01203-6. [DOI] [PMC free article] [PubMed] [Google Scholar]
- KOHNO Y., SEI Y., KOSHIBA M., KIM H.O., JACOBSON K.A. Induction of apoptosis in HL-60 human promyelocytic leukemia cells by adenosine A3 receptor agonists. Biochem. Biophys. Res. Commun. 1996a;219:904–910. doi: 10.1006/bbrc.1996.0331. [DOI] [PMC free article] [PubMed] [Google Scholar]
- KOHNO Y., JI X., MAWHORTER S.D., KOSHIBA M., JACOBSON K.A. Activation of A3 adenosine receptors on human eosinophils elevates intracellular calcium. Blood. 1996b;88:3569–3574. [PMC free article] [PubMed] [Google Scholar]
- LIANG B.T., JACOBSON K.A. A physiological role of the adenosine A3 receptor: sustained cardioprotection. Proc. Natl. Acad. Sci. U.S.A. 1998;95:6995–6999. doi: 10.1073/pnas.95.12.6995. [DOI] [PMC free article] [PubMed] [Google Scholar]
- LINDEN J., THAI T., FIGLER H., JIN X., ROBEVA A.S. Characterization of human A2B adenosine receptors: radioligand binding, western blotting, and coupling to Gq in human embryonic kidney 293 cells and HMC-1 mast cells. Mol. Pharmacol. 1999;56:705–713. [PubMed] [Google Scholar]
- MIRABET M., MALLOL J., LLUIS C., FRANCO R. Calcium mobilization in Jurkat cells via A2B adenosine receptors. Br. J. Pharmacol. 1997;122:1075–1082. doi: 10.1038/sj.bjp.0701495. [DOI] [PMC free article] [PubMed] [Google Scholar]
- MUNSON P.J., RODBARD D. Ligand: a versatile computerized approach for the characterization of ligand binding systems. Anal. Biochem. 1980;107:220–239. doi: 10.1016/0003-2697(80)90515-1. [DOI] [PubMed] [Google Scholar]
- MUTINI C., FALZONI S., FERRARI D., CHIOZZI P., MORELLI A., BARICORDI O.R., COLLO G., RICCIARDI-CASTAGNOLI P., DI VIRGILIO F. Mouse dendritic cell express the P2X7 purinergic receptor: characterization and possible participation in antigen presentation. J. Immunol. 1999;163:1958–1965. [PubMed] [Google Scholar]
- OLAH M.E., STILES G.L. Adenosine receptor subtypes: characterization and therapeutic regulation. Annu. Rev. Pharmacol. Toxicol. 1995;35:581–606. doi: 10.1146/annurev.pa.35.040195.003053. [DOI] [PubMed] [Google Scholar]
- RALEVIC V., BURNSTOCK G. Receptors for purines and pyrimidines. Pharmacol. Rev. 1998;50:413–492. [PubMed] [Google Scholar]
- RAMKUMAR V., STILES G.L., BEAVEN M.A., ALI H. The A3 adenosine receptor is the unique adenosine receptor which facilitates release of allergic mediators in mast cells. J. Biol. Chem. 1993;268:16887–16890. [PubMed] [Google Scholar]
- SCHILD H.O. Drug antagonism and pAx. Pharmacol. Rev. 1957;9:242–245. [PubMed] [Google Scholar]
- SHNEYVAYS V., JACOBSON K.A., LI A.H., NAWRATH H., ZINMAN T., ISAAC A., SHAINBERG A. Induction of apoptosis in rat cardiocytes by A3 adenosine receptor activation and its suppression by isoproterenol. Exp. Cell. Res. 2000;257:111–126. doi: 10.1006/excr.2000.4882. [DOI] [PMC free article] [PubMed] [Google Scholar]
- VAN DER PLOEGH I., AHLBERG S., PARKINSON F.E., OLSSON R.A., FREDHOLM B.B. Functional characterization of adenosine A2 receptors in Jurkat cells and PC12 cells using adenosine receptor agonists. Naunyn-Schmiedeberg's Arch. Pharmacol. 1996;353:250–260. doi: 10.1007/BF00168626. [DOI] [PubMed] [Google Scholar]
- VARANI K., GESSI S., DIONISOTTI S., ONGINI E., BOREA P.A. [3H]-SCH 58261 labelling of functional A2A adenosine receptors in human neutrophil membranes. Br. J. Pharmacol. 1998;123:1723–1731. doi: 10.1038/sj.bjp.0701758. [DOI] [PMC free article] [PubMed] [Google Scholar]
- VARANI K., MERIGHI S., GESSI S., KLOTZ K.N., LEUNG E., BARALDI P.G., CACCIARI B., ROMAGNOLI R., SPALLUTO G., BOREA P.A. [3H]MRE 3008F20: a novel antagonist radioligand for the pharmacological and biochemical characterization of human A3 adenosine receptors. Mol. Pharmacol. 2000;57:968–975. [PubMed] [Google Scholar]
- VON LUBITZ D.K.J.E., LIN R.C.S., BOYD M., BISCHOFBERGER N., JACOBSON K.A. Chronic administration of adenosine A3 receptor agonist and cerebral ischemia: neuronal and glial effects. Eur. J. Pharmacol. 1999;367:157–163. doi: 10.1016/s0014-2999(98)00977-7. [DOI] [PMC free article] [PubMed] [Google Scholar]
- ZHOU Q.Y., LI C., OLAH M.E., JOHNSON R.A., STILES G.L., CLIVELLI O. Molecular cloning and characterization of an adenosine receptor: the A3 adenosine receptor. Proc. Natl. Acad. Sci. U.S.A. 1992;89:7432–7436. doi: 10.1073/pnas.89.16.7432. [DOI] [PMC free article] [PubMed] [Google Scholar]