Abstract
Electrophysiological methods were used to investigate the interaction of inhibitors with the human Na+/glucose (hSGLT1) and Na+/Cl−/GABA (hGAT1) cotransporters. Inhibitor constants were estimated from both inhibition of substrate-dependent current and inhibitor-induced changes in cotransporter conformation.
The competitive, non-transported inhibitors are substrate derivatives with inhibition constants from 200 nM (phlorizin) to 17 mM (esculin) for hSGLT1, and 300 nM (SKF89976A) to 10 mM (baclofen) for hGAT1. At least for hSGLT1, values determined using either method were proportional over 5-orders of magnitude.
Correlation of inhibition to structure of the inhibitors resulted in a pharmacophore for glycoside binding to hSGLT1: the aglycone is coplanar with the pyranose ring, and binds to a hydrophobic/aromatic surface of at least 7×12Å. Important hydrogen bond interactions occur at five positions bordering this surface.
In both hSGLT1 and hGAT1 the data suggests that there is a large, hydrophobic inhibitor binding site ∼8Å from the substrate binding site. This suggests an architectural similarity between hSGLT1 and hGAT1. There is also structural similarity between non-competitive and competitive inhibitors, e.g., phloretin is the aglycone of phlorizin (hSGLT1) and nortriptyline resembles SKF89976A without nipecotic acid (hGAT1).
Our studies establish that measurement of the effect of inhibitors on presteady state currents is a valid non-radioactive method for the determination of inhibitor binding constants. Furthermore, analysis of the presteady state currents provide novel insights into partial reactions of the transport cycle and mode of action of the inhibitors.
Keywords: Sodium substrate cotransport, GABA, sodium, glucose, pharmacophore, inhibitor binding, electrophysiology
Introduction
Recently, efforts have been directed toward using transporters both as portals for delivery of drugs and prodrugs and as specific targets of therapeutic agents. These efforts have resulted in compounds in current therapeutic use which are delivered via transporters (e.g., valaciclovir, Beauchamp et al., 1992) or achieve their therapeutic goal by inhibition of a specific transporter (e.g., tiagabine, Braestrup et al., 1990). Design of drugs to use the inherent selective properties and tissue distribution of transporters would be greatly facilitated with knowledge of the transport mechanism, and specifically, how and why do drugs bind and what is involved in translocation across the plasma membrane?
Ion-driven cotransporters use the transmembrane electrochemical gradient to energize transport of a cosubstrate against its own chemical gradient. These integral membrane proteins provide essential functions for a diverse variety of cell types, from neurons to enterocytes, and transport substrates including ions, neurotransmitters and nutrients. They belong to several gene families, and although they may not share homology at the amino acid sequence level, studies show that they do share common mechanisms (e.g., Parent et al., 1992b; Mager et al., 1993; Forster et al., 1997; Pajor et al., 1998; Loo et al., 2000).
The Na-dependent glucose cotransporter (SGLT1) is, arguably, the best characterized member of the extended eucaryotic ion-dependent cotransporter family. Its substrate selectivity has been studied since the 1960s (e.g., Landau et al., 1962; Alvarado & Crane, 1964). It was the first cotransporter to be identified and cloned (Hediger et al., 1987), and, by using a variety of biochemical, molecular biological and biophysical techniques it has been determined that the C-terminal 5-helices of this monomeric (Eskandari et al., 1998) 14-transmembrane helix (Turk & Wright, 1997) cotransporter contains the sugar selectivity elements and translocation pathway (Panayotova-Heiermann et al., 1997). Its transport is tightly coupled (2 Na+: 1 sugar, Mackenzie et al., 1998), so a Na+ current proportional to the sugar flux is generated when sugar is being translocated. The protein itself behaves as if it contains a negative charge (Parent et al., 1992a; Loo et al., 1993; Hazama et al., 1997), so conformational changes in the protein during partial reactions of the transport cycle (Loo et al., 1998) generate transient electrical currents. Elucidation of the functional characteristics has led to development of kinetic models of the cotransport process, most notably for SGLT1 (e.g., Parent et al., 1992b; Falk et al., 1998) and the neuronal Na+/Cl−/GABA cotransporter GAT1 (e.g., Su et al., 1996; Hilgemann & Lu, 1999). At the present level of knowledge, a simple 6-state model (Parent et al., 1992b) adequately describes the basic functional characteristics of SGLT1. A similar model has been proposed for GAT1 (Hilgemann & Lu, 1999).
In this study we have investigated the effects of a variety of glucose and galactose conjugates on function of the human isoform of the Na/glucose cotransporter, hSGLT1. We used electrophysiological methods to measure inhibition of transport and changes in protein conformation induced by inhibitors, and interpreted the spatial interactions to propose a framework for a pharmacophore for inhibitor binding. The similarity in the effects of a series of GABA analogues on hGAT1 suggests that both transporters share a similar mechanism of inhibition.
Methods
Expression of hSGLT1 and hGAT1 in oocytes: Oocytes obtained from adult Xenopus laevis were injected with 50 ng of cRNA coding for the human Na+/glucose cotransporter (hSGLT1, Hediger et al., 1989) or the human Na+/Cl−/GABA cotransporter (hGAT1, Loo et al., 2000) and were maintained in Barth's medium supplemented with gentamycin (5 mg ml−1), penicillin (100 units ml-1)/streptomycin (100 μg ml−1), at 18°C for 5 – 14 days. All animal maintenance and handling procedures followed guidelines approved by the University of California Chancellor's Committee on Animal Research and the National Institutes of Health. The animals were anaesthetized with 0.1% tricane buffered with 0.1% NaHCO3 and then cooled in an ice bath before surgically extracting a portion of an ovary.
Transport and binding: Na+ and substrate-induced currents were measured using a two electrode voltage-clamp (Birnir et al., 1991) at 22°C in a rapid perfusion chamber (Lostao et al., 1994). We have shown in both hSGLT1 and hGAT1, using simultaneous measurements of substrate-dependent current and radioactive substrate uptake, that the substrate-induced current is the result of 2 Na+ cotransported with substrate (Mackenzie et al., 1998; Loo et al., 2000). A pulse protocol was used in which the membrane potential was normally held at a holding potential (Vh) of −50 mV and stepped for 100 ms from +50 mV to −150 mV in 20 mV decrements (‘on') before returning to Vh (‘off'), unless otherwise noted. (The slow kinetics of hGAT1 required voltage pulses of 800 ms.) The experiments were controlled and data acquired using pClamp and Axoscope software (Axon Instruments, Foster City, CA, U.S.A.) and continuous current data were recorded using a chart recorder.
The substrate-dependent current was first measured by subtracting the background current in Na+ from the total current in the presence of 0.4 mM αMDG, or 10 μM GABA, the apparent transport affinities (K0.5) for these substrates in hSGLT1 (Hirayama et al., 1996) and hGAT1 (Loo et al., 2000). We did not compensate for the small uncoupled current through hSGLT1 as this is predicted to decrease in proportion to inhibition of the sugar-dependent current.
For hSGLT1, the inhibitor was then added in the presence of αMDG, and the amount of the substrate-dependent current inhibited by different concentrations of the test glycoside was determined. After each trial the oocyte was thoroughly washed in Na+-free buffer to remove all traces of the test compounds before reequilibration in Na+-buffer and the next trial. Each application of inhibitor was immediately preceded by an application of the substrate; inhibitors were applied from lowest to highest concentration, or conversely.
The inhibition constant for transport, Ki, was derived from an expression for the fractional inhibition in the presence and absence of an inhibitor (equation III-5 from Segal, 1975):
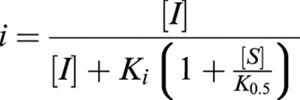 |
where K0.5 is the concentration of substrate that induces one half of the maximal current in the absence of inhibitor, [S] and [I] are substrate and inhibitor concentration, and  is the fractional inhibition of transport in [S] with inhibitor, v, to that without inhibitor, v0. This reduces to:
under the conditions of our experiments, in which [S]=K0.5 and i=0.5. I0.5 was determined by fitting the inhibition of transport as a function of [I] to:
 |
In the case of hGAT1 the protocol was slightly modified due to the slow binding and recovery of transport after exposure to SKF89976A and nortriptyline. For these compounds kinetic parameters were determined by applying increasing concentrations of inhibitor to a constant 10 μM concentration of GABA. After addition of each concentration of inhibitor the current slowly decreased to a steady value, which was monitored on a chart recorder, at which time the measurement was taken (a similar protocol was used for phloretin in hSGLT1). This time interval was 3 – 5 min for SKF89976A and up to 25 min for nortriptyline. Baclofen and saclofen were treated as for the SGLT1 inhibitors as they did not have these slow kinetics.
Analysis of presteady state currents: In most cases the ‘off' transient was analysed. The presteady state transient currents are generally attributed to voltage-dependent changes in the conformation of the transporter (Parent et al., 1992b; Loo et al., 1993; Hazama et al., 1997; Hilgemann & Lu, 1999). We attribute the bulk of the charge movement to a reorientation of transporter charged or dipolar residues in the membrane electric field. This capacitive current was separated from the membrane capacitance and the steady state conductances as previously described (fitted method, Loo et al., 1993). As the time constant for this pure capacitive current was on the order of 0.5 – 1 ms, it is easily separable from the transporter transients, which have a time constant of 2 – 100 ms (Loo et al., 1993; 2000). The equivalent charge was calculated by integration of this transient current with time, and the distribution of the charge moved as a function of voltage was calculated by fitting the data to the Boltzmann relationship:
where Qmax=Qdep−Qhyp, and Qdep and Qhyp are the charge moved at depolarizing and hyperpolarizing limits, z, the apparent valence, is 1 (Loo et al., 1993; 2000), Vt is the test potential, V0.5 is the voltage at which the charge was equally distributed between depolarizing and hyperpolarizing limits, and F, R and T have their usual meanings. Time constants of the transporter transients were estimated as in Loo et al. (1993).
Radioactive tracer uptakes: Substrate uptake into oocytes was measured using a radioactive tracer technique (Hediger et al., 1987). Oocytes were incubated in Na+ buffer with 14C-αMDG (50 μM, Amersham, Piscataway, NJ, U.S.A.) and in presence or absence of the glycoside for 10 min at 23°C. Background uptake of αMDG into non-injected oocytes from the same batch was subtracted.
Buffers: Na buffer was (in mM): NaCl 100, KCl 2, MgCl2 1, CaCl2 1, HEPES/tris 10, pH 7.4. In the Na+-free buffer choline Cl replaced NaCl. For experiments at pH 5.5 the buffer was 2-(N-morpholino)ethanesulphonic acid(MES)/tris; at pH 9 the buffer was (3-cyclohexylamino)propane sulphonic acid(CAPS)/tris.
Reagents: cRNA was synthesized from the clones using kits from Ambion (Austin, TX, U.S.A.) following the manufacturer's instructions. α-Methyl-D-glucopyranoside (αMDG), 8-hydroxyquinoline-β-D-glucopyranoside (HQ), 4-methylumbelliferyl-β-D-glucopyransoside (4-MU), 6,7-dihydroxycoumarin-β-D-glucopyranoside (esculin), 1-naphthyl-β-D-galactopyranoside (1-NaphGal), 2-naphthyl-β-D-galactopyranoside (2-NaphGal) and nortriptyline were purchased from Sigma (St. Louis, MO, U.S.A.). γ-Aminobutyric acid (GABA) was from Aldrich (Milwaukee, WI, U.S.A.). SKF89976A, (RS)-baclofen and saclofen were purchased from Tocris (Bristol, U.K.). 5-Bromo-3-indolyl-β-D-galactose (5-Br) and 5-bromo-6-chloro-3-indolyl-β-D-galactose (5-Br-6-Cl) were from Fluka (New York, NY, U.S.A.). All other reagents were from Sigma.
Computational chemistry: All structures were built and computations performed using Hyperchem, versions 5.11 and 6.0 (Hypercube, Gainesville, FL, U.S.A.). Conformational searching was done using the conformational search module (Version 6.0) using 60° rotations.
Each structure was initially relaxed using the MM+force field in vacuo. An estimate of the charge distribution was made using a single point calculation using the semiempirical AM1 method, and the geometry was optimized using these charges in MM+. These last two steps were repeated, and differences after the second iteration were usually minor. Low energy conformations were determined by rotation about all of the bonds connecting the pyranose and aromatic rings.
Crystal structures for salicin (CIZWOX), 4-methylumbelliferyl-β-D-glucose (GEMDOR) and phlorizin (CEWWAC) were obtained from the Cambridge Structural Database. All share a common alignment with salicin in the proximal aromatic ring and so we used this as a platform to build a preliminary hSGLT1 pharmacophore. The possible configurations of each test compound that had torsions of the first ring corresponding to those of salicin were compared. The conformation of rhapontin and deoxyrhapontin are constrained by the unsaturated bond (see Table 1). We reasoned that phlorizin and deoxyrhapontin, having similar functional effects, would bind to the same site in hSGLT1. Therefore, comparisons using phlorizin, which has a flexible second ring position, were limited to conformations similar to that for deoxyrhapontin. The final set of structures was compared by overlaying them using O5, C1 and O1 of the pyranose.
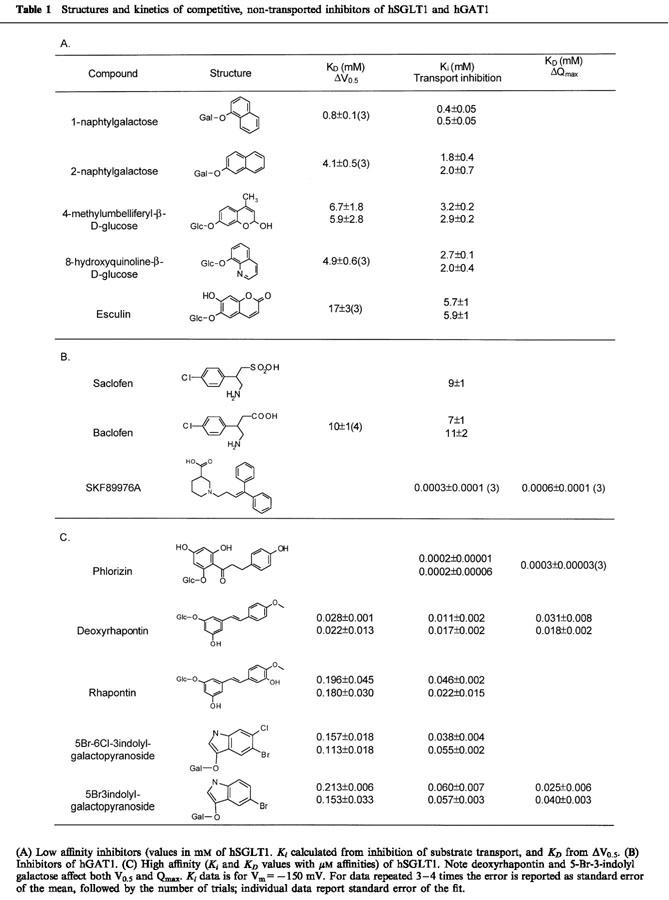
Table 1.
Structures and kinetics of competitive, non-transported inhibitors of hSGLT1 and hGAT1
Results
In these experiments we have used non-transported inhibitors of substrate transport by hSGLT1 and hGAT1 (the compounds are shown in Table 1). All of these compounds inhibited substrate-dependent currents in a concentration-dependent manner, yielding an inhibitor constant (Ki). The biophysical properties of these cotransporters were used to quantitate the abundance and distribution of the transporter states by measuring the presteady state charge movements. Relating the concentration of inhibitor to the abundance of the Na++inhibitor complex state was used to determine a binding constant (KD).
hSGLT1
The glycoside affinity for hSGLT1 was determined from the inhibition of αMDG transport. Figure 1A shows a continuous current record of an oocyte expressing hSGLT1 in Na+ buffer, with its membrane potential (Vm) clamped at −50 mV. When 0.4 mM αMDG, the K0.5 concentration, was added to the bath about 280 nA of inward current was produced and when 7 mM of HQ was added to the solution this current was reduced 50% (140 nA). The current returned to the baseline when αMDG and the glycoside were washed out. If 7 mM HQ alone was added to the bath no inward current was induced, indicating that this molecule is not transported. Measuring the inhibition of αMDG currents as a function of inhibitor concentration allows determination of Ki. In Figure 1B we show an example determination for I0.5 for esculin (13±3 mM). The Ki for esculin was estimated to be 6.5 mM from the relationship Ki=0.5 I0.5. The Ki's were determined at −150 mV because the currents were larger at hyperpolarizing potentials. The influence of membrane potential on Ki was small (less than 2 fold), increasing as the membrane is depolarized from −150 to −50 mV. Table 1 lists the Ki values for 10 glycosides.
Figure 1.
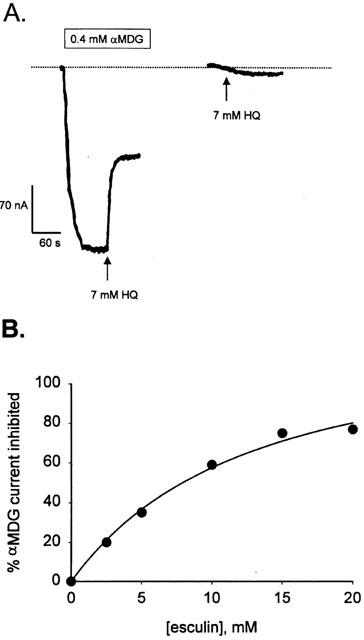
Inhibition of sugar transport by 7 mM 8-hydroxyquinoline glucoside in hSGLT1. (A) Continuous current record of an oocyte expressing the human SGLT1 protein, with membrane potential clamped at −50 mV. The first trace shows the inhibitory effect of 7 mM HQ (arrow) on the sugar-dependent current. The second trace shows that when 7 mM HQ alone was applied to the oocyte in Na+ buffer (arrow) no inward current was generated, indicating that HQ is not a transported substrate. The bar at the top shows the period when αMDG was present in the superfusate, and the dotted line shows the level of the steady state current in Na+ buffer. (B) Concentration dependent inhibition of the αMDG induced current by esculin. The amount of the 0.4 mM αMDG current inhibited by 0 – 20 mM esculin is plotted against [esculin] for a membrane potential of −130 mV. The curve shows the fit to equation (1).
We verified that inhibition of sugar-dependent current was consistent with inhibition of sugar transport. Figure 2 shows that 1 mM 1-NaphGal inhibited 50 μM αMDG uptake by about 70%, and 7 mM HQ and 10 mM 4-MU inhibited by about 50%, consistent with the Ki for sugar-dependent current.
Figure 2.
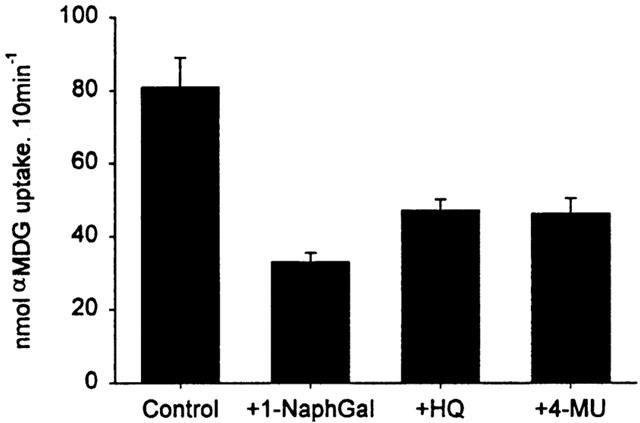
Inhibition of sugar uptake by glycosides. The glycosides (1 mM 1-NaphGal, 7 mM HQ and 10 mM 4-MU) inhibited 14C αMDG (50 μM) uptake into hSGLT1-expressing oocytes consistent with inhibition of sugar-induced current. The oocytes in this representative experiment were from a single frog. Each bar represents the mean uptake of 4 – 5 oocytes±standard error.
Binding of these inhibitor glycosides to hSGLT1 in the absence of substrate also affected the presteady state current transient. Initially, the membrane ‘holding potential' (Vh) was −50 mV. A step change in voltage was then applied for 100 msec before returning to Vh. This perturbation resulted in generation of a transient current (‘on') transient), which decayed within 100 msec. When the membrane potential was returned to Vh, and the transporter returned to its initial condition, a transient current in the opposite direction was generated (not shown; see Loo et al., 1993). The charge moved in response to the voltage pulse was the same as that moved when the voltage was returned to the initial holding potential. Figure 3A compares the (‘on' transient), induced in response to voltage pulses from +50 to −150 mV for hSGLT1 in Na buffer alone (−Esculin) and Na buffer +20 mM esculin (+Esculin). The charge moved was obtained by integration of the current with time.
Figure 3.
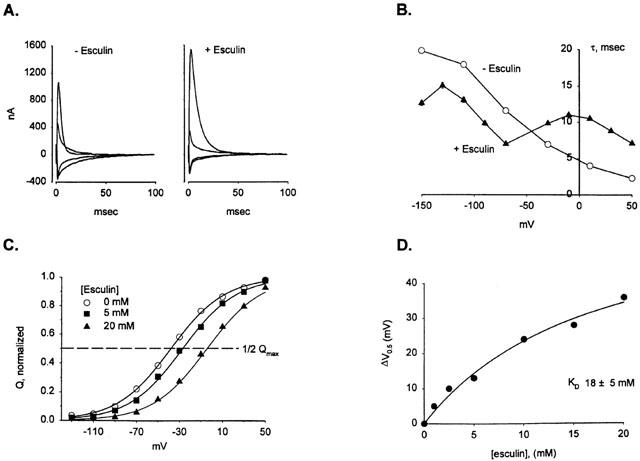
Binding of esculin to hSGLT1 shifts the presteady state current distribution. (A) The pattern of presteady state current for hSGLT1 in Na+ buffer for a series of 100 ms voltage jumps (see Methods) in the presence and absence of 20 mM esculin. For clarity, only the response to the voltage perturbation ‘on' current) is shown. The initial membrane potential was −50 mV (Vh), and a series of voltage jumps (+50 to −150 mV) was applied for 100 ms before returning to Vh. Traces for depolarizing voltages to +50 and −30 mV and hyperpolarizing voltages of −70 and −150 mV are shown. Both the steady state current and the lipid bilayer capacitance have been subtracted. Integration of these currents with time yields the amount of charge moved in response to the voltage pulse. In this experiment, fitting the data to equation [2] showed that for Na only V0.5on=46±3 mV, V0.5off=48±2 mV, Qmaxon=17±1 nC and Qmaxoff=18±1 nC; for 20 mM esculin, V0.5on=−10±3 mV, V0.5off=−12±1 mV, Qmaxon=21±1 and Qmaxoff=21±1 nC. (B) The time constant (τon) for the decay of the presteady state currents is plotted as a function of membrane potential for Na only (open circles) and Na +20 mM esculin (closed triangles). For Na only τon decreased as the membrane potential was made more depolarizing. In the presence of esculin the τon/V relationship was biphasic. (C) Charge/voltage relationship for esculin and kinetic analysis of the V0.5 shift. Three experiments performed on the same oocyte are plotted for exposure to 0, 5 and 20 mM esculin, and each one was fit to the Boltzmann equation [2]. The fraction of the normalized total charge (Q) moved in response to each voltage step is plotted for 0, 5 and 20 mM esculin in Na+ buffer. The curve is the fit to equation (2), which yields values for the V0.5 and Qmax. The calculated values for Qmax were 13±1, 15±1, 17±1 nC and V0.5's were −38±1, −27±2, −4.3±1 mV for 0, 5 and 20 mM esculin. (D) The shift in V0.5 appeared to saturate with increasing concentrations of inhibitor. The difference between the V0.5 for each concentration of esculin and the preceding Na+-only record was plotted against [inhibitor]. Fitting the data to equation [1] resulted in an apparent affinity of 18±5 mM.
Figure 3B shows how the voltage dependence of the time constant of the ‘on' transient (τon) changed when esculin was bound to hSGLT1. In the absence of inhibitor τon was maximal at −150 mV and continuously decreased with depolarization. In contrast, when 20 mM esculin was in the solution, the τon/V curve was biphasic, and the time constant for jumps to depolarizing voltages was slower than for Na only, whereas if the jump was to hyperpolarizing values τon was faster. For example, for the step −50 mV to +50 mV τon increased from 2±0.1 ms in Na buffer to 7±0.1 ms in 20 mM esculin, but for −50 mV to −150 mV τon decreased from 19±0.2 ms to 12±0.3 ms.
The presteady state charge (Q) moved for each voltage jump are plotted against voltage (Figure 3C). The V0.5 value for Na+ was −38 mV and increased in a concentration-dependent manner with the addition of esculin: for 5 mM esculin V0.5 was −27 mV and for 20 mM esculin it was −4 mV. The shift in V0.5 was a nonlinear function of esculin concentration with a KD of 18±5 mM (Figure 3D). Table 1 summarizes the affinity values obtained from inhibiting sugar transport (Ki) and the values obtained from the V0.5 shift (KD).
hGAT1
Figure 4A shows that saclofen and baclofen were inhibitors of GABA induced currents. Neither compound induced an inward current, indicating that they are not transported substrates. Figure 4B shows that increasing [baclofen] shifted the V0.5 of the hGAT1 presteady state current to depolarizing potentials in a concentration-dependent manner with an estimated KD of 8±2 mM. Baclofen also affected the time constant in a manner similar to that for esculin in hSGLT1. In the absence of inhibitor τon was maximal between −70 and +10 mV (Figure 4C). For depolarizing voltage pulses τon increased (at +50 mV from ∼60 to 210 ms), and at hyperpolarizing voltages τon was faster in the presence of baclofen (at −110 mV from 90 to 53 ms).
Figure 4.
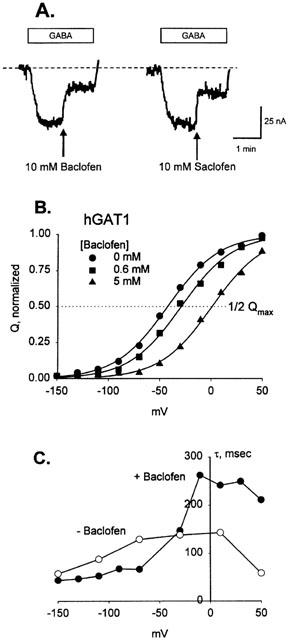
Effect of baclofen on hGAT1 substrate-dependent and presteady state currents. (A) Saclofen and baclofen inhibit GABA transport. An oocyte expressing hGAT1 was initially bathed in Na buffer. Addition of 10 μM GABA induced a current of ∼40 nA. 10 mM baclofen inhibited this current by 60%, and 10 mM saclofen inhibited transport by about 50%. The broken line is the level of current in Na+ buffer. (B) Binding of baclofen increased the number of transporters in the outward-facing conformation. An hGAT1 expressing oocyte was exposed to 0, 0.625 and 5 mM baclofen using the same methods as described for hSGLT1. The normalized presteady state charge (from 800 ms pulses) is plotted against voltage, as in Figure 2. Values for Qmax were 108±2, 102±2 and 96±3 nC; V0.5 was −42±2, −29±2, and +1±2.2 mV for 0, 0.625 and 5 mM baclofen. (C) The time constant (τon) in the absence of baclofen was maximal between −70 and +10 mV (∼140 msec). In 10 mM baclofen τon was slower at depolarizing voltages and faster for hyperpolarizing voltage steps.
In comparison, phlorizin and SKF89976A had a different effect on the presteady state. Figure 5A shows the Q-V relationship for two concentrations of phlorizin compared to that in Na alone for hSGLT1. Qmax decreased in a concentration dependent manner, but V0.5 and τon were unchanged. Fitting the ΔQmax data to [phlorizin] (Figure 5B) indicated a KD of 0.2±0.03 μM. Similar results were observed for hGAT1 using SKF89976A (Table 1B). Table 1C also shows that there were compounds which had a mixed effect; binding of deoxyrhapontin and 5-Br to hSGLT1 produced both V0.5 and Qmax changes. The Ki and KD's for deoxyrhapontin were all in agreement: Ki=14 μM, KD's 25 μM for ΔV0.5 and 24 μM for ΔQmax. For 5-Br, however, the Ki and KD for ΔQmax were in close agreement (58 μM and 32 μM) but the value estimated using ΔV0.5 was higher (183 μM).
Figure 5.
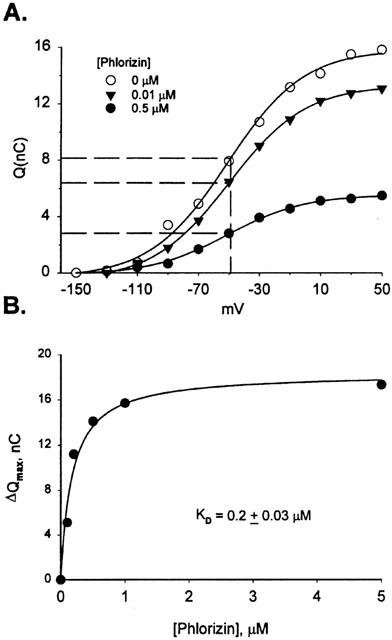
Charge/voltage relationship for phlorizin and kinetic analysis of ΔQmax. (A) The charge (Q) moved for 0, 0.1 and 0.5 μM phlorizin is plotted for each voltage. The dotted line corresponds to 0.5 Qmax for each curve, showing that V0.5 did not change with increasing concentration of phlorizin. (B) ΔQmax is plotted against [phlorizin], and the data was fit to equation [1], indicating a KD of 0.2±0.03 μM.
Phloretin, the aglycone of phlorizin, is a non-competitive inhibitor of sugar transport. The Ki for inhibition of 0.4 αMDG transport was 15 – 50 μM, and, in the absence of substrate, phloretin shifted the V0.5 to depolarizing voltages in a concentration-dependent manner but did not decrease Qmax (not shown). Nortriptyline was an inhibitor of hGAT1 transport. Dixon plots of nortriptyline inhibition of GABA transport indicated that nortriptyline is a non-competitive inhibitor having a Ki of ∼40 μM (not shown). The slow binding and recovery kinetics of phloretin and nortriptyline (recovery times from several minutes to over 1 h) precluded analysis of presteady state transients.
Keto-enol tautomers of phlorizin
Phlorizin undergoes a keto-enol tautomerization (Diedrich, 1963), with the enol-tautomer favoured at high pH and the keto-tautomer being most abundant at low pH. At the normal pH of 7.5 0.2 μM phlorizin completely inhibited the 0.4 mM αMDG-dependent current and the uncoupled Na ‘leak' current through hSGLT1 (not shown). Similarly, when the experiment was done at pH 5, both the αMDG current and the leak current were inhibited. At pH 9, however, sugar transport was inhibited by less than 50%, indicating that the high affinity form of phlorizin is the keto-form. There was no apparent effect of pH on transport in the absence of phlorizin.
Construction of a pharmacophore for hSGLT1 (Figure 6A)
The primary determinant of binding of the glycosides is the sugar: Functionally, only glucose and galactose are substrates and only conjugates of these sugars bind with high affinity (Lostao et al., 1994). This indicates that the position of the sugar in the binding site is well defined. The position of aromatic substituents at O1, therefore, have a defined location in the vestibule, and are torsionally restricted by interactions with the pyranose ring. We have chosen the configuration of the crystal structure of salicin as the foundation for the pharmacophore, as this configuration of the sugar and first aromatic ring is shared by the crystal structures of both 4-MU and phlorizin.
Figure 6.
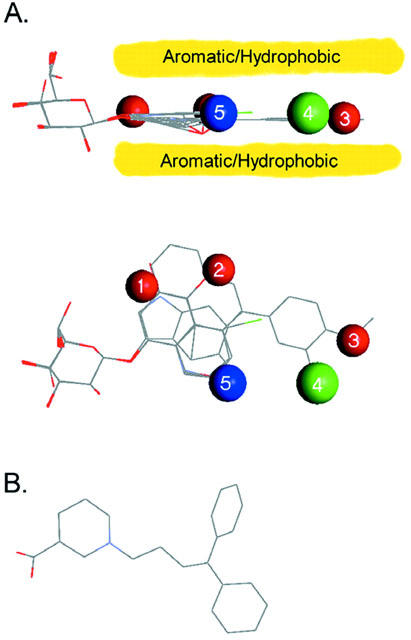
Pharmacophore for inhibiton of hSGLT1. Seven structures, representative of the range of shapes and potentially interacting groups are overlaid, and regions and types of interactions from the surrounding protein are designated. (Salicin, arbutin, two conformations of 2-NaphGal, 1-NaphGal, rhapontin, and 5-Br-6-Cl.) Red spheres are areas which have the capacity to donate and accept H-bonds from the glycoside; the blue sphere is a location where only a donation to the glycoside is allowed; green signifies a position where H-bonding is not favourable; and the yellow region shows the extent of a planar region of aromatic or hydrophobic interaction. Interactions for the sugar are not shown. (A) Side view, showing the planar structure of the inhibitors and its alignment with the pyranose ring. The yellow bands indicate the aromatic/hydrophobic interaction with the protein. (B) Top view of the pharmacophore, showing location of predicted hydrogen bonding interactions. (C) Structure of the GAT1 pharmacophore, adapted from N'goka et al. (1991) showing similarities in size and structure of the SGLT1 and GAT1 pharmacophores.
Inhibitors containing a single aromatic ring (e.g., p-nitrophenyl-β-D-glucose and β-D-glucopyranosyl phenylisothiocyanate) have affinities ranging from 0.1 to 100 mM (Lostao et al., 1994; Díez-Sampedro et al., 2000). Computational analysis of the structures suggested that low energy conformations coincided with that of salicin, and suggested a common platform of interaction in the region of the sugar binding site. Díez-Sampedro et al. (2000) increased the number of aromatic rings of inhibitors (e.g., α- and β-naphthylgalactose, esculin), and found that, despite the variety of functional groups included, the overall inhibition constants were similar (KD 0.8 to 13 mM), even though the size of the structure increased in area 3-fold, suggesting that the aromatic rings made favourable interactions with structures in the vestibule.
The structure was extended even further by rhapontin and deoxyrhapontin (KD 190 and 25 μM). After alignment of the proximal aromatic ring with that of salicin, the rest of the structure was then defined, as interaction of the aromatic rings with the ethenyl linkage require a flat arrangement of the aromatic rings (Figure 6A). All of the other compounds had (including the keto-form of phlorizin) low energy configurations which were compatible with this framework.
This suggests that a broad (7×12 Å) planar area of the protein interacts with the aromatic rings. We propose that the aromatic (or hydrophobic) residues making up this structure extend at least to the location of the distal ring of deoxyrhapontin, and contribute to its binding affinity (Figure 6A). Functional groups surrounding this region contribute interactions which determine the specificity of binding.
Interactions determining binding
The primary interactions can be described by five regions in space (numbers 1 – 5, Figure 6A) surrounding the aromatic/hydrophobic plane. The inhibitor binding site is in a narrow vestibule, which is distal to the O1 position of the pyranose, and presumably leads to the extracellular environment. There appear to be three peripheral locations where both H-bond donors and acceptors are located (red), one in which a H-bond is not favourable (green), and one where only a donation (blue) to the glycoside is made. Selection is also made by interactions of groups within the aromatic/hydrophobic region.
On the proximal ring H-bonds of both polarities are acceptable in two locations. Position 1 lies in the area where the -OH of rhapontin, deoxyrhapontin, and one from phlorizin are located. This suggests the interactions involve H-bonds to a polar side chain. In addition, the indole nitrogen is in this area. We propose that this region is part of the area where the aromatic rings of most of the compounds contact the protein.
Position 2 is located in the para-position of the proximal ring and influences both binding selectivity and translocation. The protein appears to accept and donate H-bonds here, but if only a donation to the glycoside is possible (e.g., NO2, isothiocyanate), the compound is an inhibitor (Lostao et al., 1994). As discussed later, H-bond donation is associated with translocation. This suggests that, as in position 1, a donor polar side chain is probably involved.
There are two adjacent regions which also may be involved with side-chain interactions. Position 3 is proposed to be common to rhapontin, deoxyrhapontin and phlorizin, placing a -OH or -OCH3 here. These three inhibitors all have a high affinity, suggesting that the protein will donate a H-bond, but there is not a requirement for accepting one from the inhibitor. In contrast, position 4 appears to exclude the interactions of the -OH of rhapontin, as compared to deoxyrhapontin, which does not have this group; rhapontin is a weaker inhibitor. We used the KD's to estimate the change in binding free-energy between rhapontin and deoxyrhapontin to be 1.2 kcal/mole (using ΔG=RT In (KDrhapontin/KDdeoxyrhapontin)), suggesting involvement of a single H-bond. Phlorizin also has a para-OH, suggesting that it also binds in this location.
This observation has implications for the structure of phlorizin. The 3-carbon linker between aromatic rings imparts flexibility to its structure, and predictions that the most favourable structure for phlorizin places the distal ring folded back over the sugar have made using computational chemistry and NMR methods (Lostao et al., 1994; Wielert-Badt, et al., 2000). However the similarity in structure, affinity and functional effect of phlorizin, rhapontin and deoxyrhapontin suggest that the second ring of all three compounds bind in the same location of SGLT1, requiring that phlorizin binds to hSGLT1 in an extended configuration.
A critical site for recognition resides in position 5. Previous studies showed that an ortho-CH2OH was detrimental to binding, but ortho-CH=O was a transported substrate (Lostao et al., 1994). The keto-form of phlorizin is the high affinity tautomer and it places the same functional group as helicin (-CH=O) in position 5. In contrast, the enol-form places the identical group as salicin (-CH2OH) here, a factor we predict accounts for the great difference in inhibition between the enol- and keto-tautomers.
Discussion
In this study we have exploited the biophysical characteristics of cotransporters to derive a preliminary pharmacophore for inhibitors of hSGLT1. The similarity in the functional effect of inhibitors on the Na+/glucose and Na+/Cl−/GABA cotransporters suggest a common inhibitory mechanism is used in the two transporter families.
Characteristics of inhibitors
Biophysical analysis of interactions of substrates and inhibitors provides unique insights into cotransporter function. Classically, inhibitors are defined by inhibition of transport of a substrate. The compounds used in this study inhibited transport (radioactive tracer uptake and substrate-dependent electrical currents), but were not transported substrates (Figures 1, 2, 4). An inhibitory constant, Ki, was calculated for each compound by measuring inhibition of the substrate-dependent current as a function of inhibitor concentration.
We then exploited the electrical properties of cotransporters to measure changes in their conformation that result from ligand binding (Loo et al., 1998). Binding of inhibitors altered the distribution of kinetic states in two ways: One group of inhibitors of hSGLT1 increased the proportion of transporters in the outward-facing orientation, without decreasing the number of functional transporters (Figure 3C). The change in V0.5 was concentration dependent and was used to estimate a binding constant, KD (Figure 3D). These values are in good agreement with the Ki's (Table 1A, Figure 7). The same analysis was applied to hGAT1 with the GABA analogues baclofen and saclofen (Table 1B). Binding of both inhibitors resulted in a concentration-dependent shift of the V0.5 (e.g., baclofen, Figure 4B), and the KD values agreed with the Ki's (Table 1B).
Figure 7.
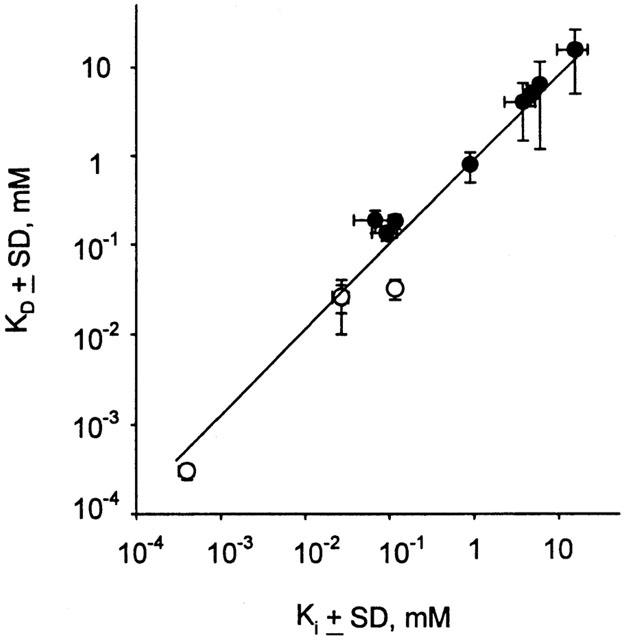
Correlation of KD and Ki. The mean of each data set from Table 1 is plotted as Ki vs KD on a log/log scale. The line is fit to a linear regression, with slope=0.95 and regression coefficient r2=0.98. Open symbols are for KD determined from ΔQmax data, and closed symbols are from ΔV0.5 measurements; the Ki is always derived from inhibition of substrate-dependent current.
Binding of high affinity inhibitors in both cotransporters effectively locked the transporter in a fully loaded, outward-facing orientation (NaSC3) substate (see Figure 8). Hence, there was a concentration-dependent decrease in Qmax but no effect on V0.5 or τ (Figure 5A). For hSGLT1 the KD's determined from ΔQmax and ΔV0.5 were in good agreement with Ki over five orders of magnitude (Figure 7).
Figure 8.
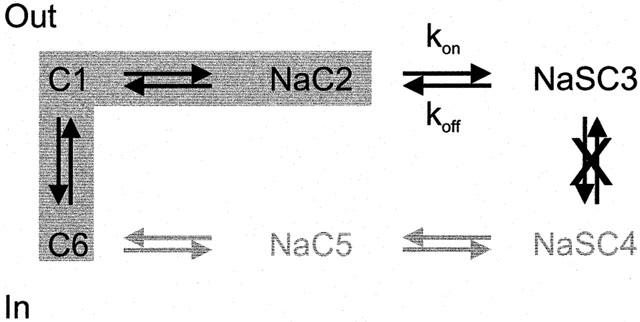
Kinetic model of inhibition. The 6-state kinetic model is shown in a simplified form to show the states involved in inhibitor binding. The shaded region are the conformations believed to generate the presteady state current. For simplicity, we show that when the inhibitor binds the translocation step is not allowed, however, we acknowledge that failure to release substrate on the inside could be the critical defect in transport.
hSGLT1 inhibitor pharmacophore
Analysis of the β-glycoside interactions with hSGLT1 has allowed us to construct a pharmacophore for binding to hSGLT1 (Figure 6). Binding of the sugar places the aromatic moiety in the vestibule leading to the sugar-binding site, where it interacts with hydrophobic/aromatic residues coplanar with the pyranose ring. Surrounding this area are five main sites of H-bond interactions which determine the mode of inhibition: If the binding energy of the inhibitor is primarily from sugar binding the glycoside is a weak inhibitor and results in the ΔV0.5 effect, but if there is a significant contribution from binding in the vestibule, the compound behaves like phlorizin, and reversibly inactivates the transporter. We predict a continuum model in which the effect on the transporter is determined by the ratio of the inhibitor binding constants, kon and koff, for the inhibitor binding step of SGLT1 (Figure 8) and hGAT1.
Examining the structures of the high affinity inhibitors of hSGLT1 and hGAT1 reveals a common theme (Table 1, Figure 6): Each is comprised of a substrate analogue (glucose or nipecotic acid) attached to a pair of aromatic rings. Specificity is bestowed by the substrate analogue and the location of the aromatic rings is determined by the tether. For GAT1 length of the tether has been systematically studied (e.g., N'goka et al., 1991; Knutsen et al., 1999). For both hSGLT1 and GAT1 pharmacophores the inhibitor moiety is essentially coplanar with the substrate moiety. The aromatic rings for SKF89976A are ∼8 Å from the nitrogen, and for phlorizin the distance from O1 to the centre of the distal ring is also ∼8 Å. Since the aromatic part of SKF89976A, tiagabine and NNC711 appear to bind to a specific location in GAT1 (see Knutsen et al., 1999), and phlorizin, deoxyrhapontin and rhapontin share structural similarities, we speculate that a specific inhibition site, close to the substrate binding site, exists in both cotransporters.
Reversible non-competitive inhibitors share structural similarities with the competitive inhibitors. Phloretin is a non-competitive inhibitor of hSGLT1 (Ki of 15 – 50 μM), and nortriptyline, a tricyclic antidepressant drug, of hGAT1 with a Ki of 10 – 40 μM (unpublished; Nakashita et al., 1997). Phloretin is the aglucone of phlorizin, so the structural similarity is obvious. Nortriptyline (and the other tricyclics) share a common structural plan of two aromatic rings joined by a non-aromatic 7-membered ring. The placement of these rings is similar to the arrangement of the aromatic rings of the competitive inhibitors of hGAT1. We speculate that these non-competitive inhibitors bind in the same site of the transporter as the aromatic rings of the competitive inhibitors.
Insights into transport
Subtle changes in structure change a glycoside from a transported substrate to a blocker. For example, an essential H-bond donation to the protein is made in the translocation pathway: At position 2, a para-NO2 or -N=C=S created an inhibitor from the transported phenyl-β-D-glucose, but a para-OH (Lostao et al., 1994) or -NH2 (unpublished) imparts transportability and decreases K0.5. Similarly, Díez-Sampedro et al. (2000) showed that 3-indoxyl-β-D-glucose is transported with a low K0.5 (60 μM), indicating importance of the nitrogen, but both 5-bromo-3-indolyl-β-D-galactose and 5-bromo-6-chloro-3-indolyl-β-D-galactose were low Ki inhibitors (Table 1).
Mechanism of inhibition: Interpretation of the presteady state
We observe two different effects on presteady state kinetics: in the first, binding resulted in changing the value of V0.5, and in the other, the value of Qmax decreased. How does binding of an inhibitor produce these effects?
We interpret the concentration dependent shift in V0.5, with no reduction in Qmax in the following way: In the initial condition for hSGLT1, NaCl in the absence of inhibitor and a membrane potential of −50 mV inside, the transporters are equally divided between empty, inward facing (C6, notation of Parent et al., 1992b) and outward facing (C1 and NaC2) conformations (Figure 8). The empty transporter carries a net negative charge, and so it is sensitive to changes in the membrane potential. If we change the voltage to a positive value, +50 mV, all of the transporters will be in the inward facing conformation. This conformational change, resulting in reorientation of charges and/or dipoles in the electric field, is the transient current. A current in the other direction is generated by a hyperpolarizing jump to −150 mV.
When the inhibitor is added, some of the transporters in the NaC2 conformation will bind the inhibitor and go to the fully loaded state NaSC3 reducing the concentration of the Na-loaded conformation. The voltage-sensitive C6-C1-NaC2 equilibrium is upset and more transporters in C6 reorient to NaC2 (Figure 8), resulting in an increase in the proportion of transporters facing the outside. This is reflected in the shift of the V0.5 to more depolarizing voltages.
The biphasic shape of the τ/V curve of Figure 3B is consistent with this model. For hSGLT1, in Na alone, the time constant for the depolarizing step to +50 mV was 2.3 msec. When 20 mM esculin was added to the bath the τon increased to 7.0 msec (+50 mV, Figure 3B) as a result of the addition of a fourth step in the process. (Similarly, for hGAT1, in Na alone, τon was 59 msec, and if 10 mM baclofen was added to the bath, τon increased to 211 msec at +50 mV, Figure 4C). For hyperpolarizing steps the time constants were faster in the presence of inhibitor (Figures 3B, 4C) and this is consistent with the inhibitor ‘pulling' transporter from the C6 to the C3 conformation.
At the other extreme, the effect of high affinity, tightly binding inhibitors was to reduce number of functional transporters (Qmax) without changing V0.5 (e.g., phlorizin, Figure 5A). The decrease in Qmax was concentration dependent and fitting to equation (1) resulted in a KD of 0.3±0.03 μM (Table 1C). SKF89976A had the same effect on hGAT1. The KD estimated from the [SKF89976A] decrease in Qmax was 0.6±0.1 μM. Dixon plots for inhibition of GABA transport indicated a Ki for SKF89976A on hGAT1 of 0.3±0.02 μM (Table 1B).
We would then predict that the dissociation rates of high affinity inhibitors are slow (>>100 msec), and therefore only the free transporters are able to change states in response to voltage and there should be no change in τ. Our results support this hypothesis: e.g., in hSGLT1 the τon in Na was 2.5 msec, and after addition of 1 μM phlorizin τon was 2.3 msec. Similarly, τon for hGAT1 was 67 msec and 70 msec in the absence and presence of 5 μM SKF89976A. The effect of high affinity inhibitors (SKF89976A, tiagabine and NO-711) have been described by other groups on rat GAT1 (Mager et al., 1993; Eckstein-Ludwig et al., 1999) and are consistent with our observations on hGAT1.
A continuum of interactions between these two extremes exists, as both deoxyrhapontin and 5-Br show both effects on conformation: a concentration-dependent decrease in Qmax and a shift in V0.5 to positive values. One explanation for the difference in KD measured using ΔQmax compared to that using ΔV0.5 is that binding may proceed through multiple steps. A hint that this may be occurring is the slow timecourse of inhibition of GABA transport through hGAT1 by SKF89976A.
Conclusions
These experiments show that (1) important kinetic information on inhibitor binding to electrogenic cotransporters can be obtained by monitoring how they alter transporter conformation using electrical measurements. The KD and Ki values determined by these different methods are reliable over 5-orders of magnitude; (2) analysis of the structures and affinities of inhibitors has led to a proposed inhibitor pharmacophore for hSGLT1. The data provides evidence that there is a region in hSGLT1 (and hGAT1), which is a separate binding site for the non-substrate portion of inhibitors such as phlorizin (and SKF89976A). The site is important in the translocation process, as when this site is occupied, transport cannot occur; (3) insights into the mechanism of cotransport can be gained from the analysis of modes of interaction of inhibitors, and the ability to separate selectivity for binding from the factors important in translocation will enable study of the process of translocation.
Acknowledgments
We thank Mary L. Bing, Amanda Johnson and Daisy W. Leung for technical assistance with the oocytes, and Dr Donald D.F. Loo for insightful comments and stimulating discussions. This work was supported by grants from the NIH GM 52094, GM 99004 and DK 19567. A. Díez-Sampedro is the recipient of a postdoctoral fellowship from the ‘Departamento de Educación, Universidades e Investigación del Gobierno Vasco'.
Abbreviations
- 5-Br
5-bromo-3-indolyl-β-D-galactopyranoside
- 5-Br-6-Cl
5-bromo-6-chloro-3-indolyl-β-D-galactopyranoside
- GABA
γ-aminobutyric acid
- hGAT1
human Na+/Cl−/GABA cotransporter isoform 1
- HQ
8-hydroxyquinoline-β-D-glucopyranoside
- hSGLT1
human Na+/glucose cotransporter isoform 1
- αMDG
α-methyl glucopyranoside
- 4-MU
4-methylumbelliferyl-β-D-glucoside
- 1-NaphGal
1-naphthyl-β-D-galactose
- 2-Naphgal
2-naphthyl-β-D-galactose
References
- ALVARADO F., CRANE R.K. Studies on the mechanism of intestinal absorption of sugars. Biochim. Biophys. Acta. 1964;93:116–135. doi: 10.1016/0304-4165(64)90266-1. [DOI] [PubMed] [Google Scholar]
- BEAUCHAMP L.M., ORR G.F., DE MIRANDA P., BURNETTE T., KRENITSKY T.A. Amino acid ester prodrugs of acyclovir. Antiviral Chem. Chemother. 1992;3:157–164. [Google Scholar]
- BIRNIR B., LOO D.D.F., WRIGHT E.M. Voltage-clamp studies on the Na+/glucose cotransporter cloned from rabbit small intestine. Pflügers Arch. 1991;418:79–85. doi: 10.1007/BF00370455. [DOI] [PubMed] [Google Scholar]
- BRAESTRUP C., NIELSEN E.B., SONNEWALD U., KNUTSEN L.J.S., ANDERSEN K.E., JANSEN J.A., FREDERIKSEN K., ANDERSEN P.H., MORTENSEN A., SUZDAK P.D. (R)-N-[4,4-bis(3-methyl-2-thienyl)but-3-en-1-yl]nipecotic acid binds with high affinity to the brain γ-aminobutyric acid uptake carrier. J. Neurochem. 1990;54:639–647. doi: 10.1111/j.1471-4159.1990.tb01919.x. [DOI] [PubMed] [Google Scholar]
- DIEDRICH D.F. The comparative effects of some phlorizin analogs on the renal reabsorption of glucose. Biochim. Biophys. Acta. 1963;71:688–700. doi: 10.1016/0006-3002(63)91142-9. [DOI] [PubMed] [Google Scholar]
- DÍEZ-SAMPEDRO A., LOSTAO M.P., WRIGHT E.M., HIRAYAMA B.A. Glycoside binding and translocation in Na+-dependent glucose cotransporters: Comparison of SGLT1 and SGLT3. J. Membrane Biol. 2000;176:111–117. doi: 10.1007/s00232001081. [DOI] [PubMed] [Google Scholar]
- ECKSTEIN-LUDWIG U., FEI J., SCHWARZ W. Inhibition of uptake, steady-state currents, and transient charge movements generated by the neuronal GABA transporter by various anticonvulsant drugs. Br. J. Pharmacol. 1999;128:92–102. doi: 10.1038/sj.bjp.0702794. [DOI] [PMC free article] [PubMed] [Google Scholar]
- ESKANDARI S., WRIGHT E.M., KREMAN M., STARACE D.M., ZAMPIGHI G.A. Structural analysis of cloned plasma membrane proteins by freeze-fracture electron microscopy. Proc. Natl. Acad. Sci. U.S.A. 1998;95:11235–11240. doi: 10.1073/pnas.95.19.11235. [DOI] [PMC free article] [PubMed] [Google Scholar]
- FALK S., GUAY A., CHENU C., PATIL S.D., BERTELOOT A. Reduction of an eight-state mechanism of cotransport to a six-state model using a new computer program. Biophys. J. 1998;74:816–830. doi: 10.1016/S0006-3495(98)74006-8. [DOI] [PMC free article] [PubMed] [Google Scholar]
- FORSTER I., WAGNER C.A., BUSCH A.E., LANG F., BIBER J., HERNANDO N., MURER H., WERNER A. Electrophysiological characterization of the flounder Type II Na+/Pi cotransporter (NaPi-5) expressed in Xenopus oocytes. J. Membrane. Biol. 1997;160:9–25. doi: 10.1007/s002329900291. [DOI] [PubMed] [Google Scholar]
- HAZAMA A., LOO D.D.F., WRIGHT E.M. Presteady-state currents of the rabbit Na+/glucose cotransporter. J. Membrane Biol. 1997;155:175–186. doi: 10.1007/s002329900169. [DOI] [PubMed] [Google Scholar]
- HEDIGER M.A., COADY M.J., IKEDA T.S., WRIGHT E.M. Expression cloning and cDNA sequencing of the Na+/glucose cotransporter. Nature. 1987;330:379–381. doi: 10.1038/330379a0. [DOI] [PubMed] [Google Scholar]
- HEDIGER M.A., TURK E., WRIGHT E.M. Homology of the human intestinal Na+/glucose cotransporter and Escherichia coli Na+/proline cotransporters. Proc. Natl. Acad. Sci. U.S.A. 1989;86:5748–5752. doi: 10.1073/pnas.86.15.5748. [DOI] [PMC free article] [PubMed] [Google Scholar]
- HILGEMANN D.W., LU C.-C. GAT1 (GABA:Na+:Cl−) cotransport function. Database reconstruction with an alternating access model. J. Gen. Physiol. 1999;114:459–475. doi: 10.1085/jgp.114.3.459. [DOI] [PMC free article] [PubMed] [Google Scholar]
- HIRAYAMA B.A., LOSTAO M.P., PANAYOTOVA-HEIERMANN M., LOO D.D.F., WRIGHT E.M. Kinetic and specificity differences between rat, human and rabbit Na+-glucose cotransporters (SGLT1) Am. J. Physiol. 1996;270:G919–G926. doi: 10.1152/ajpgi.1996.270.6.G919. [DOI] [PubMed] [Google Scholar]
- KNUTSEN L.J., ANDERSEN K.E., LAU J., LUNDT B.F., HENRY R.F., MORTON H.E., NAERUM L., PETERSEN H., STEPHENSEN H., SUZDAK P.D., KNUTSEN L.J.S. Synthesis of novel GABA uptake inhibitors. 3. Diaryloxime and diarylvinyl ether derivatives of nipecotic acid and guvacine as anticonvulsant agents. J. Med. Chem. 1999;42:3447–3462. doi: 10.1021/jm981027k. [DOI] [PubMed] [Google Scholar]
- LANDAU B.R., BERNSTEIN L., WILSON T.H. Hexose transport by hamster intestine in vitro. Am. J. Physiol. 1962;203:237–240. doi: 10.1152/ajplegacy.1962.203.2.237. [DOI] [PubMed] [Google Scholar]
- LOO D.D.F., ESKANDARI S., BOORER K.J., SARKAR H.K., WRIGHT E.M. Role of Cl− in electrogenic Na+-coupled cotransporters GAT1 and SGLT1. J. Biol. Chem. 2000;275:37414–37422. doi: 10.1074/jbc.M007241200. [DOI] [PubMed] [Google Scholar]
- LOO D.D.F., HAZAMA A., SUPPLISSON S., TURK E., WRIGHT E.M. Relaxation kinetics of the Na+/glucose cotransporter. Proc. Natl. Acad. Sci. U.S.A. 1993;90:5767–5771. doi: 10.1073/pnas.90.12.5767. [DOI] [PMC free article] [PubMed] [Google Scholar]
- LOO D.D.F., HIRAYAMA B.A., GALLARDO E.M., LAM J.T., TURK E., WRIGHT E.M. Conformational changes couple Na+ and glucose transport. Proc. Natl. Acad. Sci. U.S.A. 1998;95:7789–7794. doi: 10.1073/pnas.95.13.7789. [DOI] [PMC free article] [PubMed] [Google Scholar]
- LOSTAO M.P., HIRAYAMA B.A., LOO D.D.F., WRIGHT E.M. Phenylglucosides and the Na+/glucose cotransporter (SGLT1): Analysis of interactions. J. Membrane Biol. 1994;142:161–170. doi: 10.1007/BF00234938. [DOI] [PubMed] [Google Scholar]
- MACKENZIE B., LOO D.D.F., WRIGHT E.M. Relationships between Na+/glucose cotransporter (SGLT1) currents and fluxes. J. Membrane Biol. 1998;162:101–106. doi: 10.1007/s002329900347. [DOI] [PubMed] [Google Scholar]
- MAGER S., NAEVE J., QUICK M., LABARCA C., DAVIDSON N., LESTER H.A. Steady states, charge movements, and rates for a cloned GABA transporter expressed in Xenopus oocytes. Neuron. 1993;10:177–188. doi: 10.1016/0896-6273(93)90309-f. [DOI] [PubMed] [Google Scholar]
- NAKASHITA M., SASAKI K., SAKAI N., SAITO N. Effects of tricyclic and tetracyclic antidepressants on the three subtypes of GABA transporter. Neurosci. Res. 1997;29:87–91. doi: 10.1016/s0168-0102(97)00072-2. [DOI] [PubMed] [Google Scholar]
- N'GOKA V., SCHLEWER G., LINGET G.-M., CHABON J.-P., WERMUTH C.-G. GABA uptake inhibitors: Construction of a general pharmacophore model and successful prediction of a new representative. J. Med. Chem. 1991;34:2547–2557. doi: 10.1021/jm00112a032. [DOI] [PubMed] [Google Scholar]
- PAJOR A.M., HIRAYAMA B.A., LOO D.D.F. Sodium and lithium interactions with the Na+/dicarboxylate cotransporter. J. Biol. Chem. 1998;273:18923–18929. doi: 10.1074/jbc.273.30.18923. [DOI] [PubMed] [Google Scholar]
- PANAYOTOVA-HEIERMANN M., ESKANDARI S., TURK E., ZAMPIGHI G.A., WRIGHT E.M. Five transmembrane helices form the sugar pathway through the Na+/glucose cotransporter. J. Biol. Chem. 1997;272:20324–20327. doi: 10.1074/jbc.272.33.20324. [DOI] [PubMed] [Google Scholar]
- PARENT L., SUPPLISSON S., LOO D.D.F., WRIGHT E.M. Electrogenic properties of the cloned Na+/glucose cotransporter: I. Voltage-clamp studies. J. Membrane Biol. 1992a;125:49–62. doi: 10.1007/BF00235797. [DOI] [PubMed] [Google Scholar]
- PARENT L., SUPPLISSON S., LOO D.D.F., WRIGHT E.M. Electrogenic properties of the cloned Na+/glucose cotransporter II. A transport model under nonrapid equilibrium conditions. J. Membrane Biol. 1992b;125:63–79. doi: 10.1007/BF00235798. [DOI] [PubMed] [Google Scholar]
- SEGAL I.H. Enzyme Kinetics. New York, N.Y.: Wiley-Interscience; 1975. p. p 105. [Google Scholar]
- SU A., MAGER S., MAYO S.L., LESTER H.A. A multi-substrate single-file model for ion-coupled transporters. Biophysical J. 1996;70:762–777. doi: 10.1016/S0006-3495(96)79616-9. [DOI] [PMC free article] [PubMed] [Google Scholar]
- TURK E., WRIGHT E.M. Membrane topology motifs in the SGLT cotransporter family. J. Membrane Biol. 1997;159:1–20. doi: 10.1007/s002329900264. [DOI] [PubMed] [Google Scholar]
- WIELERT-BADT S., LIN J.T., LORENZ M., FRITZ S., KINNE R.K. Probing the conformation of the sugar transport inhibitor phlorizin by 2D-NMR, molecular dynamics studies, and pharmacophore analysis. J. Med. Chem. 2000;43:1692–1698. doi: 10.1021/jm9905460. [DOI] [PubMed] [Google Scholar]


