

Abstract
Nitroglycerin (GTN), often used in conditions of cardiovascular ischaemia, acts through the liberation of nitric oxide (NO) and the local concentration of NO in the tissue is responsible for any biological effect. However, little is known about the way in which the concentration of NO from GTN and other NO-donors is influenced by low oxygen tension in the target tissues.
To evaluate the impact of changes in oxygen tension in the metabolism of NO-donors we measured exhaled NO in anaesthetized rabbits in vivo and expired NO and perfusate nitrite (NO2−) in buffer-perfused lungs in situ. The impact of acute hypoxia on NO formation from GTN, isosorbide-5-mononitrate (ISMN), dissolved authentic NO, NO2− and NO generated from endogenous NO-synthase (NOS) was studied in either model.
Acute hypoxia drastically increased exhaled NO concentrations from all NO-donors studied, both in vivo and in the perfused lung. During similar conditions endogenous NO generation from NOS was strongly inhibited. The effects were most pronounced at less than 3% inspired oxygen.
The mechanisms for the increased NO-formation during hypoxia seems to differ between GTN- and NO2−-derived NO. The former phenomenon is likely due to diminished breakdown of NO.
In conclusion, hypoxic conditions preserve very high local NO concentrations generated from organic nitrates in vivo and we suggest that this might benefit preferential vasodilation in ischaemic tissue regions. Our findings point out the necessity to consider the influence of oxygen tension when studying the action of NO-donors.
Keywords: Nitroglycerin, exhaled NO, ischaemia, hypoxia, pulmonary vascular resistance, nitrovasodilators, organic nitrates, nitrite, perfused lung, nitroglycerin tolerance
Introduction
During the past decade nitric oxide (NO) has been recognized to be of importance in several biological systems and we now know that specific enzymes have evolved which are responsible for endogenous NO production in mammalian cells (Ignarro, 2000; Stuehr, 1999). Even non-enzymatic NO generation through the reduction of nitrite ions (NO2−) has been demonstrated (Weitzberg & Lundberg, 1998).
The biological effect of NO is dependent of the concentration at the site of action (Moncada & Higgs, 1993). This in turn is the integral of production and elimination. The production of NO is to a certain extent dependent on the oxygen tension because of the oxidation of the guanidino nitrogen in arginine is a reaction that requires molecular oxygen (Leone et al., 1991). Thus, under hypoxic conditions the endogenous, L-arginine dependent NO synthesis may be impaired (Ide et al., 1999). Even the generation of ‘exogenous' NO from different NO-donors is likely to be sensitive to alterations in tissue PO2. For example nitroglycerin (GTN) and related compounds have been suggested to be metabolized to NO by cytochrome p450 enzymes the activity of which are influenced by the oxygen tension (Minamiyama et al., 1999; Servent et al., 1989).
Reactive oxygen-derived species are major determinants of NO breakdown and their effect on NO concentration is dependent on the availability of different antioxidants (Kelm, 1999), and it is thus reasonable to assume that also the NO elimination is dependent on oxygen tension. As a consequence of the diverse chemistry of nitric oxide metabolism it is very difficult to estimate the actual tissue concentration of the molecule in different organs in vivo, especially during conditions under which normal homeostasis is disturbed. Nitric oxide measurement is also complicated by the fact that several of the current techniques to measure NO generation are indirect (measures metabolites of NO, e.g. NO2− or nitrate (NO3−), rather than NO itself) or estimate only the total amount of NO production (i.e. spin trap techniques or citrulline assay). Furthermore, NO measurement is complicated by changes in pH, temperature and interference from NO scavenging substances, i.e. haemoglobin (Adding et al., 1999; Carlin et al., 1997b). However, one organ, the lung, offers the unique possibility to measure changes in the net concentration of NO directly in vivo even during rapid changes of tissue homeostasis. This is due to the relative stability of NO in the gaseous phase (where NO can be measured by chemiluminescence) and that gas-phase NO is a reflection of the NO within the tissue (Gustafsson et al., 1991). In the lung model NO can also be measured in increased amounts during administration of NO donors (Agvald et al., 1999; Persson et al., 1994a). When investigating how hypoxia influenced the expired NO concentrations we made the somewhat surprising observation that the exhaled NO drastically increased during hypoxia in animals that were medicated with GTN. The aim of this study was to characterize this finding to its magnitude, mechanism and functional importance, and to address the question whether it is a general phenomenon for several kinds of NO-donors or solely attributable to GTN. Since hypoxia in vivo has profound effects on the pulmonary circulation, effects that per se might affect the exhaled NO, we also performed control experiments with constant flow buffer-perfused lungs in situ.
Nitrite (NO2−) is a metabolite of organic nitrates (Kurz et al., 1993), and ascorbic acid has been shown to enhance the NO generation from NO2− (Weitzberg & Lundberg, 1998). Ascorbic acid has also been suggested to counteract nitrite tolerance (Bassenge et al., 1998; Yeates & Schmid, 1992). Therefore, the increase of NO from GTN during hypoxia might be due to increased indirect metabolism of GTN through the conversion of NO2− to NO. To evaluate this possibility we infused increasing concentrations of inorganic NO2− and NO3− in buffer-perfused lungs during normoxic and hypoxic conditions, and examined the effect of adding ascorbic acid during GTN and NO2− infusions. We thus hypothesized that if the mechanism for increase of GTN-derived NO during hypoxia was via increased conversion of NO2− to NO it should be potentiated by ascorbic acid.
Methods
Anaesthezia and initial surgical procedures
The local animal ethics committee approved the experiments. Male New Zealand white rabbits (2–3 kg body weight) were anaesthetized with pentobarbitone sodium (40–60 mg kg−1 body weight) via an ear vein, and were placed in a supine position, tracheotomized and ventilated by a Harvard Apparatus rodent ventilator (model 683, Harvard Apparatus, South Natick, Massachusetts, U.S.A.). The ventilator was supplied with a mixture of N2, CO2 and O2. The O2 and CO2 content of the gas mixture was controlled by means of precision mass flow controllers (Bronkhorst, Ruurlo, Holland) which could be adjusted to yield CO2 concentrations from 0–5.5% and O2 concentrations from 0–100%, the NO content of the gas mixture was always below our detection limit (1.0 p.p.b.). During the induction and surgical procedures the gas mixture was set to yield N2=70%, O2=30% and CO2=0% in the inspired gas. The inspiratory concentrations of O2 and CO2 were recorded by a ventilatory monitor (Oscar-Oxy, Datex, Helsinki, Finland) connected to the tracheal cannula, sampling at 150 ml min−1. Ventilation rate was 40 min−1 and the tidal volume was adjusted to keep end-tidal CO2 at 4.5–5.3%, resulting in a minute ventilation of 0.64–0.96 l min−1, and approximately 15–20% of the minute ventilation being sampled by the Oscar-Oxy. The gas from the ventilator outlet was led through a beaker with water creating a positive end-expiratory pressure (PEEP) set at 1–2 or 4–5 cm H2O for the in vivo and in situ experiments respectively (see below). A pressure transducer connected to a side arm of the tracheal cannula recorded the insufflation pressure (Statham, Hato Rey, Puerto Rico).
Nitric oxide measurements in expired gas
NO concentration was continuously monitored breath-by-breath by means of chemiluminescence measurement on exhaled gas (Adding et al., 1999), using a sample flow rate of 40 ml min−1 through a restrictor placed at the tracheal tube y-piece. Thus, less than 5% of the minute ventilation was sampled. Detection limit was 1.0 p.p.b. and response time (T10–90) was 0.35 s, and at the given respiratory rate of 40 min−1 stable NO concentration plateaus were recorded during expiration. Calibration was made using certified NO standard gas in nitrogen (AGA Specialgas, Lidingö, Sweden). The NO concentration in inhaled and exhaled gas was, together with haemodynamic parameters, continuously recorded on a Grass model 7 Polygraph (Grass Instruments, Quincy, MA, U.S.A.).
Experimental protocol
In vivo experiments
The animals were prepared as described above and polyethene catheters were inserted in the right femoral artery and the left jugular vein for recordings of mean arterial blood pressure, heart rate, sampling of blood gases and administration of drugs. The blood gas samples were analysed in a Radiometer ABL 300 acid base laboratory blood gas analyzer (Radiometer, Copenhagen, Denmark). A continuous infusion of glucose (27.5 g l−1), dextran 70 (Macrodex® 28 g l−1), NaHCO3 (7 g l−1) and pentobarbitone sodium (4.8 g l−1) was administered intravenously at a rate of 5 ml kg−1 h−1 by means of an infusion pump (Terumo STC-521, Terumo Inc., Tokyo, Japan). Body temperature, measured rectally, was maintained at 37–38°C by means of a heating pad connected to a thermostat (Heater control LB 700, PRODAB, Uppsala, Sweden). The animals were paralysed by injection of pancuronium bromide (1 mg kg−1 bolus, thereafter 0.5 mg kg−1 h−1). After completion of the instrumentation an arterial blood gas sample was taken, ventilator settings were adjusted and NaHCO3 (0.6 M) was given to maintain blood gases at: pH 7.35–7.45, PCO2 4.5–5.3 kPa, PO2>13 kPa and base excess at 1 to −3 mmol l−1. Hereafter the animals were allowed a 30 min intervention-free period to obtain stable circulatory conditions and stable concentrations of exhaled NO.
The animals were divided into three groups. In group 1 (n=5) the endogenous enzyme-dependent (NOS) NO production was studied whereas the animals in group 2 and 3 received the NO synthase inhibitor (L-NAME, 30 mg kg−1, i.v.). Thirty minutes after the L-NAME infusion continuous infusion of either GTN 0.03 mg kg−1 min−1 (group 2, n=6) or isosorbide-5-mononitrate (ISMN) 0.3 mg kg−1 min−1 (group 3, n=5) was started. All three groups of animals were exposed to repeated airway hypoxias with increasing severity for 1.5 min each. During the hypoxias the fraction of inspired oxygen (FIO2) was quickly reduced to yield 10, 5, 3, 1 and 0 per cent in the inspired air. Each hypoxia was only done once and the animals were allowed to stabilize between each hypoxia with normoxic conditions (FIO2 25%). Blood gases were controlled before the start of each hypoxia and after 1 min of hypoxia. After each hypoxia acid-base balance was corrected by adjustments of the ventilator settings and infusions of NaHCO3 0.6 M to obtain blood gases within the normal range (see above). The NO concentration before each hypoxia was taken as control and compared to the maximal change of NO during the subsequent hypoxia.
Perfusion experiments in situ
The rabbits were prepared as described above, the thorax was opened in the midline and the anticoagulant heparin was given i.v. at 1000 IU kg−1 body weight. The lungs were perfused in situ in non-recirculating mode at constant rate (set at 50–65 ml min−1) via the common pulmonary artery by means of a peristaltic pump as previously described (Adding et al., 1999). The buffer perfusate contained (mM); NaCl 125, KCl 4.3, CaCl2 2.4, MgCl2 1.3, NaH2PO4 1.2, glucose 8.3, and NaHCO3 35 and bubbled with 7% CO2 in N2 at 37°C. Pressures in the pulmonary artery (PAP) and the left atrium (LAP) were measured in side arms of the perfusion catheters by means of small saline-filled catheters connected to pressure transducers (Statham). Pulmonary vascular resistance (PVR) was calculated as PAP-LAP/Q, where Q=perfusate flow rate through the lungs per min. Immediately after the onset of the perfusion CO2 in the inspired air was set to 5% and perfusate gas and acid base status was determined. If necessary, the inspiratory CO2 concentration was adjusted (FICO2 4.5–5.3%) to yield a perfusate pH after the lung of 7.35–7.45. The FICO2 was then kept at the same level for the rest of the experiment.
After completion of the perfusion set-up the FIO2 was reduced to 21% and the lungs were allowed to rest until stable concentrations of exhaled NO and pulmonary artery pressure were obtained. The animals were divided into four groups (group 4–7). In group 4 (n=5) the endogenous NO production was studied whereas the animals in group 5, 6 and 7 received the NO synthase inhibitor (L-NAME, 50 mg l−1 (185 μM) in the perfusate). In group 5 (n=4) PVR in the absence of both endogenous and exogenous NO was studied. In groups 6 and 7 continuous infusions of either GTN (group 6, n=5) 0.3 mg l−1 or authentic NO (a 1 : 10 dilution of saturated NO gas in deoxygenated (N2) water) 1.5–3 ml l−1 (group 7, n=5) were started 15 min after the L-NAME infusion. Drugs were administered using a micro infusion pump (CMA 100, Carnegie Medicine, Stockholm, Sweden) via a side arm in the pulmonary artery catheter. The NO solution was given from a gas-tight syringe connected to the perfusion circuit just before the pulmonary artery catheter (for preparation of NO solution see below). As soon as stable exhaled NO concentrations had been achieved all four groups were exposed to repeated hypoxias (5 min each) with increasing severity. During the hypoxias O2 was quickly reduced to yield FIO2 10, 5, 3, 1 and 0%, inspired CO2 maintained at original setting (see above). Each hypoxia was only done once and the animals were allowed to stabilize 5 min between each hypoxia with FIO2 21%. Perfusate gas and acid base status was determined before and 2 min after the onset of each hypoxia.
Measurement of nitrite in perfusate
In a subset of in situ-perfused lung preparations infused with GTN (n=4) or authentic NO (n=3) the NO2− concentration in perfusate was measured before and after 5 min of hypoxia. Perfusate samples (1.5 ml) were collected before and after the lung and aliquots of 0.1–1.0 ml were injected into a reaction vessel containing 100 ml deoxygenated sodium iodide (1%) in concentrated hot acetic acid (Walters et al., 1987), conditions which were found not yielding any significant conversion of GTN to NO (data not shown). Nitrite was thus specifically reduced to NO in the reaction vessel and carried by a stream of N2 into a chemiluminescence NO analyzer for quantification (Palmer et al., 1987; Walters et al., 1987). Calibration was made with freshly prepared aliquots of NaNO2 to construct standard curves for calculation of unknown samples (Wiklund et al., 1993). The net amount of NO2− generated in the lungs was determined as NO2− content in samples collected after the lung minus NO2− content in the perfusate before the lungs. All samples were taken in triplicate and the NO2− concentrations were calculated as mean of the three samples.
Study of NO generation from nitrite and nitrate
In order to evaluate the possibility that increase in NO levels during hypoxia in the animals with concomitant infusion of NO-donors could be due to conversion of NO2− or NO3− to NO, another set of experiments was done. In buffer perfused lungs endogenous (enzyme (NOS) dependent) NO production was blocked (L-NAME 50 mg l−1) and nitrite (n=3) or nitrate (n=3) were infused continuously with increasing concentrations. Nitric oxide in exhaled gas was measured during both normoxia and severe hypoxia (FIO2=0%). In three animals we also compared the effect of 0.5 mM ascorbic acid on NO-generation from NO2− (1 mM) and GTN (0.3 mg l−1), respectively.
Drugs
L-NAME (NG-nitro-L-arginine methyl ester) was purchased from Sigma Chemical Company, St Louis, Missouri, U.S.A., heparin from Kabi Vitrum, Stockholm, Sweden, pancuronium bromide (Pavulon®) from Organon, Oss, Holland, pentobarbitone from Apoteksbolaget, Stockholm, Sweden, dextran 70 (Macrodex®) from Pharmacia Infusion, Uppsala, Sweden. Nitroglycerin (Perlinganit®) and isosorbide mononitrate were a generous gift from Schwartz Pharma, Monheim, Germany. The buffer solutions were prepared from ultra filtrated water (18.2 MΩ resistance after passage through DQ-filter, Millipore, Bedford, MA, U.S.A.). NO solution was prepared in 300 ml glass cylinders, filled with 200 ml ultra filtrated water, and equipped with Teflon stop-cocks at each end and a sampling membrane (rubber-teflon gas chromatography style membrane) in a side port at 50% of the cylinder length. In the cylinder, the ultra filtrated water was deoxygenated (bubbled with He) for 30 min and thereafter equilibrated with NO gas for 2 min to yield a saturated NO solution (2 mM). The solution was then diluted (1 : 10) and stored in deoxygenated isotonic saline in similar gas tight glass cylinders, also with rubber-teflon membranes. From these appropriate amounts of NO-containing saline was drawn into glass syringes for infusion into the immediate afferent limb of the perfused lung preparation. The used infusion rates of NO solution were chosen as to approximately match the increase in expired NO caused by GTN infusions.
Statistics
Statistical data are given as mean and standard error of the mean. Statistical significance was examined by means of one way analysis of variance (ANOVA with Tukey post hoc analysis) or paired t-test, after testing for normal distribution of the data and accepting P<0.05 as conveying significance. Pearson's Product Movement Correlation was used to calculate correlations between NO generation from GTN and decrease in PVR.
Results
In vivo experiments
After induction of anaesthesia and surgical procedure blood pressure stabilized at 101±5 cm H2O and heart rate at 296±8 b.p.m., respectively. Endogenous tidal plateau NO concentration in exhaled gas was 29±1 p.p.b. (n=13). There were no significant differences in these parameters between the treatment groups.
During hypoxia NO in exhaled gas in the group with intact endogenous NO production (group 1) decreased with a rapid onset and remained depressed during the rest of the hypoxia (Figure 1). The decrease in NO was most pronounced with FIO2 <3% (Figure 2a). The corresponding changes in blood gases and exhaled CO2 are presented in Table 1. Administration of L-NAME i.v. essentially abolished exhaled endogenous NO, exhaled NO 10 min after finished L-NAME infusion being 1.7±0.1 p.p.b. During infusion of GTN or ISMN reproducible increments in exhaled NO were observed, GTN being the most potent, and exhibiting a time-course with an initial peak followed by a plateau (Figure 1) as previously described (Agvald et al., 1999; Persson et al., 1994).
Figure 1.
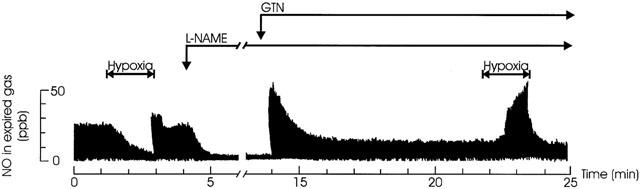
Effect of hypoxia on endogenous and NO-donor formatted expired NO in vivo. Original tracings of NO in exhaled gas of artificially ventilated anaesthetized rabbits. In following order, the effect of severe hypoxia (FIO2=0%, 1.5 min) on the endogenous L-arginine dependent NO production, the effect of L-NAME (30 mg kg−1 i.v.) on the endogenous L-arginine dependent NO production, the NO production from a subsequent infusion of GTN (0.03 mg kg−1 min−1) and the effect of severe hypoxia (FIO2=0%, 1.5 min) on the NO originating from the GTN infusion.
Figure 2.
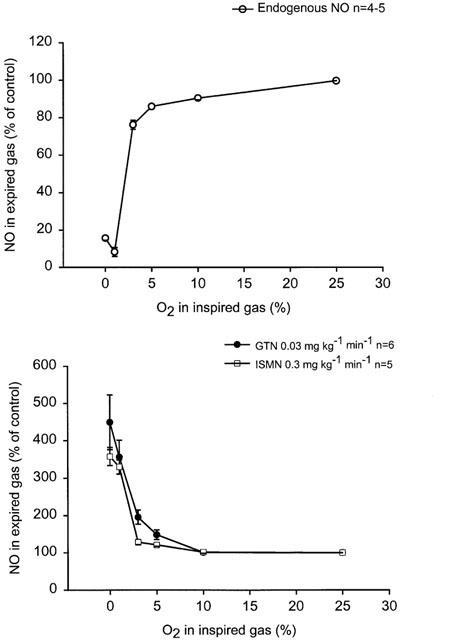
(a+b) Dose-response curves for FIO2 on expired NO in anaesthetized artificially ventilated rabbits. Effects of 1.5 min of hypoxia (FIO2 10, 5, 3, 1, and 0% respectively) on (a) endogenous (L-arginine dependent) NO production and (b) NO-from GTN or ISMN in animals with blocked endogenous NO production (L-NAME 30 mg kg−1).
Table 1.
Cardiovascular and respiratory parameters in anaesthetized rabbits before and during hypoxic challenge
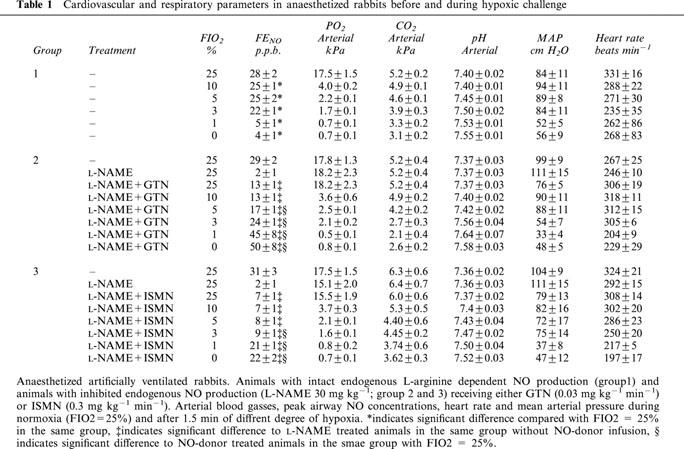
During administration of NO-donors (group 2 and 3), the hypoxias caused NO to gradually increase yielding maximal concentration at the end of each 1.5 min hypoxia (Figures 1 and 2b). The increase of NO from GTN and ISMN was most pronounced with FIO2 <3% (Figure 2b). There was no significant difference between GTN and ISMN with regard to increases in NO when given as relative increase from control levels during normoxia (Figure 2b). There were no significant differences in blood gases between the different groups during the hypoxias (Table 1). There was a tendency to a larger decrease in MAP and HR at the end of hypoxia in the groups receiving NO-donors as compared with the group with intact endogenous NO production, however this tendency did not reach statistical significance (Table 1).
Lung perfusion experiments in situ
When stable conditions had been achieved after the start of perfusion of lungs, endogenous tidal NO concentration in exhaled air was 70±4 p.p.b., PAP was 13±3 cm H2O and PVR was 0.0716±0.0179 cm H2O ml−1. There was no significant difference in the initial values between the different groups. In the group with intact endogenous NO production (group 4) NO in exhaled gas from perfused lungs decreased during the hypoxias with a rapid onset and remained lowered during the rest of the hypoxia (Figure 3a). After hypoxic periods with FIO2 ⩽3% the exhaled NO levels returned to control values in a biphasic manner, exhibiting an initial rapid increase with a transient overshoot (10–20 s) compared to control values, followed by a short period of inhibited NO production that gradually returned to baseline values (Figure 3a). As with the in vivo experiments the decrease in NO was most pronounced with FIO2 <3% (Figure 4a). The hypoxias also induced increases in PVR (Figure 4b).
Figure 3.
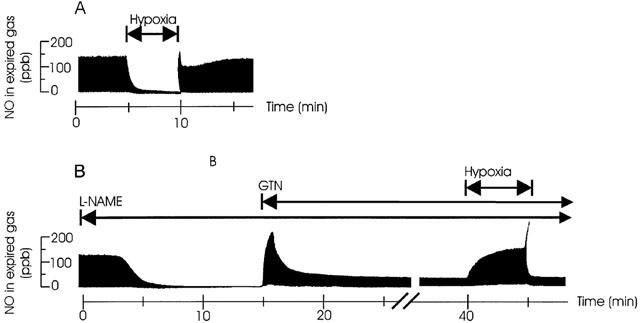
(a+b) Effect of hypoxia on endogenous- and NO-donor formatted expired NO. Original tracings of NO in expired gas of artificially ventilated buffer perfused rabbits lungs in situ. (a) The effect of severe hypoxia (FIO2=0%, 5 min) on the endogenous L-arginine dependent NO production. (b) The effect of L-NAME (50 mg l−1 in perfusate) on L-arginine dependent NO production, the NO production from a subsequent infusion of GTN (0.3 mg l−1) and the effect of severe hypoxia (FIO2=0%, 5 min) on the NO originating from the GTN infusion.
Figure 4.
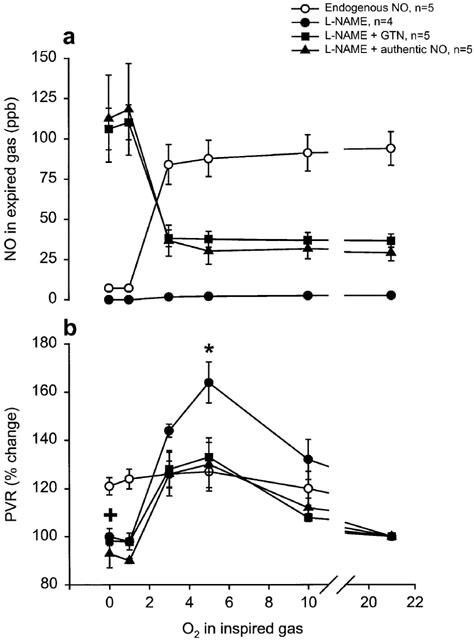
(a+b) Artificially ventilated buffer-perfused rabbits lungs in situ. Dose-response curves for the effect of FIO2 on (a) expired NO, during normoxia or after 5 min of hypoxia (FIO2 10, 5, 3, 1, and 0%, respectively) and (b) change in PVR after 5 min hypoxia compared to controls just before start of hypoxia. Open symbols=lungs with intact endogenous L-arginine dependent NO production, filled symbols=lungs with blocked endogenous NO production (L-NAME 50 mg l−1 in perfusate). * indicates significant difference of one group compared to the control group, + indicates significant difference of all the groups compared to the control group.
In the three groups of perfused lungs receiving L-NAME (group 5–7) endogenous NO in exhaled gas rapidly decreased from 69±5 to control values of 4.5±1 just before start of the NO-donor infusion (Figure 3b). In group 5, receiving only treatment with NO synthase inhibitior, NO was 3±0.6 p.p.b. before the start of the first hypoxia and remained below that for the rest of the experiments. Upon start of GTN infusion (group 6) NO rapidly increased in exhaled gas and peaked after an average time of 2±0.1 min; thereafter the NO concentration decreased to a markedly lower plateau level and showed no significant difference when comparing the 10-min values with the 15-min values (Figures 3b and 5). The increase in exhaled NO correlated with the decrease in PVR (R=0,42; P<0.01). During the hypoxias, NO from GTN gradually increased (Figure 2b), yielding maximum concentrations at the end of hypoxias. The increase in NO was most pronounced with FIO2 <3% (Figure 4a). Upon start of authentic NO infusion (group 7) NO increased steadily to a constant level, no peak and plateau pattern was observed. In this group hypoxias elicited increases in NO in a similar manner as in the GTN infusion experiments (group 6). In fact, there was no significant difference in the NO increase during hypoxia between group 6 and 7 (Figure 4a).
Figure 5.
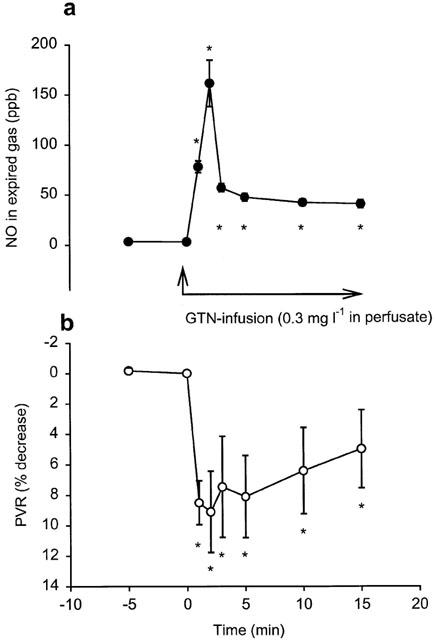
(a+b) Artificially ventilated buffer-perfused rabbits lungs in situ. Continuous GTN-infusion (0.3 mg l−1 in perfusate) in lungs with blocked endogenous L-arginine dependent NO formation (L-NAME 50 mg l−1 in perfusate). Time course of changes in (a) exhaled NO and (b) PVR. * indicates a significant difference compared with the control value (time 0). n=5.
During hypoxias with FIO2 ⩾3% there was a marked increase in PVR in all groups lasting throughout the 5 min of hypoxic challenge. During hypoxia with FIO2 3% the group with blocked NO-synthesis and without any NO-donating substance (group 5) had more pronounced increase in PVR compared to the other groups, this difference in PVR increase was significant (P<0.05) for the 5% hypoxia. For hypoxia ⩽3% there was only a transient increase in PVR that returned to control or below control values at the end of the hypoxia in all groups except in the group with intact endogenous NO production (group 4) where even the severe hypoxias produced a maintained increase in PVR (Figure 4b).
Nitrite in perfusate from perfused lungs
Perfusate concentrations of nitrite measured before the lungs, in the absence or presence of L-NAME, were 40±22 nM and 41±22 nM respectively. The additional nitrite contribution from the lungs during intact endogenous NO production was 17±1 nM and in the presence of L-NAME it was 14±7 nM, an insignificant change (P>0.05). However, upon 15 min of continuous GTN-infusion there was a significant elevation of the nitrite generation from the lungs with a net increase in the perfusate nitrite to 1.3±0.04 μM and there was a significant further increase to 1.5±0.04 μM after 5 min of hypoxia with FIO2=0%. Infusion of NO-solution resulted in similar increase in nitrite levels in the perfusate after the lungs (1.3±0.5 μM), an efflux which tended to increase further (to 1.7±0.9 μM) after 5 min of hypoxia, the latter effect however not reaching statistical significance.
NO generation from nitrite and nitrate
Upon infusion of inorganic nitrite, elevations of exhaled NO was seen in perfused lungs. Inorganic nitrate infusions up to 3 mM elicited no such effect. During normoxic conditions NO-generation from infused nitrite were only detectable in exhaled gas at the highest doses tested, 1 and 3 mM (Figure 6). However, during the hypoxias elevation in exhaled NO was detected already at 100 μM nitrite and with increasing nitrite concentrations the NO levels widely exceeded those normally measured from untreated lungs in vivo or in vitro (Figure 7; see also Figures 1, 3 and 4a). The NO generation from nitrite gradually increased during the hypoxias and after 5 min the NO levels were still rising. During the hypoxias PO2 in the perfusate from the lung fell from 19.4±0.9 to 4.4±0.9 kPa whereas pH and PCO2 remained unchanged at 7.43±0.01 and 5.19±0.1 kPa respectively.
Figure 6.
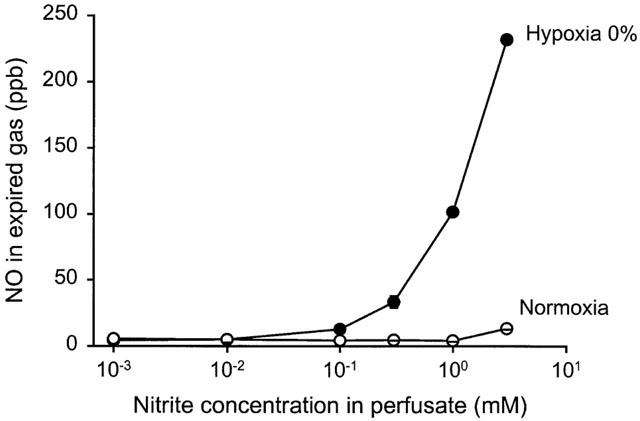
Dose-response curve of NO formation from nitrite in artificially ventilated buffer perfused rabbit lungs in situ with blocked endogenous L-arginine dependent NO formation (L-NAME 50 mg l−1 in perfusate). Measurement of exhaled NO during infusions increasing concentrations of inorganic nitrite, during normoxia (FIO2=21%) and after 5 min of hypoxia (FIO2=0%). n=3.
Ascorbic acid, without affecting pH in the perfusate, significantly increased the NO generation from nitrite as measured in expired air during hypoxia (by 54±14% compared to control). This was contrary to the effect of ascorbic acid treatment on the NO formation from GTN, which was significantly inhibited by 40±7% compared to control.
Discussion
Major findings
The present study demonstrates the dual action of hypoxia on NO metabolism in vivo: The NO levels in vivo from the NO-donors GTN and ISMN drastically increase (>300%) with oxygen tensions <3% whereas endogenous NO production from the NOS dependent oxidation of L-arginine is decreased and approaches zero during the same conditions. We also demonstrate that NO can be formed in the lung through the reduction of nitrite and that this can occur with normal physiological pH in the perfusate surrounding the lung cells and does not seem to require the presence of any haematological component in the blood. During normoxia, NO generation from inorganic nitrite occurs only at very high concentrations of nitrite, thus questioning the physiological importance of this effect.
The model
The model has previously been widely studied by others and by ourselves (Adding et al., 1999; Agvald et al., 1999; Persson et al., 1994). The measurement system allows an accurate on-line detection of the NO generated, and the temporal resolution is sufficiently high to detect changes in the NO concentration breath-by-breath (Adding et al., 1999). Nitric oxide produced in the body is continuously being degraded and the NO measured in the exhaled gas is the net amount of formation and inactivation in the lung. Thus, NO measured in exhaled gas gives a picture of the NO that actually reaches the cells, that is, is active in vivo in the lung. The chemiluminescence technique to measure exhaled NO is in itself insensitive to changes in the tissue homeostasis, i.e. changes in pH or temperature, which could be a problem with other direct methods of measuring NO (Archer, 1993).
The isolated buffer-perfused lungs make it possible to eliminate haemoglobin, which rapidly scavenges part of the NO molecules in the in vivo situation and thereby confounds NO measurements (Carlin et al., 1997b), and also enabled us to use dissolved authentic NO. Furthermore, by using an experimental set-up in which the buffer perfusate is not recirculated we can rule out the possibility that accumulation of mediators, that are released by the lungs into the circulation during hypoxia, is responsible for the observed effects.
Endogenous NO
Endogenous NO formed from L-arginine can been detected in exhaled air of humans and animals (Gustafsson et al., 1991) and NOS has been histologically demonstrated in the broncho-alveolar epithelial cells, vascular endothelium (Asano et al., 1994; Kobzik et al., 1993; Shaul et al., 1994) as well as in alveolar macrophages. It has been shown that NOS-inhibitors have marked effects on pulmonary vascular resistance and on hypoxic vasoconstriction both in vivo and in vitro (Archer et al., 1989; Persson et al., 1990, 1994b). However, it is still open to debate whether the role of NO is to counterbalance hypoxic vasoconstriction or to maintain perfusion in hypoxic lung regions (Gustafsson, 1997). Accordingly, the relationship between PO2 and NO synthesis in the lung is still controversial (Gustafsson et al., 1991; Hampl & Archer, 1997; Hampl et al., 1995). Our study shows a drastic inhibition by severe (FIO2 ⩽3%) hypoxia on endogenous NO generation both in vivo and in vitro. The result is in line with earlier studies in rabbits of both acute and chronic effects of hypoxia (Carlin et al., 1997a; Ide et al., 1999; Nelin et al., 1996), apart from the fact that our experimental set-up reveals a more pronounced inhibition during severe hypoxia than previously reported. This may be due to more effectively controlled hypoxia and, in the perfusion experiments, that we do not recirculate the buffer perfusate.
Since major effects of hypoxia on NO-metabolism are only seen at very low oxygen concentrations, a physiological role for this phenomenon might thus seem unrealistic. However, one has to bear in mind that the NO we measure is mainly attributed to the cells lining the respiratory tract (Persson et al., 1993; Sartori et al., 1999), which means that the production sites are in direct vicinity of airway gas. Thus, there is a short oxygen gradient and the site of production has almost the same oxygen concentration as the airway lumen. In contrast to that, NO production sites in lung tissue, myocardium or other systemic tissues may be more distant from vessels with oxygenated blood and there is also a large O2 sink at the interface between blood and tissue (Tsai et al., 1998). For example, in the liver during shock the tissue PO2 is only half of that of hepatic venous blood, and may only amount to 1.3 kPa (Soller et al., 2001), which corresponds to the lowest O2 concentrations used in our study. Thus, in the systemic circulation the oxygen concentration at the site of NO production may reach nadirs where endogenous production is decreased already at ‘physiological' PO2 in the blood, and certainly during ischaemic conditions. Therefore, the possibility of ischaemia-hypoxia induced increase in NO production from NO-donors as a counterbalancing mechanism seems highly relevant (Zhang et al., 1998).
The observation of the very potent inhibition of the endogenous NO-synthesis with inspired oxygen (FIO2) <3% fits well with the hypothesis that NO has a servo function in the regulation of the pulmonary blood flow (Persson et al., 1990). It seems physiologically relevant that blood flow is promoted by NO generation in regions exhibiting good oxygenation or at least an oxygenation level compatible with life. However, when the oxygen content falls below the limit where the blood can be oxygenated the NO production and thereby blood flow are turned off.
NO-donors
As far as we know this is the first account of direct measurement of NO generation from GTN in the buffer perfused lung. The peak and plateau profile of exhaled NO during GTN infusion confirms earlier in vivo data showing the peak and plateau profile with GTN and isosorbide dinitrate (ISDN), but not with 3-morpholino-sydnonimine (SIN-1) (Agvald et al., 1999; Persson et al., 1994a). The finding of this profile under the constant flow conditions of the perfused lung makes it highly unlikely that the pattern could be due to altered haemodynamics. Furthermore it excludes the possibility that the NO generated could by itself induce NO scavengers since we observed that infusions of NO-solution did not give rise to any peak-plateau pattern. Thus, the peak and plateau pattern must be due to a phenomenon inherent in the mechanism for NO generation from especially GTN and ISDN. The pattern implies that the NO generation from these compounds is quite different from that of e.g. SIN-1, a compound which does not show cross-tachyphylaxis with GTN (Agvald et al., 1999) and does not show enhanced NO generation during hypoxia (unpublished data). Since NADH concentrations may be maintained or increased during hypoxia (Millar et al., 1998), an NADH-utilizing enzyme might be considered responsible for NO generation from GTN, and a relative lack of NADH might be a possible explanation for the decrease towards plateau, after the initial peak during relatively high GTN infusion rates in normoxia.
Several enzyme systems able of producing NO from GTN have been described (Servent et al., 1989; Yeates et al., 1989). One system is cytochrome p450 enzymes (Minamiyama et al., 1999; Servent et al., 1989), which per se are influenced by the oxygen tension. Another system, xanthine oxidoreductase (XOR), has been shown to catalyse the reduction of GTN, as well as inorganic nitrate and nitrite, to NO under hypoxic conditions in the presence of NADH (Millar et al., 1998; Zhang et al., 1998). Our finding of drastic increase in NO generated from NO-donors during hypoxia allows several alternative interpretations: (1) Enhanced direct metabolism of the organic nitrates to NO by enzyme systems such as XOR, activated during hypoxia (Millar et al., 1998; Zhang et al., 1998). However, the increase in NO observed by us during hypoxia was of the same magnitude regardless if it originated from the metabolism of organic nitrates or from dissolved authentic NO. This finding argues in favour of more general changes in NO homeostasis rather than just an enhanced metabolism of organic nitrates. That we did not observe conversion of inorganic nitrate to NO is also in favour of a general effect on NO metabolism, rather than an effect on XOR; (2) Additional release of some kind of stored NO, such as NO bound to nitrosothiols. This however seems unlikely since the phenomenon was absent in the animals that did not receive any NO-donors; (3) Increased diffusion of NO from the buffer to the alveolar gas during the hypoxias. This would fit with evidence that the diffusion capacity for carbon monoxide (as indicator of the gas diffusion characteristics within the lung) is slightly increased during hypoxia (Ayappa et al., 1998). However, facilitated diffusion of NO into the alveolar space is unlikely to explain the increase in NO during hypoxia since the capillary transit time with the buffer-flow used (60 ml min−1 or about 25 ml kg−1 min−1) is more than five times that needed for a >99% equilibration of NO between buffer and alveolar gas even under normoxic conditions (Ayappa et al., 1996); (4) Enhanced indirect metabolism of the organic nitrates to NO by reduction of inorganic nitrite generated from the organic nitrates (Kurz et al., 1993). Our inorganic nitrite and nitrate experiments indeed illustrate that NO can be generated from nitrite during physiological pH within the lung, but the nitrite concentrations needed to achieve expired NO levels similar to those found in the perfusion experiments with NO-donors were about 100 times larger than the perfusate nitrite levels found by us during GTN infusions in perfused lungs. On the other hand we measured only the extracellular nitrite concentrations and the intracellular concentrations may well be considerably higher (knowing that GTN is metabolized intracellularly). Thus the increased NO generation from organic nitrates during hypoxia could to some extent be due to the conversion of nitrite to NO. However, the experiments with ascorbic acid clearly show that the mechanism for the increase of exogenous NO during hypoxia is not solely a conversion of nitrite to NO, since ascorbic acid had divergent effects on exhaled NO from nitrite and GTN respectively; and (5) Preservation of intact NO during hypoxia in vivo due to diminished breakdown of NO (e.g. due to decreased generation of NO-inactivating reactive oxygen species). With the above possibilities (1–4) unlikely or ruled out we suggest that this is the most likely mechanism for the increased NO concentrations during NO-donor infusion and hypoxia. One might argue that preservation of intact NO should entail diminished generation of the NO metabolite nitrite during hypoxia. However, the nitrite levels are dependent on both generation of nitrite and the conversion of nitrite to nitrate (Kelm, 1999), the latter process being oxygen dependent. The increased levels of nitrite in the perfusate during the hypoxias might therefore be the result of diminished conversion of nitrite to nitrate.
Possible implications of the dual effect of hypoxia in the cardiovascular system
This study gives new insight into the mechanisms of action of the organic nitrates that may explain the potency and efficacy of NO-donors in conditions with tissue ischaemia. Most importantly, our work points out the necessity to evaluate the impact of oxygen tension when studying the actions of NO-donors. For example, some compounds like SIN-1 (Feelisch et al., 1989) require O2 for release of NO and may therefore not exhibit a relative increase of NO formation in hypoxic regions. The principle illustrated in our study may also give new insight into the vessel-selective action of different organic nitrates in vivo (Harrison & Bates, 1993; Mülsch et al., 1995). Thus, the efficient preload reduction by classical organic nitrates has been accounted for by higher NO formation in venous capacitance vessels as compared to arterial conductance and resistance vessels (Mülsch et al., 1995). Applying our findings, this might in turn be partly dependent on the lower PO2 in the venous blood.
NO has complex effects in the heart and coronary circulation (Canty, 2000; Gattullo et al., 1999; Kitakaze et al., 1996; Zhao et al., 1999). In the heart, endothelium and cardiac myocytes are able to produce NO but gradually lose this capacity with ageing and vascular disease (Vanhoutte, 2000). It is likely that other sources of NO, lying more distant from the blood compartment (and hence more oxygen sensitive), then become increasingly important. Thus, the following scenario in ischaemic myocardium becomes feasible: Tissue hypoxia leads to inhibition of (already impaired) endogenous NO production. The consecutive vasoconstriction of supplying blood vessels creates a vicious circle. However, GTN or other NO-donors (that are not critically dependent on oxygen for their NO metabolism) can reach the hypoxic tissue and confer generation of very high NO concentrations (due to the diminished breakdown of the NO generated) thereby counteracting vasoconstriction.
Even with the above scenario, it is by no means certain that increased NO formation in ischaemic tissues is always beneficial. Thus, further studies are required to evaluate the impact of our findings during different conditions e.g. cerebrovascular- or cardiac ischaemia. We suspect that the dual action of hypoxia on the NO metabolism is of importance during both normal and pathophysiological conditions. In conclusion, we find that increased NO concentrations are obtained from organic nitrates during hypoxic conditions in vivo and suggest that this might evoke preferential vasodilation in ischaemic tissues regions.
Acknowledgments
We would like to thank Mr Armin Guhl for excellent technical assistance. This study was supported by the Swedish MRC (project 7919), the Swedish Heart-Lung Foundation, Gösta Fraenckel's Foundation, the Swedish Society for Medical Research, the Lars Hierta Memorial Foundation, Magnus Bergwall's Foundation and the Karolinska Institute.
Abbreviations
- FENO
fraction of expired NO
- FIO2
fraction of inspired oxygen
- GTN
nitroglycerin
- ISDN
isosorbide dinitrate
- ISMN
isosorbide-5-mononitrate
- LAP
left atrial pressure
- L-NAME
NG-nitro-L-arginine methyl ester
- NO3−
nitrate
- NO2−
nitrite
- NO
nitric oxide
- NOS
NO-synthase
- PAP
pulmonary artery pressure
- PEEP
positive end-expiratory pressure
- PVR
pulmonary vascular resistance
- SIN-1
3-morpholino-sydnonimine
- XOR
xanthine oxidoreductase
References
- ADDING L.C., AGVALD P., PERSSON M.G., GUSTAFSSON L.E. Regulation of pulmonary nitric oxide by carbon dioxide is intrinsic to the lung. Acta Physiol. Scand. 1999;167:167–174. doi: 10.1046/j.1365-201x.1999.00585.x. [DOI] [PubMed] [Google Scholar]
- AGVALD P., ADDING L.C., GUSTAFSSON L.E., PERSSON M.G. Nitric oxide generation, tachyphylaxis and cross-tachyphylaxis from nitrovasodilators in vivo. Eur. J. Pharmacol. 1999;385:137–145. doi: 10.1016/s0014-2999(99)00720-7. [DOI] [PubMed] [Google Scholar]
- ARCHER S. Measurement of nitric oxide in biological models. FASEB J. 1993;7:349–360. doi: 10.1096/fasebj.7.2.8440411. [DOI] [PubMed] [Google Scholar]
- ARCHER S.L., TOLINS J.P., RAIJ L., WEIR E.K. Hypoxic pulmonary vasoconstriction is enhanced by inhibition of the synthesis of an endothelium derived relaxing factor. Biochem. Biophys. Res. Commun. 1989;164:1198–1205. doi: 10.1016/0006-291x(89)91796-8. [DOI] [PubMed] [Google Scholar]
- ASANO K., CHEE C.B., GASTON B., LILLY C.M., GERARD C., DRAZEN J.M., STAMLER J.S. Constitutive and inducible nitric oxide synthase gene expression, regulation, and activity in human lung epithelial cells. Proc. Natl. Acad. Sci. U.S.A. 1994;91:10089–10093. doi: 10.1073/pnas.91.21.10089. [DOI] [PMC free article] [PubMed] [Google Scholar]
- AYAPPA I., BROWN L.V., LAI-FOOK S.J. Effects of hypoxia, blood P(CO2) and flow on O2 transport in excised rabbit lungs. Respir. Physiol. 1998;112:155–166. doi: 10.1016/s0034-5687(98)00022-x. [DOI] [PubMed] [Google Scholar]
- AYAPPA I., BROWN L.V., WANG P.M., KATZMAN N., HOUTZ P., BRUCE E.N., LAI-FOOK S.J. Effect of blood flow on capillary transit time and oxygenation in excised rabbit lung. Respir. Physiol. 1996;105:203–216. doi: 10.1016/0034-5687(96)00056-4. [DOI] [PubMed] [Google Scholar]
- BASSENGE E., FINK N., SKATCHKOV M., FINK B. Dietary supplement with vitamin C prevents nitrate tolerance. J. Clin. Invest. 1998;102:67–71. doi: 10.1172/JCI977. [DOI] [PMC free article] [PubMed] [Google Scholar]
- CANTY J.M., JR Nitric oxide and short-term hibernation: friend or foe? [editorial; comment] Circ. Res. 2000;87:85–87. doi: 10.1161/01.res.87.2.85. [DOI] [PubMed] [Google Scholar]
- CARLIN R.E., FERRARIO L., BOYD J.T., CAMPORESI E.M., MCGRAW D.J., HAKIM T.S. Determinants of nitric oxide in exhaled gas in the isolated rabbit lung. Am. J. Respir. Crit. Care Med. 1997a;155:922–927. doi: 10.1164/ajrccm.155.3.9117027. [DOI] [PubMed] [Google Scholar]
- CARLIN R.E., MCGRAW D.J., CAMPORESI E.M., HAKIM T.S. Increased nitric oxide in exhaled gas is an early marker of hypovolemic states. J. Surg. Res. 1997b;69:362–366. doi: 10.1006/jsre.1997.5108. [DOI] [PubMed] [Google Scholar]
- FEELISCH M., OSTROWSKI J., NOACK E. On the mechanism of NO release from sydnonimines. J. Cardiovasc. Pharmacol. 1989;14:S13–S22. [PubMed] [Google Scholar]
- GATTULLO D., LINDEN R.J., LOSANO G., PAGLIARO P., WESTERHOF N. Ischaemic preconditioning changes the pattern of coronary reactive hyperaemia in the goat: role of adenosine and nitric oxide. Cardiovasc. Res. 1999;42:57–64. doi: 10.1016/s0008-6363(98)00319-8. [DOI] [PubMed] [Google Scholar]
- GUSTAFSSON L.Exhaled nitric oxide production by the lung Nitric oxide and the lung 1997New York: Marcel Dekker, Inc; 185–201.ed. Zapol, W.M. & Bloch, K.D. pp [Google Scholar]
- GUSTAFSSON L.E., LEONE A.M., PERSSON M.G., WIKLUND N.P., MONCADA S. Endogenous nitric oxide is present in the exhaled air of rabbits, guinea pigs and humans. Biochem. Biophys. Res. Commun. 1991;181:852–857. doi: 10.1016/0006-291x(91)91268-h. [DOI] [PubMed] [Google Scholar]
- HAMPL V., ARCHER S.L.The role of endogenous nitric oxide in acute hypoxic pulmonary vasoconstriction Nitric oxide and the lung 1997New York: Dekker; 113–135.ed. Zapol, W.M. & Bloch, K.D. pp [Google Scholar]
- HAMPL V., CORNFIELD D.N., COWAN N.J., ARCHER S.L. Hypoxia potentiates nitric oxide synthesis and transiently increases cytosolic calcium levels in pulmonary artery endothelial cells [see comments] Eur. Respir. J. 1995;8:515–522. [PubMed] [Google Scholar]
- HARRISON D.G., BATES J.N. The nitrovasodilators. New ideas about old drugs. Circulation. 1993;87:1461–1467. doi: 10.1161/01.cir.87.5.1461. [DOI] [PubMed] [Google Scholar]
- IDE H., NAKANO H., OGASA T., OSANAI S., KIKUCHI K., IWAMOTO J. Regulation of pulmonary circulation by alveolar oxygen tension via airway nitric oxide. J. Appl. Physiol. 1999;87:1629–1636. doi: 10.1152/jappl.1999.87.5.1629. [DOI] [PubMed] [Google Scholar]
- IGNARRO L.J. The unique role of nitric oxide as a signaling molecule in the cardiovascular system [In Process Citation] Ital. Heart J. 2000;1 Suppl 3:S28–S29. [PubMed] [Google Scholar]
- KELM M. Nitric oxide metabolism and breakdown. Biochim. Biophys. Acta. 1999;1411:273–289. doi: 10.1016/s0005-2728(99)00020-1. [DOI] [PubMed] [Google Scholar]
- KITAKAZE M., NODE K., MINAMINO T., KOSAKA H., SHINOZAKI Y., MORI H., INOUE M., HORI M., KAMADA T. Role of nitric oxide in regulation of coronary blood flow during myocardial ischemia in dogs. J. Am. Coll. Cardiol. 1996;27:1804–1812. doi: 10.1016/0735-1097(96)00064-2. [DOI] [PubMed] [Google Scholar]
- KOBZIK L., BREDT D.S., LOWENSTEIN C.J., DRAZEN J., GASTON B., SUGARBAKER D., STAMLER J.S. Nitric oxide synthase in human and rat lung: immunocytochemical and histochemical localization. Am. J. Respir. Cell. Mol. Biol. 1993;9:371–377. doi: 10.1165/ajrcmb/9.4.371. [DOI] [PubMed] [Google Scholar]
- KURZ M.A., BOYER T.D., WHALEN R., PETERSON T.E., HARRISON D.G. Nitroglycerin metabolism in vascular tissue: role of glutathione S- transferases and relationship between NO. and NO2- formation. Biochem. J. 1993;292:545–550. doi: 10.1042/bj2920545. [DOI] [PMC free article] [PubMed] [Google Scholar]
- LEONE A.M., PALMER R.M., KNOWLES R.G., FRANCIS P.L., ASHTON D.S., MONCADA S. Constitutive and inducible nitric oxide synthases incorporate molecular oxygen into both nitric oxide and citrulline. J. Biol. Chem. 1991;266:23790–23795. [PubMed] [Google Scholar]
- MILLAR T.M., STEVENS C.R., BENJAMIN N., EISENTHAL R., HARRISON R., BLAKE D.R. Xanthine oxidoreductase catalyses the reduction of nitrates and nitrite to nitric oxide under hypoxic conditions. FEBS Lett. 1998;427:225–228. doi: 10.1016/s0014-5793(98)00430-x. [DOI] [PubMed] [Google Scholar]
- MINAMIYAMA Y., TAKEMURA S., AKIYAMA T., IMAOKA S., INOUE M., FUNAE Y., OKADA S. Isoforms of cytochrome P450 on organic nitrate-derived nitric oxide release in human heart vessels. FEBS Lett. 1999;452:165–169. doi: 10.1016/s0014-5793(99)00612-2. [DOI] [PubMed] [Google Scholar]
- MONCADA S., HIGGS A. The L-arginine-nitric oxide pathway. N. Engl. J. Med. 1993;329:2002–2012. doi: 10.1056/NEJM199312303292706. [DOI] [PubMed] [Google Scholar]
- MÜLSCH A., BARA A., MORDVINTCEV P., VANIN A., BUSSE R. Specificity of different organic nitrates to elicit NO formation in rabbit vascular tissues and organs in vivo. Br. J. Pharmacol. 1995;116:2743–2749. doi: 10.1111/j.1476-5381.1995.tb17236.x. [DOI] [PMC free article] [PubMed] [Google Scholar]
- NELIN L.D., THOMAS C.J., DAWSON C.A. Effect of hypoxia on nitric oxide production in neonatal pig lung. Am. J. Physiol. 1996;271:H8–H14. doi: 10.1152/ajpheart.1996.271.1.H8. [DOI] [PubMed] [Google Scholar]
- PALMER R.M., FERRIGE A.G., MONCADA S. Nitric oxide release accounts for the biological activity of endothelium-derived relaxing factor. Nature. 1987;327:524–526. doi: 10.1038/327524a0. [DOI] [PubMed] [Google Scholar]
- PERSSON M.G., AGVALD P., GUSTAFSSON L.E. Detection of nitric oxide in exhaled air during administration of nitroglycerin in vivo. Br. J. Pharmacol. 1994a;111:825–828. doi: 10.1111/j.1476-5381.1994.tb14812.x. [DOI] [PMC free article] [PubMed] [Google Scholar]
- PERSSON M.G., GUSTAFSSON L.E., WIKLUND N.P., MONCADA S., HEDQVIST P. Endogenous nitric oxide as a probable modulator of pulmonary circulation and hypoxic pressor response in vivo. Acta Physiol. Scand. 1990;140:449–457. doi: 10.1111/j.1748-1716.1990.tb09021.x. [DOI] [PubMed] [Google Scholar]
- PERSSON M.G., KALZEN H., GUSTAFSSON L.E. Oxygen or low concentrations of nitric oxide reverse pulmonary vasoconstriction induced by nitric oxide synthesis inhibition in rabbits. Acta Physiol. Scand. 1994b;150:405–411. doi: 10.1111/j.1748-1716.1994.tb09705.x. [DOI] [PubMed] [Google Scholar]
- PERSSON M.G., WIKLUND N.P., GUSTAFSSON L.E. Endogenous nitric oxide in single exhalations and the change during exercise. Am. Rev. Respir. Dis. 1993;148:1210–1214. doi: 10.1164/ajrccm/148.5.1210. [DOI] [PubMed] [Google Scholar]
- SARTORI C., LEPORI M., BUSCH T., DUPLAIN H., HILDEBRANDT W., BARTSCH P., NICOD P., FALKE K.J., SCHERRER U. Exhaled nitric oxide does not provide a marker of vascular endothelial function in healthy humans [see comments] Am. J. Respir. Crit. Care Med. 1999;160:879–882. doi: 10.1164/ajrccm.160.3.9812043. [DOI] [PubMed] [Google Scholar]
- SERVENT D., DELAFORGE M., DUCROCQ C., MANSUY D., LENFANT M. Nitric oxide formation during microsomal hepatic denitration of glyceryl trinitrate: involvement of cytochrome P-450. Biochem. Biophys. Res. Commun. 1989;163:1210–1216. doi: 10.1016/0006-291x(89)91106-6. [DOI] [PubMed] [Google Scholar]
- SHAUL P.W., NORTH A.J., WU L.C., WELLS L.B., BRANNON T.S., LAU K.S., MICHEL T., MARGRAF L.R., STAR R.A. Endothelial nitric oxide synthase is expressed in cultured human bronchiolar epithelium. J. Clin. Invest. 1994;94:2231–2236. doi: 10.1172/JCI117585. [DOI] [PMC free article] [PubMed] [Google Scholar]
- SOLLER B.R., HEARD S.O., CINGO N.A., HSI C., FAVREAU J., KHAN T., ROSS R.R., PUYANA J.C. Application of fiberoptic sensors for the study of hepatic dysoxia in swine hemorrhagic shock. Crit. Care Med. 2001;29:1438–1444. doi: 10.1097/00003246-200107000-00023. [DOI] [PubMed] [Google Scholar]
- STUEHR D.J. Mammalian nitric oxide synthases. Biochim. Biophys. Acta. 1999;1411:217–230. doi: 10.1016/s0005-2728(99)00016-x. [DOI] [PubMed] [Google Scholar]
- TSAI A.G., FRIESENECKER B., MAZZONI M.C., KERGER H., BUERK D.G., JOHNSON P.C., INTAGLIETTA M. Microvascular and tissue oxygen gradients in the rat mesentery. Proc. Natl. Acad. Sci. U.S.A. 1998;95:6590–6595. doi: 10.1073/pnas.95.12.6590. [DOI] [PMC free article] [PubMed] [Google Scholar]
- WALTERS C.L., GILLATT P.N., PALMER R.C., SMITH P.L. A rapid method for the determination of nitrate and nitrite by chemiluminescence. Food Addit. Contam. 1987;4:133–140. doi: 10.1080/02652038709373624. [DOI] [PubMed] [Google Scholar]
- VANHOUTTE P.M. Say NO to ET. J. Auton. Nerv. Syst. 2000;81:271–277. doi: 10.1016/s0165-1838(00)00126-0. [DOI] [PubMed] [Google Scholar]
- WEITZBERG E., LUNDBERG J.O. Nonenzymatic nitric oxide production in humans. Nitric Oxide. 1998;2:1–7. doi: 10.1006/niox.1997.0162. [DOI] [PubMed] [Google Scholar]
- WIKLUND N.P., LEONE A.M., GUSTAFSSON L.E., MONCADA S. Release of nitric oxide evoked by nerve stimulation in guinea-pig intestine. Neuroscience. 1993;53:607–611. doi: 10.1016/0306-4522(93)90609-j. [DOI] [PubMed] [Google Scholar]
- YEATES R.A., SCHMID M. Total prevention of the development of in vitro tolerance to organic nitrates. Experiments with antioxidants. Arzneimittelforschung. 1992;42:297–302. [PubMed] [Google Scholar]
- YEATES R.A., SCHMID M., LEITOLD M. Antagonism of glycerol trinitrate activity by an inhibitor of glutathione S-transferase. Biochem. Pharmacol. 1989;38:1749–1753. doi: 10.1016/0006-2952(89)90408-5. [DOI] [PubMed] [Google Scholar]
- ZHANG Z., NAUGHTON D., WINYARD P.G., BENJAMIN N., BLAKE D.R., SYMONS M.C. Generation of nitric oxide by a nitrite reductase activity of xanthine oxidase: a potential pathway for nitric oxide formation in the absence of nitric oxide synthase activity [published erratum appears in Biochem Biophys Res Commun 1998 Oct 20;251(2):667] Biochem. Biophys. Res. Commun. 1998;249:767–772. doi: 10.1006/bbrc.1998.9226. [DOI] [PubMed] [Google Scholar]
- ZHAO G., BERNSTEIN R.D., HINTZE T.H. Nitric oxide and oxygen utilization: exercise, heart failure and diabetes. Coron. Artery Dis. 1999;10:315–320. doi: 10.1097/00019501-199907000-00007. [DOI] [PubMed] [Google Scholar]