Abstract
Human intestinal epithelial Caco-2 cells, T84 cells, and MDCKII cells transfected with human MDR1, were used to investigate the mechanistic basis of transintestinal fluoroquinolone secretion.
The fluoroquinolone grepafloxacin was secreted across Caco-2 monolayers by a saturable process (Vmax=16.9±3.4 nmol.cm−2.h−1). Net secretion was reduced by 2-deoxyglucose/azide treatment to reduce intracellular ATP.
Grepafloxacin inhibited [14C]-ciprofloxacin (100 μM) secretion across Caco-2 monolayers (K0.5=0.8 mM), and concurrently increased the cellular accumulation of ciprofloxacin from the basal medium, indicating inhibition of export across the apical membrane.
The unconjugated bile acid, cholic acid, was secreted across Caco-2 monolayers, and this secretion was sensitive to inhibition by the MRP-selective inhibitor MK-571, suggesting MRP2 involvement. Secretion of cholic acid (10 μM) across the apical membrane was also inhibited by grepafloxacin (K0.5=0.3 mM), but not by ciprofloxacin.
In MDCKII-MDR1 monolayers, net secretion of grepafloxacin was increased by 3.5 fold compared with untransfected controls. Neither ciprofloxacin nor cholic acid showed net secretion in either MDCKII or MDCKII-MDR1 monolayers, showing that in contrast to grepafloxacin, neither are substrates for MDR1.
In T84 monolayers, which express MDR1 but not MRP2, neither ciprofloxacin nor cholic acid was secreted, whilst the Vmax for grepafloxacin secretion was lower than in Caco-2 cells, which express both MDR1 and MRP2.
In conclusion, the transepithelial secretion of grepafloxacin is mediated by both MRP2 and MDR1, whereas ciprofloxacin is a substrate for neither. Grepafloxacin also competes for the ciprofloxacin-sensitive pathway, which remains to be elucidated.
Keywords: Fluoroquinolone, grepafloxacin, ciprofloxacin, Caco-2 cells, intestinal secretion, ABC transporters, MDR1 P-glycoprotein, MRP2
Introduction
Secretion of fluoroquinolone antibiotics such as ciprofloxacin into the gut lumen in man (Sörgel et al., 1989; 1991; Jaehde et al., 1989; Rohwedder et al., 1990) is an important route for excretion of the unchanged drug to faeces (Parry et al., 1988; Rohwedder et al., 1990). Our own work has provided an insight into the cellular basis of this phenomenon (Griffiths et al., 1993; 1994; Cavet et al., 1997). Using a human intestinal cell model (Caco-2), we have shown active, saturable secretion of ciprofloxacin, which is also subject to competitive inhibition by other fluoroquinolones (Griffiths et al., 1993; 1994). Secretory transport of ciprofloxacin involves two distinct transport steps: at the basolateral cell membrane, ciprofloxacin is accumulated within the cytosol, with loss of ciprofloxacin then occurring across the apical membrane (Griffiths et al., 1994; Cavet et al., 1997). The involvement of MDR1 (multidrug resistance gene product 1) P-glycoprotein, a member of the ATP-binding cassette (ABC) group of transporters, in ciprofloxacin secretion may be discounted (Griffiths et al., 1994; Cavet et al., 1997).
Recently, Yamaguchi et al. (2000) have suggested that the fluoroquinolone grepafloxacin is secreted by Caco-2 cells via MDR1. Matsuo et al. (1998) have also suggested that P-glycoprotein is involved in fluoroquinolone secretion by LLC-PK1 (porcine kidney) cells. In addition, the biliary secretion of grepafloxacin in mutant Eisai-hyperbilirubinaemic rats deficient in MRP2 (multidrug resistance-associated protein 2, also known as the canalicular multispecific organic anion transporter, cMOAT) was reduced to 38% of values seen in control animals (Sasabe et al., 1998). Our own recent work has shown that certain bile acids, such as cholic acid, induce toxicity in Caco-2 epithelial monolayers when they are preferentially presented at high concentrations from the basolateral epithelial surfaces (Lowes & Simmons, 2001). Furthermore, cholic acid is subject to active transepithelial secretion, a process that would effectively clear the submucosal space of toxic bile acids, so limiting toxicity (Lowes & Simmons, 2001).
The purpose of the present work has been to test whether MDR1 and MRP2 may indeed contribute to the secretory transport pathway for fluoroquinolones in human intestinal cells, and to investigate whether the apparent contradictory data on fluoroquinolone secretion may be reconciled by the hypothesis that multiple ABC transporters with differing specificities are co-expressed. Such ABC transporters may then act in concert to mediate fluoroquinolone secretion. Using both human intestinal Caco-2 layers and MDCKII (Madin-Darby canine kidney) cells stably transfected with MDR1, we found that grepafloxacin is indeed secreted by MDR1, whereas ciprofloxacin and cholic acid are not. Grepafloxacin also competes with the cholic acid secretory pathway in Caco-2 cells, which is most likely represented by MRP2. In addition, grepafloxacin and ciprofloxacin are secreted by an additional pathway in Caco-2 cells, which is distinct from both MDR1 and MRP2, demonstrating that multiple ABC transporters contribute to the overall secretion of fluoroquinolones.
Methods
Cell culture
Caco-2 cells were obtained from Dr I. Hassan (Ciba-Geigy Pharmaceuticals, Horsham, Sussex, U.K.) and used between passage numbers 95 – 114. These cells were cultured in DMEM (Dulbecco's Modified Eagle's Medium) containing glucose (4.5 g.l−1) and supplemented with non-essential amino acids (1%), L-glutamine (2 mM), foetal calf serum (10%) and gentamicin (30 μg.ml−1). T84 cells (passage numbers 53 – 58) were maintained in a 1 : 1 combination of high-glucose DMEM and Ham's F-12 nutrient mixture, supplemented with newborn calf serum (5% v v−1), HEPES (15 mM), and gentamicin (30 mg.l−1). Caco-2 and T84 cell monolayers were prepared by seeding at high density (5.0×10⁵ cells.cm−2) onto tissue culture inserts (Transwell 3401, 12 mm diameter, 0.4 μm pore size uncoated polycarbonate filters, Costar). Monolayers were maintained at 37°C in a humidified atmosphere of 5% CO2 in air. Confluence was estimated both by microscopy and by determination of RT using a WPI EVOM voltohmeter fitted with ‘chopstick' electrodes (World Precision Instruments, Stevenage, Hertfordshire, U.K.). RT values were measured at 37°C in Krebs' buffer (Hunter et al., 1993a, 1993c), and were typically in the range of 200 – 300 Ω.cm2 for Caco-2 monolayers, and >1500 Ω.cm2 for T84 monolayers.
MDCKII-MDR1 cells are derived wild-type MDCKII cells and are stably transfected with MDR1, resulting in over-expression of the apical efflux pump P-glycoprotein (Horio et al., 1989). Use of these cells was kindly authorized by Piet Borst (Netherlands Cancer Institute, Amsterdam). The cells were maintained in DMEM Glutamax (Gibco), supplemented with foetal calf serum (10% v v−1) and glutamine (1% v v−1). Wild-type MDCKII cells were from stocks described by Barker & Simmons (1981) and chosen as controls for MDCKII-MDR1 cell layers on the basis of the similarity of the low transepithelial resistance, cation-selective paracellular pathway, and their known ability to secrete vinblastine (Hunter et al., 1993b). Transepithelial potential differences were used as an estimate of MDCKII cell monolayer confluence, and were measured in Krebs' buffer using a WPI EVOM voltohmeter, following iso-osmotic replacement of the basolateral NaCl buffer with choline chloride (basolateral solution electropositive). Potential difference values were typically 19.0±0.4 mV for MDCKII cells and 33.5±0.7 mV for MDCKII-MDR1 cells (both n=108). Transepithelial electrical resistance (RT) values for both cell-types were 57.9±1.2 and 73.1±1.7 Ω.cm2 (both n=108), respectively (following subtraction of filter resistance).
Transepithelial transport experiments
Uptake and transport experiments with cholic acid, grepafloxacin, and ciprofloxacin, were performed 14 – 21 days after seeding and 18 – 24 h after feeding. Transepithelial flux measurements were performed at steady-state as described previously, in a modified Krebs' solution containing (all mmol.l−1), NaCl 137, KCl 5.4, CaCl2 2.8, MgSO4 1.0, NaH2PO4 0.3, KH2PO4 0.3, glucose 10, HEPES/Tris 10 (pH 7.4 at 37°C) (Cavet et al., 1996; 1997). The experimental composition of the buffers in the apical and basal chambers were identical, except where stated otherwise. Radiolabelled [3H]-cholic acid, [14C]-ciprofloxacin, [3H]-vinblastine, and [3H]-mannitol or [14C]-mannitol as appropriate (0.1 μCi.ml−1 for [3H] or for 0.3 μCi.ml−1 [14C], adjusted to 10 μM for cholic acid, 10 μM for ciprofloxacin, 10 μM for vinblastine, and 100 μM for mannitol) were added to either the apical or basolateral chamber, and in each case an equivalent concentration of unlabelled substrate was present in the contralateral chamber. For grepafloxacin, since no radiolabel was available, grepafloxacin fluxes were determined from the appearance of grepafloxacin in the trans-compartment (initially zero). Grepafloxacin transport was quantified by its fluorescence at 422 nm, with excitation at 328 nm. Where other drugs were present, equal concentrations were present in both the apical and basolateral bathing solutions, except where indicated. Grepafloxacin accumulating in the apical or basal compartments after transport through Caco-2 cells was confirmed as native drug by mass spectrometry (R. Eastmond, unpublished data). Experiments investigating the effects of competitive inhibitors on grepafloxacin flux were precluded by competing fluorescence emission at 422 nm. Fluxes in the absorptive (apical-to-basal Ja-b) and secretory (basal-to-apical Jb-a) directions were determined for 1 h (after a 20 min pre-incubation to establish a state of linear flux) on adjacent paired cell monolayers and are expressed as nmol.cm−2.h−1. The magnitude of passive (paracellular) fluxes across the epithelium was determined by concurrent mannitol flux determinations. If paracellular fluxes were excessive (mannitol flux values of >2% per hour), data were rejected.
At the end of the incubation period, each tissue culture insert containing the cell monolayer was washed by sequential transfer through four beakers containing 500 ml volumes of Krebs' buffer (pH 7.4) at 4°C to in order to remove any loosely-associated radiolabel, and the filters/monolayers were then excised from the insert using a scalpel blade and placed directly into a scintillation vial containing scintillation cocktail (OptiPhase HiSafe 2, Wallac). Cell monolayer-associated radiolabel was determined by scintillation counting. Cellular uptake is expressed as μM (Cavet et al., 1997).
Where both transepithelial bi-directional fluxes were measured, epithelial cell monolayers were paired during experimental design for determination of Ja-b or Jb-a. Net transepithelial secretory fluxes were then determined (Jnet= Jb-a – Ja-b). In addition, where cellular uptake was determined across the apical and basolateral cell surfaces, it is possible to calculate unidirectional fluxes across the apical and basolateral border (Naftalin & Curran, 1974) using the following equations:
 |
where J denotes the respective fluxes;a, b and c denote apical, basolateral, and cell compartments, R is the ratio of cellular uptake of the substrate from the apical media divided by that from basal media. Permeabilities (Pa-c, Pc-a, Pc-b, Pb-c,) were calculated from the unidirectional fluxes as follows:
 |
where Ca and Cb represent the concentration of substrate (expressed as molar) in the ipsilateral (originating) apical and basolateral compartments, respectively, and Aa and Ab represent the amount substrate (as a molar concentration) taken up across the apical and basolateral cell borders, respectively (as determined above).
Western blotting
Total protein was extracted from confluent flasks of Caco-2 and T84 cells by whole cell lysis, and protein content was quantified using Bradford agent (Bio-Rad). Bis-Tris gels (4 – 12%; NuPAGE Electrophoresis System, NOVEX) were used to separate proteins, and proteins were then transferred onto PVDF membranes overnight. Equal protein loading in all lanes was confirmed by Coomassie staining. Membranes were washed briefly in TBS (Tris-buffered saline) buffer (Tris-HCl 20 mM, NaCl 137 mM, and 0.1% Tween 20; pH 7.6), and blocked with 5% non-fat dried milk in TBS buffer. Membranes were then incubated with either the anti-human MRP2 antibody (see Materials section) diluted 1 : 25 in TBS buffer, or the anti-human MDR1 antibody C219, diluted 1 : 100. After washing again in TBS, cells were incubated with peroxidase-labelled anti-mouse secondary antibody (Amersham, U.K.), and products were detected using an ECL+ Plus Western blotting detection system (Amersham, U.K.), following manufacturer s instructions.
Materials
[14C]-Ciprofloxacin (specific activity 258.26 μCi.mg−1) and unlabelled ciprofloxacin were generous gifts from Bayer (Wuppertal, Germany). [14C]- and [3H]-Mannitol (specific activities 50 Ci.mmol−1 and 30 Ci.mmol−1 respectively), and [3H]-cholic acid (specific activity 24.5 Ci.mmol−1) were from New England Nuclear (Stevenage, Hertfordshire, U.K.). [3H]-vinblastine was from Amersham (Buckinghamshire, U.K.). MK-571 was bought Affiniti Research Products Ltd (Mamhead, Exeter, U.K.) and was stored at −20°C as a 9 mM stock solution in dimethylsulphoxide (DMSO). The monoclonal mouse antibody (IgG2a) to human MRP2 (M2III-6) (Kool et al., 1997) was bought from Alexis Biochemicals (Nottingham, U.K.) and was stored at −20°C. M2III-6 reacts with an internal epitope of the 190 kDa human MRP2 (manufacturer's data sheet). The antibody does not cross-react with the human MDR1, MRP1, MRP3, or MRP5 gene products. Cell culture media and supplements were from Sigma (Poole, Dorset, U.K.), and tissue culture plastic flasks and culture inserts were supplied by Costar (High Wycombe, U.K.). All other chemicals were supplied by Sigma.
Statistics
Results are expressed as mean±s.e.mean (n). For statistics relating to Jnet, individual values of net flux from paired monolayers were used. For unidirectional fluxes and permeabilities, individual values calculated from data derived from paired monolayers (above) were used. Statistical analyses were performed using Student's unpaired t-test or one-way analysis of variance (ANOVA) with a Bonferroni post-test for multiple comparisons (GraphPad Instat, SanDiego, U.S.A.). Kinetic constants for Michaelis-Menten kinetics were calculated by non-linear regression with the method of least squares (GraphPad Prism, SanDiego, U.S.A.).
Results
Transepithelial grepafloxacin fluxes in Caco-2 epithelia
Absorption of the fluoroquinolone antibiotic grepafloxacin (Ja-b) across Caco-2 epithelia showed a linear dependence upon medium concentration (Figure 1); the calculated absorptive permeability (Pa-b=Ja-b/Ca) was 7.6×10⁻² cm.h−1, which exceeds concurrently measured values of mannitol permeability (0.5×10⁻² cm.h−1). Figure 1 demonstrates that grepafloxacin was also secreted from basal to apical solutions in Caco-2 epithelia; that is, the basal-to-apical flux (Jb-a) of grepafloxacin exceeded apical-to-basal flux (Ja-b). Net secretion (Jnet) demonstrated saturation kinetics, with half maximal saturation being observed at 0.15±0.8 (s.e.mean) mM, and a maximal secretory capacity (Vmax) of 16.9±3.37 nmol.cm−2.h−1 (data from three to eight monolayers). At higher apical concentrations of grepafloxacin (1.0 mM), absorptive flux was 181.6±4.3 nmol.cm−2.h−1 (n=5), which clearly exceeds the capacity of the secretory component (data not shown).
Figure 1.
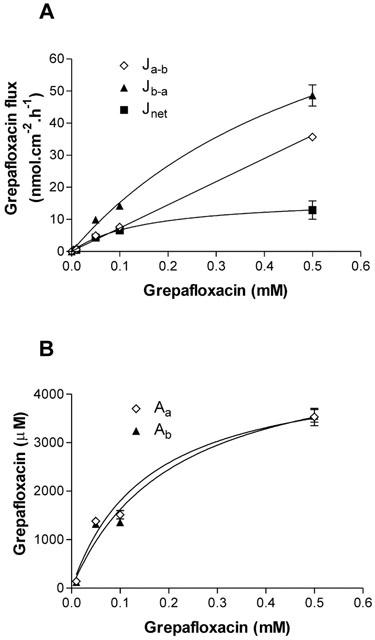
Concentration-dependence of transepithelial fluxes and cellular uptake of grepafloxacin by Caco-2 epithelial monolayers. (A) Transepithelial grepafloxacin fluxes were determined in the apical to basal (Ja-b) and basal to apical (Jb-a) directions. Net secretory flux (Jnet) shown as Jb-a – Ja-b. Least-square Michaelis-Menten fit for Jnet is shown. Concurrent measurements of [3H] or [14C] mannitol were determined in order to confirm maintenance of monolayer integrity during flux measurements. n=5 – 6 epithelia (uptakes) or paired epithelia (fluxes) per data point. Data are the mean±s.e.mean. (B) Concentration-dependence of steady-state values of cellular grepafloxacin measured across apical or basal cell borders. Solid lines are the Michaelis-Menten least-square fits. Other details as in (A).
With an external grepafloxacin concentration of 0.1 mM, there was no asymmetry in steady-state cellular grepafloxacin uptake across the apical and basolateral surfaces (1.51± 0.08 mM, n=6) compared to that at the apical surface (1.36±0.04 mM, n=6). The apparent cell-to-medium ratio (C/M) was approximately 14 for loading from either the apical or basal solution, which exceeds the value observed for ciprofloxacin transport by Caco-2 epithelia (Griffiths et al., 1994; Cavet et al., 1997). Figure 1B also shows that there is a concentration-dependent reduction in the C/M accumulation ratio within the cell.
In Caco-2 cell layers incubated in the presence of 50 mM 2-deoxy-D-glucose and 15 mM sodium azide to deplete intracellular ATP (Griffiths et al., 1993), there was a significant reduction in grepafloxacin net secretion (Figure 2). After 1 h in 2-deoxy-D-glucose/azide, there was, however, a small but non-significant increase in the mannitol fluxes that were measured concurrently; Ja-b was increased from 0.20±0.01 to 0.24±0.02 nmol.cm−2.h−1 (both n=6, P>0.05 versus controls); Jb-a was increased from 0.22±0.03 to 0.27±0.03 nmol.cm−2.h−1 (both n=6, P>0.05 versus controls). Therefore, as with ciprofloxacin secretion, grepafloxacin secretion is reduced with 2-deoxyglucose/azide treatment to deplete intracellular ATP.
Figure 2.
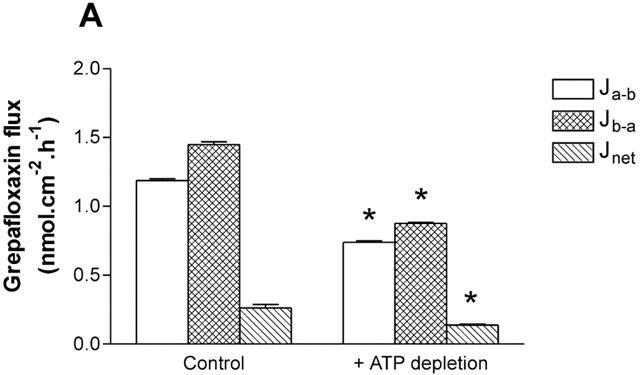
Effect of 2-deoxy-D-glucose/sodium azide treatment on the transepithelial fluxes of grepafloxacin across Caco-2 monolayers. Transepithelial grepafloxacin fluxes were determined using 10 μM grepafloxacin. Fifty mM 2-deoxy-D-glucose and 15 mM Na azide were present in both apical and basal solutions concurrently. n=6 paired epithelia per data point. *P<0.05 versus control values. Other details as in Figure 1.
Effect of grepafloxacin upon the transepithelial transport and cellular uptake of ciprofloxacin
Since competing fluoroquinolones interfere with grepafloxacin in the fluorescence determinations, the ability of grepafloxacin to compete for the ciprofloxacin secretory pathway in Caco-2 cells was tested. Figure 3 demonstrates that grepafloxacin was an effective inhibitor of ciprofloxacin net secretion (K0.5≈0.8 mM), primarily by a reduction in Jb-a (Figure 3A). In addition, grepafloxacin increased the steady-state uptake of ciprofloxacin across both cellular borders, the effect upon basolateral accumulation being most marked at 0.3 – 0.5 mM grepafloxacin (Figure 3B). This pattern of inhibition is consistent with a more pronounced inhibition of exit permeability than entry permeabilities for ciprofloxacin.
Figure 3.
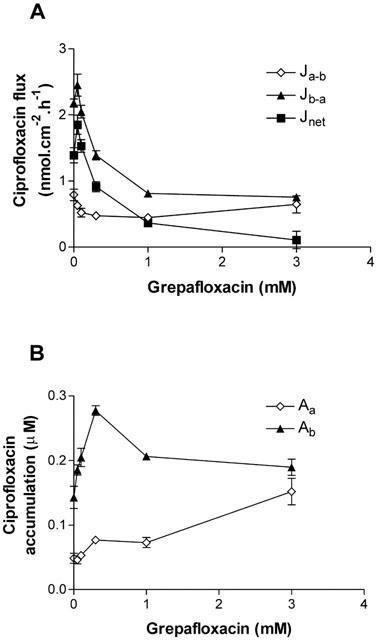
Concentration-dependent grepafloxacin inhibition of ciprofloxacin secretion across Caco-2 monolayers. (A) Transepithelial ciprofloxacin (100 μM) fluxes measured alone and in the presence of increasing concentrations of grepafloxacin in both the apical and basolateral compartments. Jnet shown as Jb-a – Ja-b. n=8 – 9 epithelia (uptakes) or paired epithelia (fluxes) per data point. (B) Cellular ciprofloxacin from apical or basal bathing solutions in the presence of increasing grepafloxacin concentrations. Other details as above.
Calculation of unidirectional permeabilities (see Methods) indicates that at the apical membrane exit permeability (Pc-a) decreased from 1.78±0.27×10⁻² cm.h−1 (n=8) to 0.39±0.02×10⁻² cm.h−1 (n=8, P<0.05 vs control) in the presence of 3 mM grepafloxacin. In contrast, the entry permeability at the apical membrane (Pa-c) was largely unaffected, from 1.45±0.06×10⁻² cm.h−1 (n=8) to 1.01±0.14×10⁻² cm.h1 (n=8). Thus the ratio of apical permeabilities Pa-c/Pc-a changes from 0.8 (secretion) to 2.6 (absorption). These data show that entry and exit pathways at the apical membrane are dissimilar, and that the absorptive permeability for ciprofloxacin and grepafloxacin (above) is likely to result from access to an absorptive brush-border transporter. At the basolateral membrane, grepafloxacin decreased the exit permeability (Pc-b) from 2.57±0.76×10⁻² cm.h−1 (n=8) to 0.43±0.08×10⁻² cm.h−1 (n=8, P<0.05 vs control) in the presence of 3 mM grepafloxacin. In addition, the entry permeability across the basolateral membrane (Pb-c) was also decreased, from 4.73±0.39×10⁻² cm.h−1 (n=8) to 1.41±0.12×10⁻² cm.h−1 (n=8, P<0.05 vs control) in the presence of 3 mM grepafloxacin. It should be stressed that grepafloxacin does not decrease the ratio of permeabilities Pb-c/Pc-b at the basolateral membrane, which increases from a 1.8 fold asymmetry in controls to 3.3 fold plus 3 mM grepafloxacin. This indicates that the ability to accumulate ciprofloxacin at the basal membrane is not impaired. Inhibition of transepithelial ciprofloxacin secretion therefore results primarily from inhibition of ciprofloxacin exit from the cell across the apical border.
Effect of grepafloxacin upon transepithelial transport and cellular uptake of cholic acid
The unconjugated bile acid, cholic acid, was also subject to secretion by Caco-2 epithelia (Figure 4A). At 20 μM cholic acid, Jb-a (0.96±0.09 nmol.cm−2.h−1; n=12) exceeded Ja-b (0.25±0.03 nmol.cm−2.h−1; n=12, P<0.05). Pa-b for cholic acid (1.2×10⁻² cm.h−1) was lower than that for grepafloxacin (7.6×10⁻² cm.h−1; above). Cellular accumulation of cholic acid across the basolateral cell membranes (53.4±5.1 μM, n=12; cell-to-medium ratio of 2.7 fold) was marked relative to that across the apical membrane (10.6±1.2 μM, n=12; cell-to-medium ratio 0.5 fold). Grepafloxacin was also an effective inhibitor of cholic acid net secretion (K0.5=0.3 mM) by Caco-2 cells (Figure 4A). Inhibition occurred primarily by a reduction in Jb-a (Figure 4A). Furthermore, grepafloxacin increased the steady-state uptake of cholic acid across both cellular borders, the effect upon basolateral accumulation being most marked (Figure 4B). At 3 mM grepafloxacin, the cell-to-medium ratio for basal accumulation of cholic acid was increased to 5.9 fold, whereas that for apical accumulation increased to 1.9 fold. This pattern of inhibition is similar to that observed for grepafloxacin inhibition of ciprofloxacin secretion (above). Calculation of unidirectional permeabilities (see Methods) indicates that a reduction in the apical membrane exit permeability in the presence of 3 mM grepafloxacin is likely to account for the observed inhibition of transepithelial secretion (Pc-a decreased from 1.85±0.18×10⁻² cm.h−1 to 0.47±0.02×10⁻² cm.h−1, both n=12; P<0.05 vs control). Grepafloxacin does not inhibit entry of cholic acid (Pa-c in controls 2.19±0.17×10⁻² cm.h−1 vs 3.40±0.21×10⁻² cm. h−1 in the presence of 3 mM grepafloxacin, both n=12). Thus, grepafloxacin increases the ratio of permeabilities Pa-c/Pc-a at the apical membrane from 1.18 fold in controls, to 7.28 fold plus 3 mM grepafloxacin. The differential action of grepafloxacin suggests that the entry and exit pathways for cholic acid at the apical membrane are likely to be separate. Grepafloxacin was capable of inhibition of exit at the basal membrane to only ∼50% of controls in the presence of 3 mM grepafloxacin (Pc-b was decreased from 2.60±0.40× 10⁻² cm.h−1 to 1.34±0.12×10⁻² cm.h−1, both n=12; P< 0.05 vs control), whereas Pb-c was largely unaffected (controls 11.06±0.57×10⁻² cm.h−1 to 10.39±0.75×10⁻² cm.h−1 in the presence of 3 mM grepafloxacin, both n=12; n.s., P>0.05). It is worth noting that high concentrations of grepafloxacin were not toxic to monolayer integrity; for example, mannitol Ja-b in the control condition was 1.96±0.58 nmol.cm−2.h−1, and in the presence of 3 mM grepafloxacin, mannitol Ja-b was 2.11±0.40 nmol cm−2.h−1 (n.s., P>0.05; both n=12).
Figure 4.
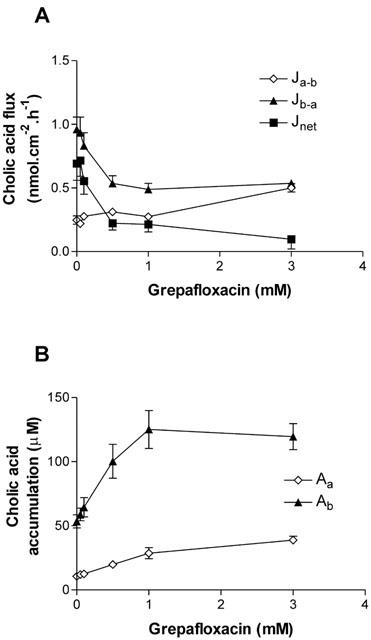
Concentration-dependence of inhibition of cholic acid fluxes across Caco-2 monolayers by grepafloxacin. (A) Transepithelial fluxes of cholic acid (20 μM) alone and in the presence of increasing concentrations of grepafloxacin for apical to basal flux (Ja-b) and basal to apical flux (Jb-a). Net secretory flux is Jnet=Jb-a – Ja-b. Increasing doses of grepafloxacin were present in both apical and basolateral compartments. n=12 epithelia (uptakes) or 12 paired epithelia (fluxes) per data point. (B) Concentration-dependence of grepafloxacin on cellular cholic acid measured across apical or basolateral surfaces. Other details as in (A).
The ability of Caco-2 cells to secrete grepafloxacin, and for grepafloxacin to inhibit both cholic acid secretion and ciprofloxacin secretion, suggests that fluoroquinolones are common substrates of an endogenous ciprofloxacin/cholic acid secretory capacity. Inhibition of secretion of both substrates by grepafloxacin occurs by inhibition of an apical membrane efflux transport.
Role of MDR1 in grepafloxacin/ciprofloxacin/cholic acid secretion
To investigate the role played by MDR1 in grepafloxacin secretion, we have utilized MDCKII epithelial layers permanently transfected with MDR1, as well as parental MDCKII layers as controls (see Methods). Figure 5 shows that net secretion of the MDR1 substrate vinblastine (10 μM) by MDCKII epithelia was increased 2.6 fold in MDCKII-MDR1 transfected monolayers. This increment in net vinblastine secretion results from both a reduction in Ja-b and an increase in Jb-a. MDR1 transfection also decreases vinblastine cellular accumulation across both apical and basal cell borders. In parental MDCKII cell layers, cellular accumulation across the apical cell border was 384.1± 54.8 μM, and this was reduced in MDR1 transfected cell layers to 33.6±3.4 μM (P<0.01, n=15). Across the basal cell border, accumulation was 398.7±53.9 μM, and this was reduced in MDCK-MDR1 cell layers to 106.8±10.9 μM (P<0.01, n=15). These data are similar to those reported for vinblastine fluxes in other MDR1-transfected MDCK cells (Horio et al., 1989). The main action of MDR1 transfection is to increase the exit permeability across the apical membrane Pc-a (Table 1), entirely consistent with MDR1 expression at this location.
Figure 5.
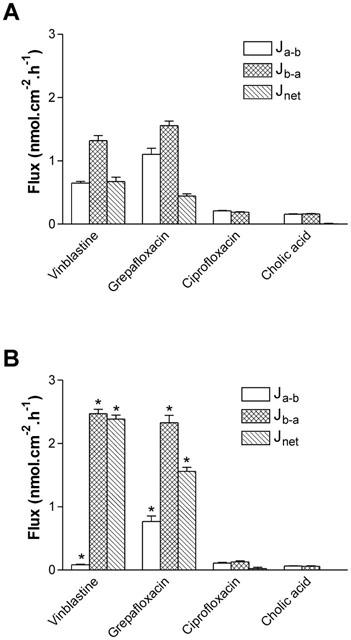
Role of MDR1 in grepafloxacin secretion tested using MDCKII-MDR1 transfected epithelia. Transepithelial fluxes of vinblastine, grepafloxacin, ciprofloxacin and cholic acid were measured in (A) control MDCKII epithelia and in (B) MDCKII-MDR1 transfected epithelia. Jnet shown as Jb-a – Ja-b. Vinblastine, ciprofloxacin and cholic acid fluxes determined using 10 μM unlabelled vinblastine in apical/basal bathing solutions. Grepafloxacin fluxes determined using 10 μM in either apical or basal solutions with trans-compartment without drug. For ciprofloxacin and cholic acid, n=6 paired epithelia per data point. For grepafloxacin and vinblastine, n=12 – 15. *P<0.05, significantly different from MDCKII control values.
Table 1.
Calculated unidirectional permeabilities for vinblastine and grepafloxacin in MDCKII and MDCKII-MDR1 monolayers

In a similar fashion, net secretion of grepafloxacin (10 μM) was increased from 0.44±0.04 nmol.cm−2.h−1 (n=12) in normal MDCKII epithelia to 2.56±0.06 nmol.cm−2.h−1 (n=12) in MDR1 transfectants (a 3.5 fold increase) (Figure 5). Cellular accumulation of grepafloxacin was not, however, reduced in MDR1 transfectants. In parental MDCKII cell layers, cellular accumulation across the apical cell border was 86.8±2.3 μM (n=12), and this was not reduced in MDCKII-MDR1 cell layers (96.6±3.4 μM, n=12). Across the basal cell border, accumulation of grepafloxacin was 100.0±1.8 μM (n=12), and again this was not reduced in MDCKII-MDR1 epithelia (138.9±4.9 μM, n=12). Calculation of unidirectional permeabilities for grepafloxacin (Table 1) shows that MDR1 transfection leads only to a modest increase Pc-a that was not statistically significantly different from parental layers. An important assumption of the calculation of permeabilities (see Methods) is that substrate is uniformly distributed within the cytosol of the cell. For grepafloxacin this assumption may not be valid.
In contrast to grepafloxacin, neither ciprofloxacin nor cholic acid showed net secretion in either MDCKII epithelia or MDCKII-MDR1 transfectants (Figure 5). Thus, neither ciprofloxacin nor cholic acid is a substrate for MDR1.
In order to test whether other fluoroquinolones are subject to MDR1-mediated secretion, we have tested the ability of ofloxacin, norfloxacin pefloxacin and cipro-floxacin to inhibit vinblastine secretion (10 μM) across MDCK-MDR1 epithelia. Whereas both 100 μM verapamil and 3 mM grepafloxacin reduced net vinblastine secretion from 2.3±0.11 nmol.cm−2.h−1 (n=4) to 0.60±0.05 nmol.cm−2.h−1 (n=4) and 0.09±0.06 nmol.cm−2.h−1 (n=4), respectively, no significant inhibition was observed with ofloxacin (2.22±0.045 nmol.cm−2.h−1; n=4), norfloxacin (2.32± 0.045 nmol.cm−2.h−1; n=4), pefloxacin (1.74±0.06 nmol. cm−2.h−1; n=4), and ciprofloxacin (1.82±0.03 nmol.cm2.h−1; n=4).
Inhibition of cholic acid secretion across Caco-2 cells by MK-571
In a previous study, we demonstrated that cholic acid secretion was ATP-dependent, and subject to inhibition by the relatively non-specific MDR/MRP inhibitors verapamil and cyclosporin A (Lowes & Simmons, 2001). Given that cholic acid was not secreted by MDCKII-MDR1 cells, the contribution of MRP family members to cholic acid secretion was tested using the leukotriene D4 (LTD4) receptor antagonist and MRP-selective inhibitor MK-571 (Büchler et al., 1996). Figure 6 shows the ability of MK-571 at increasing concentrations to modulate cholic acid transport (10 μM) in Caco-2 monolayers. Net secretion of cholic acid was virtually abolished at the highest concentration of MK-571 tested (Jnet at 50 μM MK-571 was 0.052±0.014 nmol.cm−2.h−1 vs control value at 0.504±0.035 nmol.cm−2.h−1; P<0.05, both n=12). This was brought about by both a reduction in Jb-a and an increase in Ja-b (Figure 6A). There was also an increase in cholic acid accumulation across the basolateral membrane; ANOVA testing showed that overall, MK-571 significantly increased cholic acid Ab, although individual post-tests showed significance at 5 and 25 μM MK-571 (Figure 6B). The increase in the accumulation of cholic acid across the basolateral membrane suggests that the reduction in Jb-a is brought about by inhibition of cholic acid exit at the apical membrane. Given that MRP2 is currently the only MRP family member known to be expressed at the apical membrane, it is likely that this inhibition represents MRP2 blockade. At concentrations of MK-571 less than 10 μM, no inhibition of cholic acid secretion occurred. Rather, the basal-to-apical flux was increased, with a concurrent decrease in the apical-to-basal flux (Figure 6A), and this was coupled with an increase in cholic acid Ab (Figure 6B; P<0.05 at 5 μM MK-571).
Figure 6.
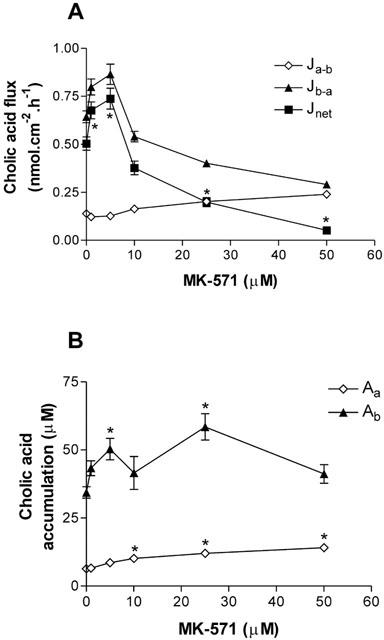
Concentration-dependent MK-571 inhibition of cholic acid secretion across Caco-2 monolayers. (A) Transepithelial cholic acid fluxes (10 μM) measured alone and in the presence of increasing concentrations of MK-571 in both the apical and basolateral compartments. Jnet was calculated as Jb-a – Ja-b. n=12 single epithelia (uptakes) or paired epithelia (fluxes) per data point. *P<0.05, Jnet significantly different from control. (B) Cellular cholic acid from apical or basal bathing solutions in the presence of increasing MK-571 concentrations. *P<0.05, significantly different from controls.
Contribution of MRP2 to cholic acid and grepafloxacin transport by human intestinal Caco-2 and T84 monolayers
In order to ascertain the protein expression of MDR1 and MRP2 in Caco-2 and T84 cell types, Western blot analysis was carried out on both Caco-2 and T84 protein extracts using the monoclonal antibodies M2III-6 (MRP2) and C219 (MDR1). Figure 7 shows that whereas MDR1 protein was readily detectable in T84 extract at two different protein loading densities, MRP2 protein was not detectable in T84 cells at either low or high protein loading. Both MDR1 and MRP2 were readily detectable in the Caco-2 extract (Figure 7).
Figure 7.
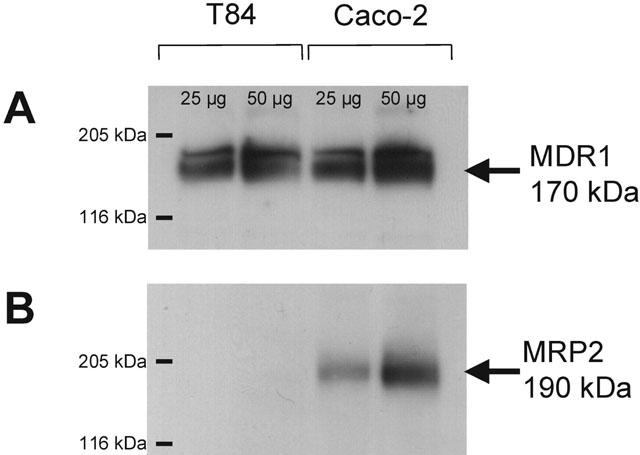
Western blot analysis of MDR1 and MRP2 protein expression in Caco-2 and T84 cell extracts. Protein extraction and immunodetection were carried out as described in the Methods section, using the mouse anti-human monoclonal antibodies C219 (MDR1) and M2III-6 (MRP2). Lanes were loaded with either 50 μg or 25 μg protein. Coomassie blue staining confirmed equal protein loading in the appropriate lanes.
Figure 8 contrasts the ability of Caco-2 and T84 cells to secrete cholic acid and the fluoroquinolones grepafloxacin and ciprofloxacin. All three substrates were subject to net basal-to-apical secretion by Caco-2 monolayers.
Figure 8.
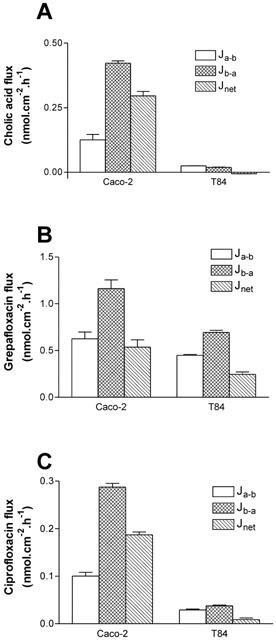
Transepithelial fluxes of cholic acid, grepafloxacin, and ciprofloxacin across Caco-2 and T84 monolayers. (A) [3H]-cholic acid fluxes were determined using 10 μM unlabelled cholic acid in apical/basal bathing solutions. (B) Grepafloxacin fluxes were determined using 10 μM in either apical or basal solutions, with the appropriate trans-compartment without drug. (C) [14C]-ciprofloxacin fluxes were determined using 10 μM unlabelled ciprofloxacin in apical/basal bathing solutions. For grepafloxacin, n=6 monolayers per data point. For cholic acid, n=3 (Caco-2) or 4 (T84) monolayers per data point. For ciprofloxacin, n=7 (Caco-2) or 6 (T84).
In contrast to Caco-2 cells, cholic acid was not subject to secretion by T84 monolayers (Figure 8A). Since cholic acid was not secreted by MDCKII-MDR1 cell monolayers, it is likely that the lack of secretory transport by the T84 monolayers may be attributed to the lack of MRP2 expression. It should be noted that cellular cholic acid accumulation (substrate concentration 10 μM) across the basolateral membrane of T84 monolayers was similar to that in Caco-2 cells (T84 Ab 17.79±0.97 μM, n=11, vs Caco-2 Ab 19.98±1.24 μM, n=4; P>0.05), indicating that lack of permeation across the basolateral membranes cannot explain the absence of cholic acid secretion by T84 cells.
Grepafloxacin was secreted by T84 monolayers (Figure 8B); the basal-to-apical transport (0.69±0.02 nmol.cm−2.h−1, n=6), however, was substantially lower than that observed for Caco-2 cells (1.16±0.09 nmol.cm−2.h−1, n=6; P<0.05 vs T84). In fact, the apparent Vmax for net secretion of grepafloxacin (determined in a separate set of experiments) was reduced to 5.92±1.56 nmol.cm−2.h−1 in T84 cells (n=4), compared with the corresponding value in Caco-2 cells at 16.89±3.38 nmol.cm−2.h−1 (n=4; P<0.05 Caco-2 vs T84). Given that the level of MDR1 protein expression is similar in both cell types (Figure 7), these data are consistent with the lower Vmax value in T84 monolayers resulting from the lack of detectable MRP2 protein expression in this cell line. The fact that cholic acid and grepafloxacin show cross-inhibition of secretion by Caco-2 monolayers, and that cholic acid secretion is also inhibited by the MRP-selective inhibitor MK-571, suggests that MRP2 may mediate both cholic acid and grepafloxacin secretion.
Ciprofloxacin was subject to secretion across Caco-2 but not T84 monolayers (Figure 8C), confirming that MDR1 does not contribute to ciprofloxacin secretory transport. Accumulation of ciprofloxacin across the basolateral membrane of T84 cells was greater than that in Caco-2 cells (T84 Ab 59.15±1.72 μM, n=6, vs Caco-2 Ab 11.26±0.84 μM, n=7), again confirming that the lack of ciprofloxacin secretion across the apical membrane of T84 cells is not due to impermeability of ciprofloxacin across the basolateral membrane.
Contribution of MRP2 to the transport of fluoroquinolones including ciprofloxacin
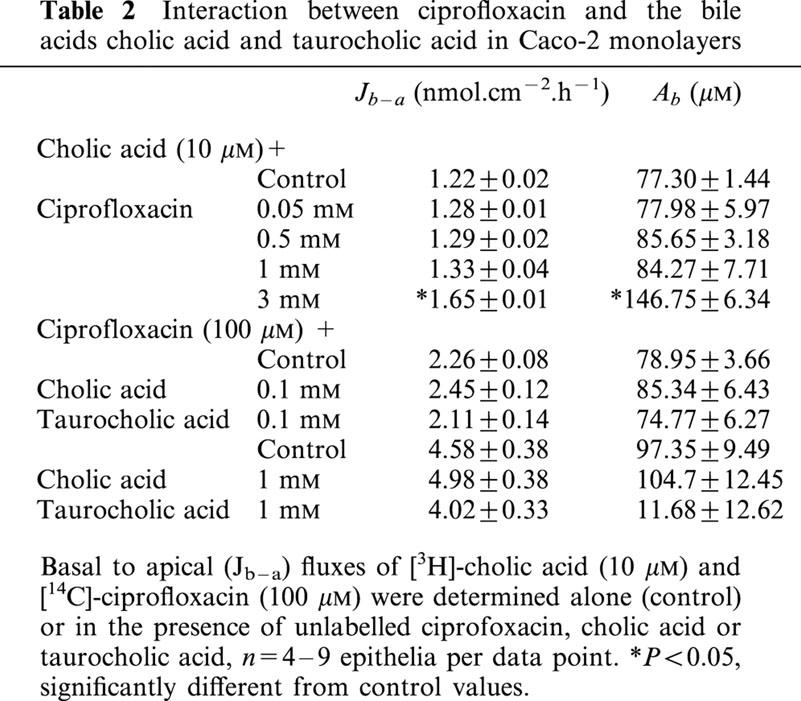
In order to investigate further the overall contribution of MRP2 to the transport of fluoroquinolone antibiotics, we examined the ability of other fluoroquinolones (all at 3 mM) to interact with cholic acid secretion in Caco-2 monolayers. Figure 9 shows that ofloxacin, norfloxacin, and pefloxacin all significantly reduced the net secretion of cholic acid transport, mainly by a reduction in the basal-to-apical flux. However, of these three fluoroquinolones, only pefloxacin increased the accumulation of cholic acid at the basolateral membrane (Ab), consistent with inhibition of exit across the basolateral membrane. Norfloxacin reduced Ab, suggesting that competition for entry into the cell across the basolateral membrane occurred, whereas ofloxacin caused no apparent alteration in cholic acid accumulation across either membrane, suggesting a balance of inhibition at both the entry and exit sites for cholic acid in the basal-to-apical direction. Ciprofloxacin failed to inhibit cholic acid secretion (Figure 9a); in fact, there was a small but significant stimulation in the basal-to-apical flux, which was reflected as an increase in accumulation across the basolateral membrane (Figure 9b). However, this was limited to the highest testable concentration of ciprofloxacin (3 mM due to solubility limits), and following further investigation into the concentration-response relationship (Table 2), it was apparent that lower concentrations of ciprofloxacin were without effect. The effects of bile acids themselves on ciprofloxacin secretion (100 μM) in Caco-2 monolayers were then investigated. Cholic acid and taurocholic acid, at both low (100 μM) and high concentrations (1 mM), failed to exert any inhibitory effect on ciprofloxacin transport or intracellular accumulation in Caco-2 monolayers (Table 2). We also tested the ability of MK-571 to inhibit ciprofloxacin secretion. In the control condition, Jnet was 187±14 pmol.cm−2.h−1 (n=4); in the presence of 10 μM and 25 μM MK-571, Jnet was 234±4 and 194±9 pmol.cm−2.h−1, respectively (both n=4, P>0.05 vs control). The lack of effect at 25 μM MK-571 contrasts to the inhibition of cholic acid secretion at the same concentration of MK-571 observed in Figure 6. However, at 50 μM MK-571, ciprofloxacin Jnet was reduced by 59% (to 37±37 pmol.cm−2.h−1; n=4, P<0.05), but this occurred solely through an increase in Ja-b. Taken together, these data suggest that ciprofloxacin, unlike grepafloxacin, appears not to be a substrate for MRP2.
Figure 9.
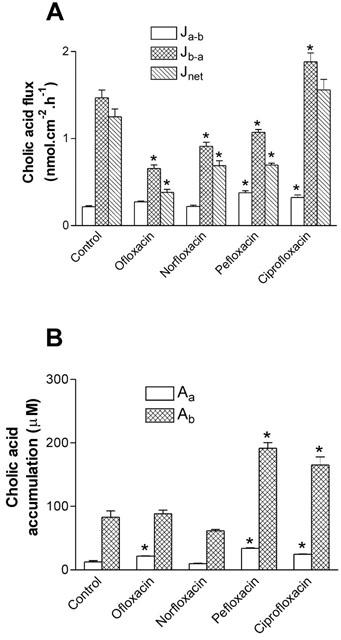
Effect of fluoroquinolone antibiotics on the bi-directional fluxes of cholic acid across Caco-2 monolayers. (A) Transepithelial [3H]-cholic acid (10 μM fluxes were measured alone and in the presence of various fluoroquinolones (3 mM) in both the apical and basolateral compartments. Jnet was calculated as Jb-a – Ja-b. (B) Cellular cholic acid from apical or basal bathing solutions in the presence of various fluoroquinolones. n=4 single epithelia (uptake data) or paired epithelia (flux data) per data point. *P<0.05, significantly different from control values.
Table 2.
Interaction between ciprofloxacin and the bile acids cholic acid and taurocholic acid in Caco-2 monolayers
Discussion
The fluoroquinolones are a group of structurally similar compounds; the only difference between ciprofloxacin and grepafloxacin is that grepafloxacin has two additional methyl groups, one at position 5 in the heterocyclic ring, and the other in the piperazine ring (Figure 10). The calculated absorptive permeability across Caco-2 monolayers for grepafloxacin was 7.6×10⁻² cm.h−1, which exceeded that for ciprofloxacin (1.9×10⁻² cm.h−1, Griffiths & Simmons 1994). Grepafloxacin has enhanced lipophilicity compared to ciprofloxacin, as evidenced by their relative partition coefficient (log P) values. These values are quoted as 0.66 for grepafloxacin (Ito et al., 1999) and 0.025 for ciprofloxacin (manufacturer's data sheet). In addition to grepafloxacin absorption, and consistent with the findings of Yamaguchi et al. (2000), the present data show that grepafloxacin is secreted by an active process across Caco-2 intestinal epithelia. Concurrent with net secretion, we demonstrate apparent cellular accumulation of grepafloxacin in both Caco-2 cells and in MDCKII epithelia. It is possible that both the enhanced absorption and the increased cellular permeability of grepafloxacin in Caco-2 and MDCKII epithelia may represent dissolution in membrane lipids, or alternatively, access to additional transport systems.
Figure 10.
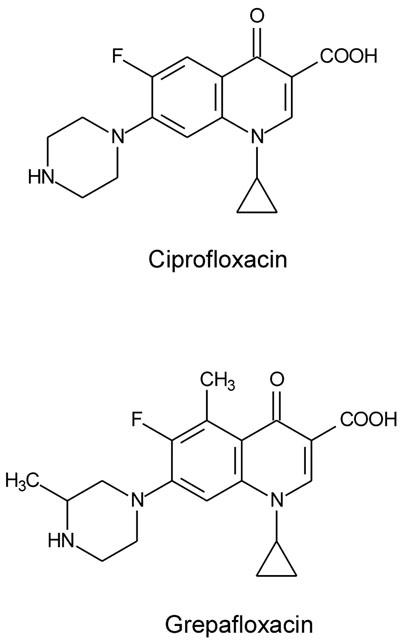
Molecular structures of the fluoroquinolone antibiotics ciprofloxacin and grepafloxacin.
Due to the sensitivity of grepafloxacin secretory fluxes to cyclosporin A, Yamaguchi et al. (2000) concluded that both grepafloxacin and levofloxacin were MDR1 substrates. Using MDR1-transfected MDCKII cells, we have confirmed that grepafloxacin shows an enhanced transepithelial secretion in MDCK-MDR1 layers compared with MDCKII controls, in a similar manner to that observed with vinblastine, a known MDR1 substrate. Grepafloxacin accumulation in MDCKII-MDR1 cells is not reduced compared to the wild type MDCKII cells. This behaviour is different from that observed with vinblastine, where marked reductions are observed upon MDR1 transfection. The basis for this difference is not known, but the accumulation of grepafloxacin may not be homogeneous, or even cytosolic; calculation of unidirectional permeabilities in MDCKII-MDR1 transfectants may therefore be in doubt (see Results), since intracellular substrate is assumed to be evenly distributed within the cytosol. The access of some substrates to MDR1 has been hypothesized to occur via the membrane lipid rather than the cytosol (Stein, 1997). When dissolution of substrate in lipid exceeds the ability of MDR1 to extract it, substrate concentrations within lipids will be limited mainly by the physicochemical constraints of partitioning from aqueous to lipid phases (Stein, 1997). Clearly, either the location or local concentration (via cytosol or lipid) must differ between vinblastine and grepafloxacin in order to explain the grepafloxacin accumulation data in MDCK-MDR1 epithelial layers.
Using mdr1a (−/−) knockout mice, DeLange et al. (2000) have studied the permeation of a number of fluoroquinolones into brain; they found only limited permeation of norfloxacin, ciprofloxacin and fleroxacin, but enhanced permeation of sparfloxacin compared to normal controls. This suggested that sparfloxacin was an mdr1a substrate, but that ciprofloxacin was not. Using MDR1 transfected LLC-PK1 cell monolayers, DeLange et al. (2000) showed that whereas norfloxacin and ciprofloxacin transport showed no asymmetry, sparfloxacin, fleroxacin and pefloxacin were subject to net secretion. Our present data using native MDCKII cell layers (Hunter et al., 1993b) and MDCKII-MDR1 epithelial monolayers also show a marked difference between the ability of fluoroquinolones to be subjected to MDR1-mediated secretion; thus ciprofloxacin is not subjected to transepithelial secretion either by native MDCKII cell monolayers nor MDCKII-MDR1 transfected epithelia. Ciprofloxacin, ofloxacin, norfloxacin and pefloxacin are all incapable of inhibition of vinblastine secretion by MDCK-MDR1 cell monolayers. The possession of two additional methyl groups by grepafloxacin, relative to ciprofloxacin, therefore appears to confer the ability of enhanced secretion by MDCKII-MDR1 cell layers. These data are in agreement with our previous studies on ciprofloxacin transport, which showed that the anti-MDR1 monoclonal antibodies MRK16 and UIC2, which have been shown to be effective inhibitors of P-glycoprotein transport activity (Hunter et al., 1993c), and which inhibited vinblastine secretion, had no effect on the secretory flux of ciprofloxacin in Caco-2 cells (Cavet et al., 1997). The differential handling of grepafloxacin and ciprofloxacin by MDCKII-MDR1 cells is different from the observation that both fluoroquinolones undergo secretion by Caco-2 cells. It is evident, therefore, that fluoroquinolones are secreted by at least two distinct mechanisms in Caco-2 cells.
Grepafloxacin inhibited ciprofloxacin secretion, and in addition increased its cellular (basolateral) accumulation. Calculation of the unidirectional ciprofloxacin permeabilities at both the apical and basolateral membranes shows that grepafloxacin increases the ratio of permeabilities across the basolateral membrane (Pb-c/Pc-b) through a decrease in Pc-b. Thus ‘active' accumulation at the basolateral membrane is not altered. The main site of inhibition by grepafloxacin is at the apical membrane; Pc-a, the rate-limiting step, is markedly reduced. This is consistent with grepafloxacin inhibiting an apical ABC-type transporter mediating ciprofloxacin secretion. Thus it is likely that grepafloxacin secretion itself does not involve MDR1 alone, but rather multiple pathways mediating grepafloxacin exit.
In a similar manner to grepafloxacin inhibition of ciprofloxacin transport, it is apparent that grepafloxacin inhibits cholic acid secretion by Caco-2 epithelia. As with ciprofloxacin, cholic acid is neither secreted by MDCKII cell monolayers nor by MDCKII-MDR1 transfected cell monolayers. Cholic acid is therefore not a substrate for MDR1. It is likely that cholic acid, as with certain other bile salts, is a substrate for MRP2 (cMOAT) action (Müller & Jansen, 1997; Akita et al., 2001).
In order to confirm a role for MRP2 in cholic acid secretion, we have used the MRP-selective inhibitor MK-571. Although MK-571 is an inhibitor of several MRP family members, the only MRP family member shown at present to be expressed at the apical membrane of intestinal epithelia is MRP2 (Cui et al., 1999; Müller & Jansen, 1997). At a high dose (50 μM), MK-571 was an effective inhibitor of cholic acid secretion, consistent with MRP2 involvement at the apical membrane.
At lower concentrations of MK-571 (<10 μM), rather than showing an inhibition of secretion, there was an apparent stimulation of the basal-to-apical transport (and hence net secretion) of cholic acid. This was surprising, but a number of explanations are possible. Firstly, MK-571 is a potent leukotriene receptor antagonist (Jones et al., 1989). Bile acids are known to stimulate the release of LTC4 in human jejunum (Casellas et al., 1991), and LTB4 synthesis in Caco-2 cells (Dias et al., 1994). Thus leukotriene receptor blockade may remove an inhibitory regulation on transport. Leukotrienes and MK-571, however, are both agonists for the peroxisome proliferator activated receptor (PPAR) nuclear receptor family (Boie et al., 1993), and since MRP2 itself possesses a PPAR regulatory site on its 5′-untranslated region (Stöckel et al., 2000), PPAR activation would result in an increase in MRP2 mRNA levels, and subsequently MRP2 expression. It is also possible that MRP2 at the apical brush-border membrane is dynamically regulated. For example, a recent study using liver has demonstrated that intracellular pools of ABC transporter proteins, including sister P-glycoprotein (the liver bile salt export pump BSEP), MDR1, and MDR3, can be localized to the canalicular membrane within 15 min given an appropriate stimulus (cyclic AMP or taurocholic acid) (Kipp et al., 2001). Thus, it may be possible that MRP2 is regulated in an analogous way in the intestine via second messenger systems. Finally, it is possible that the apparent stimulatory effect of lower concentrations of MK-571 on cholic acid secretion was due to a direct action on MRP2. A recent study has postulated that, owing to substrate-protein binding characteristics, certain ABC transporter substrates/inhibitors may stimulate ATPase activity at lower concentration and inhibit ATPase activation at higher concentrations (Seelig & Landwojtowicz, 2000).
An alternative method to investigate the role of MRP2 in cholic acid secretion is the use of T84 cell layers. Although T84 cells express MDR1, the current data provide no evidence for MRP2 protein expression. This is in contrast to Caco-2 cells, which express both MDR1 and MRP2. The absence of cholic acid secretion across monolayers of T84 cells is therefore consistent with cholic acid not being an MDR1 substrate, but is also consistent with MRP2 mediating secretion in Caco-2 cells. Since grepafloxacin is capable of inhibition of cholic acid secretion across Caco-2 monolayers, this indicates that MRP2 may also be involved in grepafloxacin secretion in Caco-2 epithelia.
The conclusion that grepafloxacin transport is also mediated by MRP2 is supported by studies carried out in rodent liver. For example, in MRP2-deficient rats, Sasabe et al. (1998) found that the hepatobiliary clearance of grepafloxacin was reduced by 38%, whereas the excretion of the 3-glucuronide metabolite via the same route was completely abolished. Not only do Sasabe et al. (1998) show here that grepafloxacin is an MRP2 substrate, it also clear from the data that grepafloxacin secretion in the liver must be mediated by multiple secretory transporters. As well as expressing MRP2, the canalicular membranes of human hepatocytes also functionally express MDR1 (Schuetz et al., 1995). Therefore both MRP2 and MDR1 are likely to contribute to the hepatic secretion of grepafloxacin.
Although grepafloxacin may inhibit ciprofloxacin secretion in Caco-2 epithelia, ciprofloxacin is without effect upon cholic acid secretion (present data). Taken together with the lack of ciprofloxacin secretion by T84 monolayers, grepafloxacin must be secreted across Caco-2 monolayers by at least three distinct mechanisms (MDR1, MRP2, and a pathway shared with ciprofloxacin). Interestingly, the exact mechanism of ciprofloxacin efflux across the apical membrane of Caco-2 cells (and human intestine) still remains elusive (Griffiths et al., 1993; 1994; Cavet et al., 1997). Although ciprofloxacin secretion shows ATP-dependence, and sensitivity to MDR1 blocking agents such as verapamil (Cavet et al., 1997), it is clear that MDR1 does not in fact contribute to ciprofloxacin secretion, owing to the lack of inhibition by the anti-MDR1 monoclonal antibodies MRK16 and UIC2 (Cavet et al., 1997), and the lack of enhanced secretion by MDR1-transfected MDCKII or T84 cells (present data).
Analysis of the expression of MRP-family members expressed in Caco-2 cells suggests that MRP1, 2, 3 and 5 are present (Hirohashi et al., 2000; Taipalensuu et al., 2001), although some workers find expression only of the basolateral MRP1 (Evers et al., 1996; Gutmann et al., 1999). Notwithstanding the uncertainty regarding the exact extent of the expression of MDR- and MRP-type proteins in Caco-2 cells, the important conclusion that emerges from the present data is that the effective impermeability of the gastrointestinal tract to certain compounds (Hunter et al., 1993a) is maintained by multiple ABC transporters, with overlapping specificities, acting in concert. Grepafloxacin is mediated by three secretory mechanisms located at the apical membrane: MDR1, MRP2, and a third, distinct, ciprofloxacin-sensitive mechanism, which remains to be identified. Further work must explore the extent to which these transporters can be further sub-divided on the basis of the pharmacological sensitivity and the ability of compounds to cross-inhibit each other's secretion.
Acknowledgments
S. Lowes was a BBSRC-CASE student with GlaxoSmithKline Research and Development Ltd. [14C]-ciprofloxacin was a generous gift from Dr U. Pleiß, Bayer AG Institut für Pharmacokinetik, Wuppertal, Germany). We gratefully acknowledge the help of Dr Richard Eastmond and Caroline Clegg at GlaxoSmithKline for MS-HPLC. The authors would also like to thank Dr Kevin Read (GlaxoSmithKline) for his excellent advice regarding the MDCKII-MDR1 cells.
Abbreviations
- ABC
ATP binding cassette
- BSEP
bile salt export pump
- cMOAT
canalicular multispecific organic anion transporter (MRP2)
- MDCK
Madin-Darby canine kidney cells
- MDR
multidrug resistance gene product
- MK-571
(3-(3-(2-(7-chloro-2-quinolinyl)ethenyl)phenyl)((3-dimethyl amino-3-oxopropyl)thio)methyl)thio)propanoic acid
- MRP
multidrug resistance-associated protein
- PPAR
peroxisome proliferator activated receptor
References
- AKITA H., SUZUKI H., ITO K., KINOSHITA S., SATO N., TAKIKAWA H., SUGIYAMA Y. Characterization of bile acid transport mediated by multidrug resistance associated protein 2 and bile salt export pump. Biochim. Biophys. Acta. 2001;1511:7–16. doi: 10.1016/s0005-2736(00)00355-2. [DOI] [PubMed] [Google Scholar]
- BARKER G., SIMMONS N.L. Identification of two strains of cultures canine renal epithelial cells (MDCK cells) which display entirely different physiological properties. Q. J. Exp. Physiol. 1981;66:61–72. doi: 10.1113/expphysiol.1981.sp002529. [DOI] [PubMed] [Google Scholar]
- BOIE Y., ADAM M., RUSHMORE T.H., KENNEDY B.P. Enantioselective activation of the peroxisome proliferator-activated receptor. J. Biol. Chem. 1993;268:5530–5534. [PubMed] [Google Scholar]
- BÜCHLER M., KÖNIG J., BROM M., KARTENBECK J., SPRING H., HORIE T., KEPPLER D. cDNA cloning of the hepatocyte canalicular isoform of the multidrug resistance protein, cmrp, reveals a novel conjugate export pump deficient in hyperbilirubinemic mutant rats. J. Biol. Chem. 1996;271:15091–15098. doi: 10.1074/jbc.271.25.15091. [DOI] [PubMed] [Google Scholar]
- CASELLAS F., GUARNER F., RODRIGUEZ R., MALAGELADA J.R. Human jejunal LTC4 response to irritant bile-acids. J. Gastroenterol.Hepatol. 1991;3:393–397. [Google Scholar]
- CAVET M.E., WEST M., SIMMONS N.L. Transport and epithelial secretion of the cardiac glycoside by human intestinal epithelial Caco-2 cells. Br. J. Pharmacol. 1996;118:1389–1396. doi: 10.1111/j.1476-5381.1996.tb15550.x. [DOI] [PMC free article] [PubMed] [Google Scholar]
- CAVET M.E., WEST M., SIMMONS N.L. Fluoroquinolone (ciprofloxacin) secretion by human intestinal epithelial (Caco-2) cells. Br. J. Pharmacol. 1997;121:1567–1578. doi: 10.1038/sj.bjp.0701302. [DOI] [PMC free article] [PubMed] [Google Scholar]
- CUI Y., KÖNIG J., BUCHHOLZ U., SPRING H., LEIER I., KEPPLER D. Drug resistance and ATP-dependent conjugate transport mediated by the apical multidrug resistance protein, MRP2, permanently expressed in human and canine cells. Mol. Pharmacol. 1999;55:929–937. [PubMed] [Google Scholar]
- DELANGE E.C.M., MARCHAND S., VAN DEN BERG D.-J., VAN DEN SANDT I.C.J., DE BOER A.G., DELON A., BOUQUET S., COUET W. In vitro and in vivo investigations on fluoroquinolones; effects of the P-glycoprotein efflux transporter on brain distribution of sparfloxacin. Eur. J. Pharm. Sci. 2000;12:85–93. doi: 10.1016/s0928-0987(00)00149-4. [DOI] [PubMed] [Google Scholar]
- DIAS V.C., SHAFFER E.A., WALLACE J.L., PARSONS H. G. Bile salts determine Leukotriene B4 synthesis in a human intestinal cell-line. Dig. Dis. Sci. 1994;39:802–808. doi: 10.1007/BF02087427. [DOI] [PubMed] [Google Scholar]
- EVERS R., ZAMAN C.G.R., VAN DEETMER L., JANSEN H., CALAFAT J., OOMEN L.C.J.M., ELFERINK P.J.O., BORST P., SCHINKEL A.H. Basolateral localisation and export activity of the human multidrug resistance-associated protein in polarised pig kidney cells. J. Clin. Invest. 1996;97:1211–1218. doi: 10.1172/JCI118535. [DOI] [PMC free article] [PubMed] [Google Scholar]
- GRIFFITHS N.M., HIRST B.H., SIMMONS N.L. Active secretion of the fluoroquinolone ciprofloxacin by human intestinal epithelial Caco-2 cell layers. Br. J. Pharmacol. 1993;108:575–576. doi: 10.1111/j.1476-5381.1993.tb12844.x. [DOI] [PMC free article] [PubMed] [Google Scholar]
- GRIFFITHS N.M., HIRST B.H., SIMMONS N.L. Active intestinal secretion of the fluoroquinolone antibacterials ciprofloxacin, norfloxacin and pefloxacin; a common secretory pathway. J. Pharmacol. Exp. Ther. 1994;269:496–502. [PubMed] [Google Scholar]
- GUTMANN H., FRICKER G., TÖRÖK M., MICHAEL S., BEGLINGER C., DREWE J. Evidence for different ABC-transporters in Caco-2 cells modulating drug uptake. Pharm. Res. 1999;16:402–407. doi: 10.1023/a:1018825819249. [DOI] [PubMed] [Google Scholar]
- HIROHASHI T., SUZUKI H., CHU X.-Y., TAMAI I., TSUJI A., SUGIYAMA Y. Function and expression of multidrug resistance-associated protein family in human colon adenocarcinoma cells (Caco-2) J. Pharmacol. Exp. Ther. 2000;292:265–270. [PubMed] [Google Scholar]
- HORIO M., CHIN K.V., CURRIER S.J., GOLDENBERG S., WILLIAMS C., PASTAN I., GOTTESMAN M.M., HANDLER J. Transepithelial transport of drugs by the multidrug transporter in cultured Madin-Darby canine kidney cell epithelia. J. Biol. Chem. 1989;264:14880–14884. [PubMed] [Google Scholar]
- HUNTER J., HIRST B.H., SIMMONS N.L. Drug absorption limited by P-glycoprotein-mediated secretory drug transport in human intestinal epithelial Caco-2 cell layers. Pharm. Res. 1993a;10:743–749. doi: 10.1023/a:1018972102702. [DOI] [PubMed] [Google Scholar]
- HUNTER J., HIRST B.H., SIMMONS N.L. Transepithelial secretion, cellular accumulation and cytotoxicity of vinblastine in defined MDCK cell strains. Biochim. Biophys. Acta. 1993b;1179:1–10. doi: 10.1016/0167-4889(93)90069-2. [DOI] [PubMed] [Google Scholar]
- HUNTER J., JEPSON M.A., TSURUO T., SIMMONS N.L., HIRST B.H. Functional expression of P-glycoprotein in apical membranes of human intestinal Caco-2 cells. Kinetics of vinblastine secretion and interaction with modulators. J. Biol. Chem. 1993c;268:14991–14997. [PubMed] [Google Scholar]
- ITO T., YANO I., MASUDA S., HASHIMOTO Y., INUI K. -I. Distribution characteristics of levofloxacin and grepafloxacin in rat kidney. Pharmaceutical Research. 1999;16:534–539. doi: 10.1023/a:1018871029244. [DOI] [PubMed] [Google Scholar]
- JAEHDE U., SORGEL K., NABER K.G., REITER A., SEELMANN R., SIGL G., MUTH P., SCHUNACK W. Program and Abstracts of the 29th Interscience Conference on Antimicrobial Agents and Chemotherapy. Washington, DC: American Society for Microbiology. Abstract No. 202; 1989. Gastrointestinal Secretion of Ciprofloxacin (CIP) in Healthy Volunteers. [Google Scholar]
- JONES T.R., ZAMBONI R., BELLEY M., CHAMPION E., CHARETTE L., FORDHUTCHINSON A.W., FRENETTE R., GAUTHIER J.Y., LEGER S., MASSON P., MCFARLANE C.S., PIECHUTA H., ROKACH J., WILLIAMS H., YOUNG R.N., DEHAVEN R.N., PONG S.S. Pharmacology of L-660,711 (MK-571) – a novel potent and selective Leukotriene-D4 receptor antagonist. Can. J. Physiol. Pharmacol. 1989;67:17–28. doi: 10.1139/y89-004. [DOI] [PubMed] [Google Scholar]
- KIPP H., PICHETSHOTE N., ARIAS I.M. Transporters on demand – intrahepatic pools of canalicular ATP binding cassette transporters in rat liver. J. Biol. Chem. 2001;276:7218–7224. doi: 10.1074/jbc.M007794200. [DOI] [PubMed] [Google Scholar]
- KOOL M., DE HAAS M., SCHEFFER G.L., SCHEPER R.J., VAN EIJK M.J.T., JUIJN J.A., BAAS F., BORST P. Analysis of the expression of cMOAT (MRP2), MRP3, MRP4, and MRP5 homologues of the multi-drug resistance protein gene (MRP1) in human cell lines. Cancer Res. 1997;57:3527–3547. [PubMed] [Google Scholar]
- LOWES S., SIMMONS N.L. Human intestinal cell monolayers are preferentially sensitive to disruption of barrier function from basolateral exposure to cholic acid: correlation with membrane transport and transepithelial secretion. Pflügers Archiv. 2001;443:265–273. doi: 10.1007/s004240100686. [DOI] [PubMed] [Google Scholar]
- MATSUO Y., YANO I., ITO T., HASIMOTO Y., INUI K.-I. Transport of quinolone antibacterial drugs in a kidney epithelial cell line, LLCPK1. J. Pharmacol. Exp. Ther. 1998;287:672–678. [PubMed] [Google Scholar]
- MÜLLER M., JANSEN P.L.M. Molecular aspects of hepatobiliary transport. Am. J. Physiol. 1997;272:G1285–G1303. doi: 10.1152/ajpgi.1997.272.6.G1285. [DOI] [PubMed] [Google Scholar]
- NAFTALIN R., CURRAN P.F. Galactose transport in rabbit ileum. J. Membr. Biol. 1974;16:257–278. doi: 10.1007/BF01872418. [DOI] [PubMed] [Google Scholar]
- PARRY M.F., SMEGO D.A., DIGIOVANNI M.A. Hepatobiliary kinetics and excretion of ciprofloxacin. Antimicrobial Agents Chemother. 1988;32:982–985. doi: 10.1128/aac.32.7.982. [DOI] [PMC free article] [PubMed] [Google Scholar]
- ROHWEDDER R., BERGAN T., THORSTEINSSON S.B., SCHOLL H. Transintestinal elimination of ciprofloxacin. Chemotherapy. 1990;36:77–84. doi: 10.1159/000238751. [DOI] [PubMed] [Google Scholar]
- SASABE H., KATO Y., TSUJI A., SUGIYAMA Y. Stereoselective and hepatobiliary transport of the quinolone antibiotic grepafloxacin and its glucuronide in the rat. J. Pharmacol. Exp. Ther. 1998;284:661–668. [PubMed] [Google Scholar]
- SCHUETZ E.G., FURUYA K.N., SCHUETZ J.D. Interindividual variation in expression of P-glycoprotein in normal human liver and secondary hepatic neoplasms. J. Pharmacol. Exp. Ther. 1995;275:1011–1018. [PubMed] [Google Scholar]
- SEELIG A., LANDWOJTOWICZ E. Structure-activity relationship of P-glycoprotein substrates and modifiers. Eur. J. Pharm. Sci. 2000;12:31–40. doi: 10.1016/s0928-0987(00)00177-9. [DOI] [PubMed] [Google Scholar]
- SÖRGEL F., NABER K.G., JAEHDE U., REITER A., SEELMAN R., SIGL G. Brief Report: Gastrointestinal Secretion of Ciprofloxacin. Evaluation of the Charcoal Model for Investigations in Healthy Volunteers. Am. J. Med. 1989;87:62S–65S. doi: 10.1016/0002-9343(89)90025-9. [DOI] [PubMed] [Google Scholar]
- SÖRGEL F., NABER K.G., KINZIG M., MAHR G., MUTH P. Comparative pharmacokinetics of ciprofloxacin and temafloxacin in humans: A review. Am. J. Med. 1991;91:51S–65S. doi: 10.1016/0002-9343(91)90312-l. [DOI] [PubMed] [Google Scholar]
- STEIN W.D. Kinetics of the multidrug transporter (P-Glycoprotein) and its reversal. Phys. Rev. 1997;77:545–590. doi: 10.1152/physrev.1997.77.2.545. [DOI] [PubMed] [Google Scholar]
- STÖCKEL B., KÖNIG J., NIES A.T., CUI Y., BROM M., KEPPLER D. Characterisation of the human multidrug resistance protein 2 (MRP2) gene and its regulation in comparison with the multidrug resistance protein 3 (MRP3) gene. Eur. J. Biochem. 2000;267:1347–1358. doi: 10.1046/j.1432-1327.2000.01106.x. [DOI] [PubMed] [Google Scholar]
- TAIPALENSUU J., TÖRNBLOM H., LINDBERG G., EINARSSON C., SJÖQVIST F., MELHUS H., GARBERG P., SJÖSTRÖM B., LUNGDREN B., ARTURSSON P. Correlation of gene expression of ten drug efflux proteins of the ATP-binding cassette transporter family in normal human jejunum and in human intestinal epithelial Caco-2 cell monolayers. J. Pharmacol. Exp. Ther. 2001;299:174–170. [PubMed] [Google Scholar]
- YAMAGUCHI H., YANO I., HASIMOTO Y., INUI K.-I. Secretory mechanisms of grepafloxacin and levofloxacin in the human intestinal cell line Caco-2. J. Pharmacol. Exp. Ther. 2000;295:360–366. [PubMed] [Google Scholar]


