Abstract
Streptavidin is a 60-kDa tetramer which binds four molecules of biotin with extremely high affinity (KA∼1014 M−1). We have used atomic force microscopy (AFM) to visualize this ligand-protein interaction directly.
Biotin was tagged with a short (152-basepair; 50-nm) DNA rod and incubated with streptavidin. The resulting complexes were then imaged by AFM. The molecular volume of streptavidin calculated from the dimensions of the protein particles (105±3 nm3) was in close agreement with the value calculated from its molecular mass (114 nm3). Biotinylation increased the apparent size of streptavidin (to 133±2 nm3), concomitant with an increase in the thermal stability of the tetramer.
Images of streptavidin with one to four molecules of DNA-biotin bound were obtained. When two ligands were bound, the angle between the DNA rods was either acute or obtuse, as expected from the relative orientations of the biotin binding sites. The ratio of acute : obtuse angles (1 : 3) was lower than the expected value (1 : 2), indicating a degree of steric hindrance in the binding of the DNA-biotin. The slight under-representation of higher occupancy states supported this idea.
Streptavidin with a single molecule of DNA-biotin bound was used to tag biotinylated β-galactosidase, a model multimeric enzyme.
The ability to image directly the binding of a ligand to its protein target by AFM provides useful information about the nature of the interaction, and about the effect of complex formation on the structure of the protein. Furthermore, the use of DNA-biotin/streptavidin tags could potentially shed light on the architecture of multi-subunit proteins.
Keywords: Biotin, streptavidin, protein complex, AFM, single-molecule imaging
Introduction
The interaction of receptors with small ligands is most commonly studied using radioligand binding. This approach is well-documented, and provides valuable quantitative information, such as the affinity of the binding interaction. Radioligand binding cannot, however, shed any light on the structure of the ligand-receptor complex, or on the effect of ligand binding on receptor structure. These are important issues, especially as it is becoming clear that the structure and function of many proteins are modulated by ligand binding. For instance, the binding of two molecules of acetylcholine to the nicotinic receptor causes the five-subunit assembly to open a central cation channel (Karlin, 1987; Unwin, 1998). We are developing methods for imaging proteins under near-physiological conditions using atomic force microscopy (AFM; see, for example, Ellis et al., 1999a,1999b; Berge et al., 2000). In the present study we have used AFM to visualize directly the binding of a small ligand to a multi-subunit protein.
The interaction between biotin and streptavidin provides an ideal system for our purpose. Streptavidin is a 60-kDa protein produced by the bacterium Streptomyces avidinii (Green, 1990). The complex of streptavidin with biotin has been crystallized, and its structure solved at high resolution (Weber et al., 1989; Hendrickson et al., 1989). Furthermore, extensive mutational analysis has been carried out to identify the requirements and consequences of ligand binding (Freitag et al., 1998; 1999; Klumb et al., 1998; Stayton et al., 1999). The protein is tetrameric and has 222 point symmetry. The tetramer is composed of two dimers, within which the monomers are in intimate contact. In contrast, the dimers interact over a much less extensive interface (Weber et al., 1989; Hendrickson et al., 1989). The streptavidin tetramer binds four molecules of biotin with extremely high affinity (KD∼10−14 M; Green, 1990).
We have modified the ligand, biotin, by addition of a short (152-basepair; 50-nm) DNA rod, which enables its visualization by AFM. We have then studied the binding of the DNA-biotin to individual molecules of streptavidin. We report the characteristics of the binding, and the consequences of the binding for the structure of the protein. Finally, we demonstrate the use of the DNA-biotin/streptavidin complex to tag biotinylated β-galactosidase. We suggest that this approach will be applicable to the study of the architecture of multi-subunit protein assemblies.
Methods
Sample preparation
Biotinylated 152-basepair DNA rods were produced by polymerase chain reaction (PCR) amplification, using Taq polymerase (Promega, Southampton, UK), with pUB 110 plasmid DNA (Sigma, Poole) as template and the primers: 5′-biotin-(15-carbon)-CATCATTCGGCAAATCCTTGAGCC-3′ (forward) and 5′-GGCATTCAGTCACAAAAGGTTGTT-GC-3′ (reverse) (Synthegen, Houston, TX, U.S.A.). The DNA-biotin was purified using a QIAquick PCR purification kit (Qiagen, Crawley, U.K.), and eluted in MilliQ ultrapure water (Millipore Systems, Watford, U.K.) at a concentration of 500 nM.
Streptavidin was purchased from Sigma and used without further purification. Lyophilized streptavidin was reconstituted in 50 mM potassium phosphate buffer pH 7.8, to a concentration of 10 μM. For imaging, streptavidin was diluted to a final concentration of 1 – 10 nM. Where appropriate, streptavidin and DNA-biotin were incubated together at a known molar ratio in a total volume of 100 μl at 22°C for 1 h. All dilutions were carried out using MilliQ water.
Biotinylated β-galactosidase from Escherichia coli, containing on average 2 – 4 biotin molecules per enzyme tetramer, was purchased from Sigma and used without further purification. Lyophilized β-galactosidase was reconstituted by addition of water, to yield a 5 – nM protein solution in 1 mM Tris-HCl, pH 7.4, 1 mM EDTA, 1 mM MgCl2 buffer. Where appropriate, β-galactosidase and DNA-biotin/streptavidin were incubated together at a known molar ratio at 22°C for 1 h.
AFM imaging
Samples were imaged on freshly cleaved, poly-L-lysine (Sigma)-coated, mica coverslips (Goodfellow, Cambridge, U.K.). Before AFM imaging 50 μl of the sample was allowed to adsorb to the surface. After 10 min the sample was washed with water and air-dried. Imaging was performed with a Multimode atomic force microscope (Digital Instruments, Santa Barbara, CA, U.S.A.). Samples were imaged in air, using tapping mode with a root mean square amplitude of 0.7 V and a drive frequency of ∼300 kHz. Silicon cantilevers with a specified spring constant of 42 N m−1 were used (NCH Pointprobes; Nanosensors, Wetzlar-Blankenfeld, Germany). Images were obtained using intermittent tip-sample contact <0.1 nm apart, with an applied force of approximately 200 pN, which produces little lateral movement or distortion of the sample.
Molecular volume calculation
The molecular volume of the protein particles was determined from particle dimensions derived from AFM images. The height and half-height diameters were measured from multiple cross-sections of the same particle, and the molecular volume of each particle was calculated using the following equation, which treats the particle as a spherical cap:
where h is the particle height and r is the radius at half height (Schneider et al., 1998). Molecular volume based on molecular weight was calculated using the equation:
where M0 is the molecular mass of the protein, N0 is Avogadro's number, V1 and V2 are the partial specific volumes of protein and water (0.74 cm3 g−1 and 1 cm3 g−1, respectively), and d is the extent of protein hydration (0.4 mol water/mol protein) (Edstrom et al., 1990).
Values quoted are means±s.e.mean. The statistical significance of differences between means was assessed using Student's t-test for unpaired data.
Probabilities of the various biotinylation states
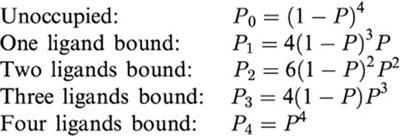
The theoretical probabilities of the various biotinylation states of streptavidin (i.e. unoccupied and occupied by 1 – 4 molecules of biotin) was calculated using the binomial distribution, assuming that all four binding sites are equivalent. The probability of binding is given by:
where NB is the number of occupied sites and NS is the total number of sites. The probabilities of the various occupation states are then as follows:
 |
Determination of the thermal stability of streptavidin
Biotin (Sigma) was mixed with streptavidin (10 μM) at biotin : streptavidin ratios of 0.25 : 1, 0.5 : 1, 1 : 1 or 2 : 1 (total volume 20 μl). These solutions were then incubated at either 22 or 100°C for 30 min. Samples were analysed by SDS-polyacrylamide gel electrophoresis, and proteins were visualized by staining with Coomassie brilliant blue.
Results
Images of the two principal reagents used in this study are shown in Figure 1. Unoccupied streptavidin appeared as a homogenous spread of globular particles (Figure 1A), and DNA-biotin appeared as 50-nm rods (Figure 1B). The observed length of the DNA rods is as expected for a 152-basepair DNA duplex (Sambrook et al., 1989). The forward primer used in the PCR amplification of the DNA has a biotin group at its 5′ end, separated from the first base by a 15-carbon (2.3-nm) spacer. The inclusion of the spacer was found to be essential for efficient binding of the DNA-biotin to streptavidin, presumably because the biotin binding cleft is embedded in the protein structure (Weber et al., 1989; Hendrickson et al., 1989). The biotin/15-carbon ‘tail' was not visible in the images of the DNA rods.
Figure 1.
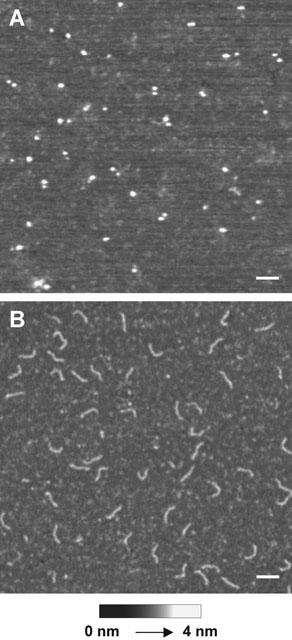
Streptavidin and DNA-biotin imaged by tapping-mode AFM in air. (A) Streptavidin at a concentration of 5 nM was allowed to adsorb to mica at 22°C for 10 min. The mica was then washed with water and air-dried. (B) DNA-biotin at a concentration of 50 nM was adsorbed to mica as in (A). Scale bars: 50 nm. A shade-height scale is shown at the bottom.
The molecular dimensions of unoccupied streptavidin were compared with the dimensions of the biotinylated protein. The heights and diameters of a number of particles were determined and used to calculate molecular volumes. Particle diameter was measured at half the maximal height in order to compensate for the tendency of AFM to overestimate this parameter because of the geometry of the tip (Lärmer et al., 1997; Schneider et al., 1998; Ellis et al., 1999b; Berge et al., 2000). Mean values for particle height, diameter and volume are given in Table 1. A representative image of unoccupied streptavidin is shown in Figure 2A. The distribution of calculated molecular volumes (Figure 2B) is Gaussian, and the mean volume (105±3 nm3; n=237) is very close to the value of 114 nm3 calculated from the molecular mass of the protein (60 kDa), indicating that the particles detected are indeed streptavidin tetramers. When streptavidin was imaged after incubation with biotin, a homogenous spread of particles was seen, as for unoccupied streptavidin (Figure 2C). Interestingly, the molecular volume calculated for the biotinylated streptavidin (141±11 nm3; n=130; Figure 2D, Table 1) was significantly (P<0.0001) greater than the value obtained for unoccupied protein. When streptavidin was incubated with DNA-biotin, and then imaged by AFM, DNA rods of length 50 nm could be seen protruding from the streptavidin molecules. At a molar ratio of DNA-biotin to streptavidin of 1 : 1, the most common structure observed was streptavidin occupied by a single DNA-biotin molecule, giving the imaged particles a tadpole-like appearance; at a ratio of 10 : 1 singly- and doubly-liganded particles were equally common (Figure 2E). As for streptavidin complexed with untagged biotin, the apparent molecular volume of streptavidin occupied by DNA-biotin (133±2 nm3; n=210; Figure 2F, Table 1) was significantly (P<0.0001) greater than that of unoccupied streptavidin. In contrast, the molecular volumes of streptavidin complexed with biotin and with DNA-biotin were not different from each other. As indicated above, the standard error for the volume of the biotin/streptavidin complex is larger than the errors for unoccupied streptavidin and DNA-biotin/streptavidin. Two factors are likely to contribute to this larger error: first, the number of samples analysed was smaller, and second, there is likely to be a small population of unbiotinylated streptavidin molecules in the ‘biotinylated' sample that cannot be identified. Since the affinity of streptavidin for biotin is very high, this population will be very small; however, it might lead to a slight underestimation of the molecular volume of the biotinylated streptavidin, and an increase in the standard error.
1.
Dimensions of unoccupied and biotinylated streptavidin molecules, as determined by tapping-mode AFM in air

Figure 2.
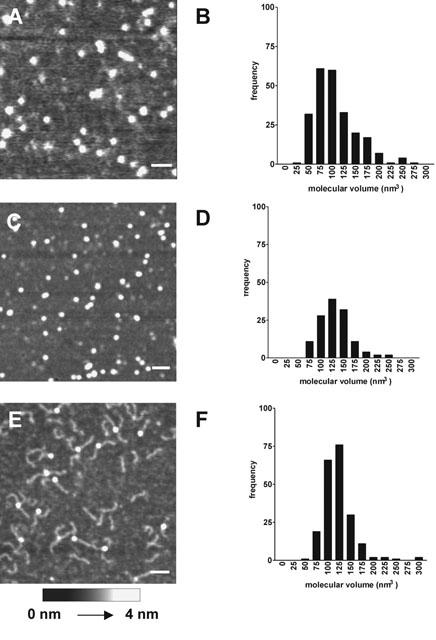
Effect of biotinylation on the structure of streptavidin. (A) Scan of unoccupied streptavidin (5 nM) imaged by tapping-mode AFM in air. (B) Distribution of calculated molecular volumes of unoccupied streptavidin. Volumes were placed in 25-nm3 bins. (C) Scan of streptavidin complexed with biotin. Streptavidin (5 nM) was incubated with biotin (10 nM) for 1 h at 22°C before adsorption to mica. (D) Distribution of calculated molecular volumes of biotinylated streptavidin. (E) Scan of streptavidin complexed with DNA-biotin. Streptavidin (5 nM) was incubated with DNA-biotin (50 nM) for 1 h at 22°C before adsorption to mica. (F) Distribution of calculated molecular volumes of streptavidin complexed with DNA-biotin. Scale bars: 50 nm. A shade-height scale is shown at the bottom.
The observed increase in the apparent molecular volume of streptavidin on biotinylation was accompanied by an increase in its thermal stability, which has been reported previously (González et al., 1997; 1999). When streptavidin was incubated for 30 min at room temperature (22°C) with biotin at various biotin : streptavidin molar ratios and then analysed by SDS – PAGE under non-reducing conditions, the protein migrated exclusively as a tetramer (apparent molecular mass 66 kDa) in all cases (Figure 3A). In contrast, when the unoccupied protein was incubated for 30 min at 100°C, it ran almost exclusively as a monomer (apparent molecular mass 14 kDa; Figure 3B). As the molar ratio of biotin : streptavidin was increased, however, the proportion of the protein migrating as a tetramer became progressively greater.
Figure 3.
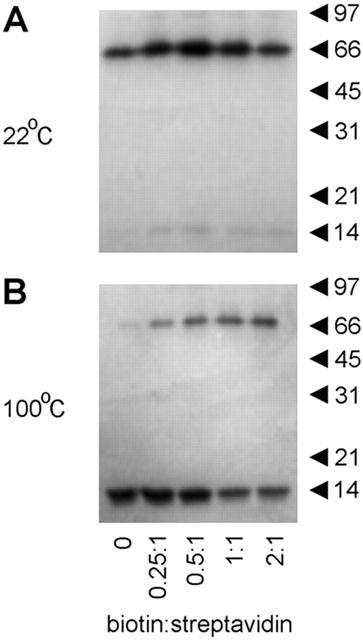
Effect of biotinylation on the thermal stability of streptavidin. Streptavidin, at a concentration of 10 μM, was incubated with biotin at biotin : streptavidin molar ratios of 0 : 1, 0.25 : 1, 0.5 : 1, 1 : 1 or 2 : 1 for 30 min at either 22°C (A) or 100°C (B). Samples were analysed by SDS-polyacrylamide gel electrophoresis, and proteins were visualized by staining with Coomassie brilliant blue. The positions of molecular mass markers (kDa) are shown on the right.
The relative orientation of the biotin binding pockets in the streptavidin tetramer provides two possible angles between pairs of bound DNA-biotin molecules – an acute angle between ligands at adjacent monomers separated by a ‘weak' interface, and obtuse angles between ligands either at adjacent monomers separated by a ‘strong' interface or at diagonally opposite monomers (Weber et al., 1989; Katz, 1997). There is no indication of co-operativity in the binding of biotin to the streptavidin tetramer (González et al., 1997), and so all binding sites should be equivalent. Consequently, one can predict the relative frequencies of acute and obtuse angles between pairs of ligands. Once one ligand has bound, there is only one site at which binding of the second can produce an acute angle, but two sites at which binding can produce an obtuse angle. Hence, for streptavidin bound by two DNA-biotin molecules, the expected ratio of acute : obtuse angles between the DNA rods is 1 : 2. The ability to visualize individual DNA-biotin tags bound to streptavidin molecules afforded by AFM allowed us to test these predictions. The 50-nm DNA rods are not completely rigid; nevertheless, it is a relatively simple matter to distinguish acute and obtuse angles between pairs of tags, and to place each particular angle into one or other category. Figure 4 shows representative images of unoccupied streptavidin and of streptavidin occupied by one, two, three and four molecules of DNA-biotin. Figures 4C,D show examples of streptavidin occupied by two DNA-biotin molecules at an acute and an obtuse angle, respectively. Figure 4F shows an example of a streptavidin molecule tagged by four DNA-biotin molecules, in which the expected acute and obtuse angles between the DNA rods can be clearly seen. When a population of streptavidin molecules (n=80) tagged by two DNA-biotin molecules was analysed, it was found that 25% of the angles between the rods were acute and 75% were obtuse. Hence the ratio of acute : obtuse angles was 1 : 3 and not 1 : 2, as expected. The simplest interpretation of this result is that there is steric hindrance between the relatively large ligands, such that binding at adjacent sites on the tetramer is not favoured. An alternative possibility is that the under-representation of acute angles is caused by mutual repulsion between the DNA rods after the DNA-biotin has bound to streptavidin, which might occur because the DNA carries a significant net negative charge. We believe this latter scenario to be unlikely, because it would be expected to produce a continuum of angles between acute and obtuse, as a result of variation in the extent of repulsion between the DNA rods in different complexes, rather than the two distinct geometries actually observed.
Figure 4.
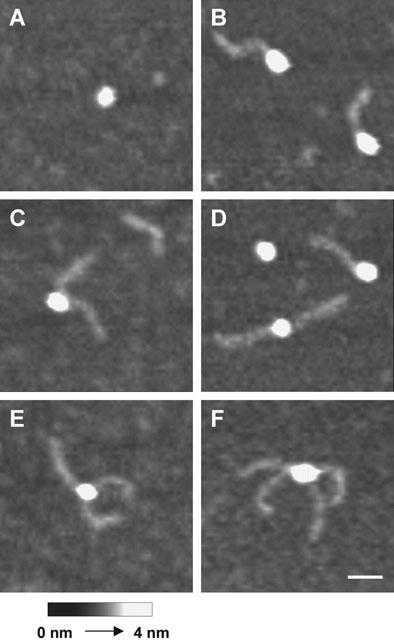
AFM images of streptavidin complexed with multiple DNA-biotin ligands. (A) Unoccupied streptavidin. (B) Streptavidin occupied by one DNA-biotin molecule. (C) Streptavidin occupied by two DNA-biotin molecules, with the DNA rods at an acute angle. (D) Streptavidin occupied by two DNA-biotin molecules, with the DNA rods at an obtuse angle. (E) Streptavidin occupied by three DNA-biotin molecules. (F) Streptavidin occupied by four DNA-biotin molecules, with two acute angles and two obtuse angles between the DNA rods. Scale bar: 25 nm. A shade-height scale is shown at the bottom.
An alternative method of testing whether DNA-biotin binding to streptavidin shows steric hindrance is to determine the distribution of the different occupancy states of streptavidin (i.e., unoccupied, and occupied by one, two, three and four molecules of DNA-biotin), and to compare this with the theoretical distribution, calculated assuming that all binding sites are equivalent. When streptavidin and DNA-biotin were incubated together at the same concentration (5 nM) and the resulting complexes analysed by AFM, it was found that the total occupancy of biotin binding sites was 20±0.02% (n=8), close to the maximum possible occupancy of 25%. The distribution of the different occupancy states, in comparison with the theoretical values, is shown in Figure 5A. It can be seen that the percentage of the streptavidin molecules having a single DNA-biotin bound was higher than predicted, and that the percentages of protein molecules having larger numbers of ligands bound (two, three and four) were all under-represented. This result is in agreement with the previous observation regarding the angles between the DNA rods, and supports the suggestion that steric hindrance between the ligands affects the binding. When the ratio of the concentrations of DNA-biotin to streptavidin was increased to 10 : 1 by raising the DNA-biotin concentration to 50 nM, the total occupancy of biotin binding sites increased to 34±0.01% (n=5). In addition, the percentages of streptavidin molecules having multiple occupancy by DNA-biotin was shifted closer to the predicted values (Figure 5B), indicating that the higher concentration of DNA-biotin was tending to overcome the interference between the ligands.
Figure 5.
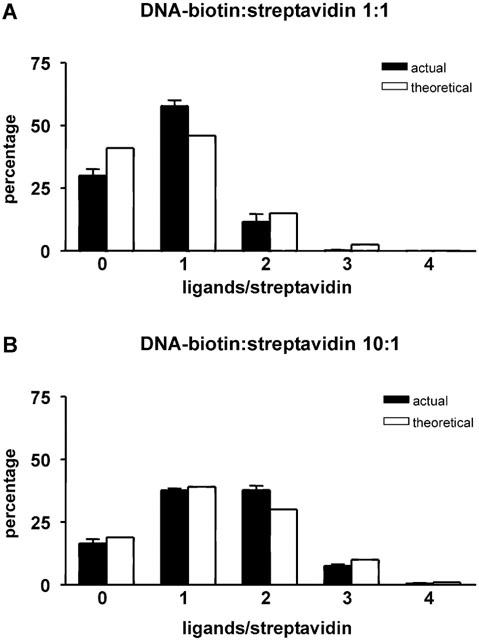
Frequencies of the various forms of DNA-biotin liganding at DNA-biotin : streptavidin molar ratios of 1 : 1 (A) and 10 : 1 (B), compared with theoretical values. The concentration of streptavidin was 5 nM in each case. The histograms show the actual (filled bars) and theoretical (open bars) percentages of the various occupation states of streptavidin. Eight (A) or five (B) separate samples, containing a total of 1335 (A) or 1970 (B) streptavidin particles, were analysed. Errors refer to the variation between samples. The overall occupancies of the binding sites were 20±0.02% (A) and 34±0.01% (B).
Following incubation of streptavidin with DNA-biotin at a 1 : 1 molar ratio, 58% of the streptavidin molecules became occupied by a single ligand molecule. Further occupation of the streptavidin was then found to occur preferentially at sites on the opposite side of the molecule from the original binding site. These binding properties lend themselves to the use of the DNA-biotin/streptavidin complex as a reagent for tagging biotinylated proteins. In order to investigate this possibility, we examined the interaction between a biotinylated target protein, the enzyme β-galactosidase, and streptavidin occupied primarily by single DNA-biotin molecules. β-galactosidase from Escherichia coli is a tetrameric protein of molecular mass 540 kDa, composed of four identical monomers (Cohen & Mire, 1971). As shown in Figure 6A, β-galactosidase imaged immediately after reconstitution in aqueous buffer appeared as an homogenous spread of large particles, of molecular volume 1752±66 nm3 (n=60). As the time after reconstitution of the β-galactosidase increased, the large particles disappeared and were replaced by smaller particles of molecular volume 483±32 nm3 (n=60), consistent with the breakdown of the tetramers into monomers (Figure 6B). This instability of the β-galactosidase tetramer in EDTA-containing buffers has been reported previously (Kaneshiro et al., 1975). The theoretical molecular volume of the tetramer, based on its molecular mass, is 1026 nm3. This is somewhat smaller than the volume obtained from the AFM images, for reasons that are at present unclear. Streptavidin tagged predominantly by single molecules of DNA-biotin was prepared as in Figure 5A. The DNA-biotin/streptavidin complexes were then incubated with β-galactosidase for a further 1 h at 22°C and imaged by AFM. As shown in Figure 6C – F, the β-galactosidase, now predominantly in its monomeric form, became tagged with the DNA-biotin/streptavidin complexes. Free DNA-biotin/streptavidin was also visible (Figure 6C). The streptavidin and β-galactosidase molecules were not usually discernible, although in a few instances (see, for example, Figure 6E), the streptavidin molecule with its protruding DNA rod appeared as a ‘neck' on the image of the complex. The mean molecular volume of the protein complex (672±50 nm3, n=29) was close to the combined volumes of the two proteins (133 nm3+483 nm3=616 nm3). As expected from the extent of biotinylation of the β-galactosidase (on average 2 – 4 moles of biotin per mole of tetramer), only single DNA rods were observed attached to the complex. No DNA-tagged complexes were seen when unbiotinylated β-galactosidase was used (not shown).
Figure 6.
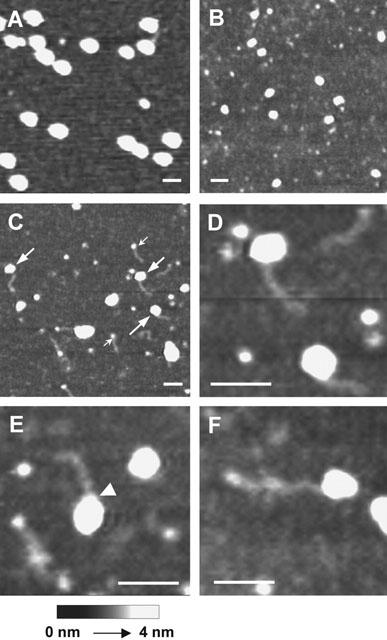
Tagging of β-galactosidase by DNA-biotin/streptavidin. (A) β-galactosidase was reconstituted to a concentration of 5 nM, bound to mica and imaged immediately. (B) β-galactosidase was reconstituted to a concentration of 5 nM and left at 22°C for 6 h before imaging. (C – F) Streptavidin (5 nM) was incubated with DNA-biotin (5 nM) for 1 h at 22°C to produce complexes containing predominantly 1 DNA rod. These complexes were incubated for a further 1 h at 22°C with β-galactosidase (0.5 nM), and then bound to mica and imaged. Large arrows in C indicate β-galactosidase monomers tagged with single DNA-biotin/streptavidin complexes. Small arrows indicate unattached DNA-biotin/streptavidin complexes. The arrowhead in E indicates a ‘neck' on the protein complex produced by the attachment of a DNA-biotin/streptavidin molecule. Scale bars: 50 nm.
Discussion
We have used AFM to image proteins (streptavidin and β-galactosidase) deposited at random on mica supports. To minimize damage to the protein molecules by the AFM tip, we used tapping-mode rather than contact-mode scanning (Hansma et al., 1993). We found no evidence that the proteins imaged had been adversely affected either in the course of sample preparation or during scanning. For instance, the spreads of protein molecules were remarkably homogenous, and the standard errors on the calculated molecular volumes were small (<10% of the mean). In addition, the streptavidin molecules were decorated by DNA-biotin with the expected geometry.
We used molecular volume calculations for two purposes – to confirm that the structures in the images had been correctly identified (e.g. as streptavidin tetramers, or β-galactosidase tetramers or monomers), and as a means of detecting changes in the structure of streptavidin upon biotinylation. It is widely acknowledged that the determination of molecular volume using AFM is potentially problematic, particularly because of factors introduced by the geometry of the scanning tip (Lärmer et al., 1997). Specifically, when the diameter of the particle to be imaged is of the same order as the diameter of the tip (i.e. in the nanometre range), the particle diameter can be significantly over-estimated. The use of half-height diameter measurement was introduced recently in an attempt to minimize this error (Schneider et al., 1998). Although the diameters (and therefore volumes) calculated in this way must necessarily be regarded as approximations, this method has actually been remarkably successful. For example, Schneider et al. (1998) have shown a very good correlation between predicted and calculated molecular volumes, over a range of protein molecular masses from 38 – 900 kDa. It was also found that there was no significant difference between the molecular volumes obtained in air and under fluid. In the present study also, the calculated molecular volume of the streptavidin tetramer was in good agreement with the predicted value, although the correlation for β-galactosidase was less impressive.
The structure of strepatavidin has been solved to atomic resolution. Biotin binds in clefts at the ends of each of the four subunits that constitute the streptavidin tetramer (Weber et al., 1989; Hendrickson et al., 1989). The clefts are lined predominantly with aromatic and polar amino acid residues. Biotin binding causes the displacement of bound water from the cleft and involves numerous interactions between the biotin molecule and the residues lining the cleft. Interestingly, bound biotin interacts with tryptophan-120 of an adjacent subunit, which strengthens intersubunit interactions at the ‘weak' interface and is likely to contribute to the increase in thermal stability of the tetramer (Sano & Cantor, 1995). In addition, the bound biotin becomes partially buried through the ordering and movement of a surface loop (amino acid residues 45 – 50), which is disordered in the unliganded protein. This ordering of loop residues is likely to produce a further enhancement of tetramer stability, this time at the ‘strong' interface (Katz, 1997). These effects of biotinylation result in a change in the quaternary structure of the protein. For instance, there is a slight increase in the angle between the subunits within each dimer, and a consequent rotation of the dimers relative to the tetramer dyad axis (Weber et al., 1989).
In the present study, we have shown that the change in quaternary structure of streptavidin on biotinylation results in an increase in thermal stability, and is detected in the AFM images as an increase in apparent molecular volume. This increase in apparent volume is of interest, since the structural changes described above would seem more likely to cause a reduction in volume. Curiously, we found that biotinylation had no significant effect on the measured diameter of the streptavidin particles, whereas the measured height was significantly increased, accounting for the overall increase in the calculated volume (see Table 1). An intriguing possibility arising out of these findings is that at least part of the increase in measured height might be due to a reduction in the deformability of the protein (i.e. the scanning tip, which presses downwards as it passes over the sample, might be less able to ‘squash' the streptavidin tetramer when the protein is biotinylated). This property would be entirely consistent with the known increase in structural ordering of the protein on biotinylation. We suggest, therefore, that factors such as the ‘hardness' of the protein might contribute to the molecular volumes determined by AFM.
This study establishes DNA-biotin/streptavidin as an effective protein tagging reagent. Furthermore, the clear visibility of the DNA rods in AFM images should permit the determination of the architecture of pharmacologically-significant multi-subunit proteins such as the nicotinic acetylcholine receptor, the GABAA receptor and the 5-HT3 receptor. These ligand-gated ion channels all consist of five homologous subunits arranged around a central pore. The subunits present within all three of these receptors have been well characterized (Karlin, 1987; Unwin, 1998; Farrar et al., 1999; Davies et al., 1999), but the arrangement of the subunits to form the functioning receptor is still unclear. By biotinylating specific subunits, for example via introduced cysteine residues (Noji et al., 1997), and then using streptavidin tagged with single DNA-biotin molecules to decorate the receptor, it should be possible to deduce the receptor structure using AFM imaging. For example, if two tagged subunits are adjacent, then the angle between the DNA rods will be 72°, whereas if they are separated by an untagged subunit, the angle will be 144°. Our current aim is to apply this analysis to the GABAA receptor. Finally, it may be possible to couple receptor ligands directly to DNA, which might permit the use of AFM to study the relative positions of the binding sites for different ligands on the same receptor complex, through the use of different-length DNA tags. The GABAA receptor might also provide a suitable model system for this approach, since it is the target for multiple ligands, such as GABA itself, the benzodiazepines and barbiturates (Sieghart, 1995).
Acknowledgments
This work was funded by Grant B12816 from the Biotechnology and Biological Sciences Research Council (to R.M. Henderson and J.M. Edwardson)
Abbreviations
- AFM
atomic force microscopy
- PCR
polymerase chain reaction
References
- BERGE T., ELLIS D.J., DRYDEN D.T.F., EDWARDSON J.M., HENDERSON R.M. Translocation-independent dimerization of the EcoKI endonuclease visualized by atomic force microscopy. Biophys. J. 2000;79:479–484. doi: 10.1016/S0006-3495(00)76309-0. [DOI] [PMC free article] [PubMed] [Google Scholar]
- COHEN R., MIRE M. Analytical-band centrifugation of an active enzyme-substrate complex. Determination of active subunits of various enzymes. Eur. J. Biochem. 1971;23:276–281. doi: 10.1111/j.1432-1033.1971.tb01619.x. [DOI] [PubMed] [Google Scholar]
- DAVIES P.A., PISTIS M., HANNA M.C., PETERS J.A., LAMBERT J.J., HALES T.G., KIRKNESS E.F. The 5-HT3B subunit is a major determinant of serotonin-receptor function. Nature. 1999;397:359–363. doi: 10.1038/16941. [DOI] [PubMed] [Google Scholar]
- EDSTROM R.D., MEINKE M.H., YANG R., YANG X., ELINGS V., EVANS D.F. Direct visualization of phosphorylase-phosphorylase kinase complexes by scanning tunneling and atomic force microscopy. Biophys. J. 1990;58:1437–1448. doi: 10.1016/S0006-3495(90)82489-9. [DOI] [PMC free article] [PubMed] [Google Scholar]
- ELLIS D.J., BERGE T., EDWARDSON J.M., HENDERSON R.M. Investigation of protein partnerships using atomic force microscopy. Microsc. Res. Tech. 1999a;44:368–377. doi: 10.1002/(SICI)1097-0029(19990301)44:5<368::AID-JEMT9>3.0.CO;2-K. [DOI] [PubMed] [Google Scholar]
- ELLIS D.J., DRYDEN D.T.F., BERGE T., EDWARDSON J.M., HENDERSON R.M. Direct observation of DNA translocation and cleavage by the EcoKI endonuclease using atomic force microscopy. Nature Struct. Biol. 1999b;6:15–17. doi: 10.1038/4882. [DOI] [PubMed] [Google Scholar]
- FARRAR S.J., WHITING P.J., BONNERT T.P., MCKERNAN R.M. Stoichiometry of a ligand-gated ion channel determined by fluorescence resonance energy transfer. J. Biol. Chem. 1999;274:10100–10104. doi: 10.1074/jbc.274.15.10100. [DOI] [PubMed] [Google Scholar]
- FREITAG S., LE TRONG I., CHILKOTI A., KLUMB L.A., STAYTON P.S., STENKAMP R.E. Structural studies of binding site tryptophan mutants in the high-affinity streptavidin-biotin complex. J. Mol. Biol. 1998;279:211–221. doi: 10.1006/jmbi.1998.1735. [DOI] [PubMed] [Google Scholar]
- FREITAG S., LE TRONG I., KLUMB L.A., CHU V., CHILKOTI A., STAYTON & STENKAMP R.E. X-ray crystallographic studies of streptavidin mutants binding to biotin. Biomol. Eng. 1999;16:13–19. doi: 10.1016/s1050-3862(99)00048-0. [DOI] [PubMed] [Google Scholar]
- GREEN N.M. Avidin and streptavidin. Methods Enzymol. 1990;184:51–67. doi: 10.1016/0076-6879(90)84259-j. [DOI] [PubMed] [Google Scholar]
- GONZÁLEZ M., ARGARANA C.E., FIDELIO G.D. Extremely high thermal stability of streptavidin and avidin upon biotin binding. Biomol. Eng. 1999;16:67–72. doi: 10.1016/s1050-3862(99)00041-8. [DOI] [PubMed] [Google Scholar]
- GONZÁLEZ M., BAGATOLLI L.A., ECHABE I., ARRONDO J.L.R., ARGARANA C.E., CANTOR C.R., FIDELIO G.D. Interaction of biotin with streptavidin. Thermostability and conformational changes upon binding. J. Biol. Chem. 1997;272:11288–11294. doi: 10.1074/jbc.272.17.11288. [DOI] [PubMed] [Google Scholar]
- HANSMA H.G., SINSHEIMER R.L., GROPPE J., BRUICE T.C., ELINGS V., GURLEY G., BEZANILLA M., MASTRANGELO I.A., HOUGH P.V.C., HANSMA P.K. Recent advances in atomic force microscopy of DNA. Scanning. 1993;15:296–299. doi: 10.1002/sca.4950150509. [DOI] [PubMed] [Google Scholar]
- HENDRICKSON W.A., PÄHLER A., SMITH J.L., SATOW Y., MERRITT E.A., PHIZACKERLEY R.P. Crystal structure of core streptavidin determined from multiwavelength anomalous diffraction of synchotron radiation. Proc. Natl. Acad. Sci. U.S.A. 1989;86:2190–2194. doi: 10.1073/pnas.86.7.2190. [DOI] [PMC free article] [PubMed] [Google Scholar]
- KANESHIRO C., ENNS C., HAHN M., PETERSON J., REITHEL F. Evidence for an active dimer of Escherichia coli β-galactosidase. Biochem. J. 1975;151:433–434. doi: 10.1042/bj1510433. [DOI] [PMC free article] [PubMed] [Google Scholar]
- KARLIN A. Going round in receptor circles. Nature. 1987;329:286–287. doi: 10.1038/329286a0. [DOI] [PubMed] [Google Scholar]
- KATZ B.A. Binding of biotin to streptavidin stabilizes intersubunit salt bridges between Asp61 and His87 at low pH. J. Mol. Biol. 1997;274:776–800. doi: 10.1006/jmbi.1997.1444. [DOI] [PubMed] [Google Scholar]
- KLUMB L.A., CHU V., STAYTON P.S. Energetic roles of hydrogen bonds at the ureido oxygen binding pocket in the streptavidin-biotin complex. Biochemistry. 1998;37:7657–7663. doi: 10.1021/bi9803123. [DOI] [PubMed] [Google Scholar]
- LÄRMER J., SCHNEIDER S.W., DANKER T., SCHWAB A., OBERLEITHNER H. Imaging excised apical plasma membrane patches of MDCK cells in physiological conditions with atomic force microscopy. Pflügers Arch. 1997;434:254–260. doi: 10.1007/s004240050393. [DOI] [PubMed] [Google Scholar]
- NOJI H., YASUDA R., YOSHIDA M., KINOSHITA K. , JR Direct observation of the rotation of F1-ATPase. Nature. 1997;386:299–302. doi: 10.1038/386299a0. [DOI] [PubMed] [Google Scholar]
- SAMBROOK J., FRITSCH E.F., MANIATIS T. Molecular Cloning: A Laboratory Manual 1989New York: Cold Spring Harbor Laboratory Press; 2nd edn [Google Scholar]
- SANO T., CANTOR C.R. Intersubunit contacts made by tryptophan 120 with biotin are essential for both strong biotin binding and biotin-induced tighter subunit association of streptavidin. Proc. Natl. Acad. Sci. U.S.A. 1995;92:3180–3184. doi: 10.1073/pnas.92.8.3180. [DOI] [PMC free article] [PubMed] [Google Scholar]
- SCHNEIDER S.W., LÄRMER J., HENDERSON R.M., OBERLEITHNER H. Molecular weights of individual proteins correlate with molecular volumes measured by atomic force microscopy. Pflügers Arch. 1998;435:362–367. doi: 10.1007/s004240050524. [DOI] [PubMed] [Google Scholar]
- SIEGHART W. Structure and pharmacology of GABA(A) receptor subtypes. Pharmacol. Rev. 1995;47:181–234. [PubMed] [Google Scholar]
- STAYTON P.S., FREITAG S., KLUMB L.A., CHILKOTI A., CHU V., PENZOTTI J.E., TO R., HYRE D., LE TRONG I., LYBRAND T.P., STENKAMP R.E. Streptavidin-biotin binding energetics. Biomol. Eng. 1999;16:39–44. doi: 10.1016/s1050-3862(99)00042-x. [DOI] [PubMed] [Google Scholar]
- UNWIN N. The nicotinic acetylcholine receptor of the Torpedo electric ray. J. Struct. Biol. 1998;121:181–190. doi: 10.1006/jsbi.1997.3949. [DOI] [PubMed] [Google Scholar]
- WEBER P.C., OHLENDORF D.H., WENDOLOSKI J.J., SALEMME F.R. Structural origins of high-affinity biotin binding to streptavidin. Science. 1989;243:85–88. doi: 10.1126/science.2911722. [DOI] [PubMed] [Google Scholar]


