

Abstract
We evaluated the role of the cross-linking of FcεRI-mediated inositol 1,4,5-triphosphate (IP3) in the increase in cytosolic Ca2+ level ([Ca2+]i) using xestospongin C, a selective membrane permeable blocker of IP3 receptor, in RBL-2H3 mast cells.
In the cells sensitized with anti-dinitrophenol (DNP) IgE, DNP-human serum albumin (DNP-HSA) and thapsigargin induced degranulation of β-hexosaminidase and a sustained increase in [Ca2+]i. Xestospongin C (3 – 10 μM) inhibited both of these changes that were induced by DNP-HSA without changing those induced by thapsigargin.
In the absence of external Ca2+, DNP-HSA induced a transient increase in [Ca2+]i. Xestospongin C (3 – 10 μM) inhibited this increase in [Ca2+]i.
In the cells permeabilized with β-escin, the application of IP3 decreased Ca2+ in the endoplasmic reticulum (ER) as evaluated by mag-fura-2. Xestospongin C (3 – 10 μM) inhibited the effect of IP3.
After the depletion of Ca2+ stores due to stimulation with DNP-HSA or thapsigargin, the addition of Ca2+ induced capacitative calcium entry (CCE). Xestospongin C (3 – 10 μM) inhibited the DNP-HSA-induced CCE, whereas it did not affect the thapsigargin-induced CCE.
These results suggest that FcεRI-mediated generation of IP3 contributes to Ca2+ release not only in the initial phase but also in the sustained phase of the increase in [Ca2+]i, resulting in prolonged Ca2+ depletion in the ER. The ER Ca2+ depletion may subsequently activate CCE to achieve a continuous [Ca2+]i increase, which is necessary for degranulation in the RBL-2H3 mast cells. Xestospongin C may inhibit Ca2+ release and consequently may attenuate degranulation.
Keywords: Xestospongin C; inositol 1,4,5-triphosphate; calcium; capacitative calcium entry; degranulation; β-escin; RBL-2H3 mast cells; DNP-HSA
Introduction
In a variety of cell types, various extracellular stimuli act through cell surface receptors to promote the generation of inositol 1,4,5-triphosphate (IP3) and consequently release Ca2+ from intracellular Ca2+ stores, endoplasmic reticulum (ER) (Berridge, 1993; Reischl et al., 1999; Taylor & Thorn, 2001). IP3-induced depletion of Ca2+ in the ER is generally accompanied by an increase in Ca2+ entry from external space (Putney, 1986; 1990; Berridge, 1993; Clapham, 1995). This process has been known as capacitative calcium entry (CCE) (Putney, 1986; Clapham, 1995), and it is mediated by the store-operated channels (SOCs) in the plasma membrane (Lewis, 1999).
An increase in the level of cytosolic Ca2+ ([Ca2+]i) is an important component of various biological signals. In mast cells, it has been generally known that IP3-induced Ca2+ that is released from the ER, and the subsequent CCE activation is considered to be essential and ubiquitous mechanisms in the steps of degranulation mediated by the cross-linking of IgE-FcεRI (Neher, 1991; Reischl et al., 1999; Sullivan et al., 1999). Among the pathways responsible for the increase in [Ca2+]i, CCE is more important for the FcεRI-mediated degranulation, because the initial transient increase in [Ca2+]i produced in the absence of external Ca2+ is not able to cause degranulation in mast cells (Neher, 1991). In addition, CCE fulfills numerous important physiological functions in many cell types. These functions include gene transcription, cell cycle and proliferation and apoptosis (Parekh & Penner, 1997; Berridge et al., 1998). The refilling of stores is considered to be one of the important physiological functions of CCE (Parekh & Penner, 1997; Takemura & Putney, 1989).
The release of Ca2+ from the ER involves an initial transient phase followed by a sustained phase. It has been suggested that IP3 production is crucial for not only the initial phase but also for the sustained phase induced by receptor stimulation (Millard et al., 1989; Hirose et al., 1999; Nash et al., 2001). At present, however, the role of IP3 on the FcεRI-mediated sustained increase in [Ca2+]i in mast cells remains obscure.
Xestospongin C, isolated from the sponge Xestospongia sp., has recently been shown to be a membrane-permeable inhibitor of the IP3-mediated Ca2+ release (Gafni et al., 1997). Since this discovery, xestospongin C has been widely used in various types of cells and tissues (Kiselyov et al., 1998; Hu et al., 1999; Miyamoto et al., 2000). In the present experiments, we investigated the FcεRI-mediated Ca2+ kinetics using xestospongin C both in intact and β-escin permeabilized RBL-2H3 mast cells.
Methods
Cells
RBL-2H3 cells (ATCC, VA, U.S.A.) were maintained in Dulbecco's Modified Eagle's Medium (DMEM) supplemented with 10% foetal bovine serum and 1% penicillin – streptomycin. Trypsinized cells were plated into culture dishes 2 – 3 days before usage. RBL-2H3 cells were incubated overnight with anti-DNP mouse monoclonal-IgE (0.05 μg ml−1) in DMEM before use.
β-Hexosaminidase secretion
As an index of degranulation, the release of β-hexosaminidase was measured as described by Ortega et al. (1989). IgE-sensitized RBL-2H3 cells (2×10⁵ cells per well) in 24-well plates were washed three times with PIPES buffer solution. The attached cells were stimulated at 37°C under gentle rotation. The supernatants were collected and transferred to a 96-well plate. Triton X-100 solution (0.5%) was added to the cells to quantify the enzyme activity remaining in the cells. The extracts were transferred to the 96-well plate. To each well, 50 μl of the substrate solution, namely 1.3 mg ml−1 p-nitrophenyl-N-acetyl-β-D-glucosamide in 0.04 M sodium citrate, pH 4.5, was added. The 96-well plate was incubated at 37°C for 60 min under gentle rotation. A stop solution (150 μl) containing 0.2 M glycine adjusted to pH 10.0 with NaOH, was added to each well. The absorbance at 405 nm (optical density; OD) of each well was measured with the microplate reader (Model 3550, BIO-RAD, Tokyo, Japan). The percentage of degranulation was calculated by the following formula:
Measurement of [Ca2+]i
RBL-2H3 cells grown on glass cover slips were washed twice with normal HEPES buffer solution. The cells were loaded with fura-PE3 by exposure to normal HEPES buffer solution containing 5 μM fura-PE3 acetoxymethyl ester with 0.01% cremophor EL for 40 min in a dark room at 37°C. For the fluorescence measurements, cells on glass cover slips were placed in a bath on the stage of an inverted microscope (TE-300, NIKON, Tokyo, Japan) equipped with a 40-fold objective lens. Data acquisition and analysis were performed with a Ca2+-imaging system (PTI-4700, Photon Technology International, NJ, U.S.A.). Images of 510 nm fluorescence were captured every 3 s using 340 and 380 nm wavelength light, and the images at 340 nm were divided by the images at 380 nm to provide resultant ratio images that are indicators of [Ca2+]i. Data are expressed as relative values that are derived by taking the resting [Ca2+]i as 0% and the [Ca2+]i in the presence of 3 μM ionomycin with 3 mM Ca2+ as 100%. [Ca2+]i was measured within regions of interest (ROI) that consisted of pixel arrays in which all points were averaged together. All experiments were performed at 37°C.
Quantification of the Ca2+ oscillations
In the RBL-2H3 cells, the changes in [Ca2+]i that were induced by antigens were oscillatory, asynchronous, irregular and varied tremendously amongst cells. In this type of cell, measuring the area under the antigen-induced Δ[Ca2+]i time−1 curve (AUC) was effective for quantifying the antigen-induced response (Narenjkar et al., 1999). The following equation was used for calculating the AUC of each response:
The area for each section was calculated as a trapezoid whose heights were Yi and Yi+1 and whose base was equal to the interval time between each two samples (ΔX=3 s). Finally, the calculated areas for all sections were summed.
Measurement of [Ca2+]ER
RBL-2H3 cells grown on glass cover slips were washed twice with normal HEPES buffer solution. The cells were loaded with mag-fura-2, a low-affinity fluorescent Ca2+ indicator, by exposure to normal HEPES buffer solution containing 20 μM mag-fura-2 acetoxymethyl ester with 0.01% cremophor EL for 60 min in a dark room at room temperature. The mag-fura-2-loaded cells were washed several times with Ca2+-free EGTA solution, then were permeabilized by incubation with 40 μM β-escin for 2 – 4 min at room temperature to evaluate the level of Ca2+ in the endoplasmic reticulum (ER) ([Ca2+]ER) by washing out the mag-fura-2 in the cytoplasm. In this experimental protocol, augmentation and reduction of the fluorescence ratio respectively express an increase and a decrease in [Ca2+]ER. Data are expressed as relative values, taking the [Ca2+]ER in the absence of Ca2+ with 10 μM IP3 (the ER Ca2+ is depleted) as 0% and the [Ca2+]ER in the presence of 1 μM Ca2+ without IP3 (the ER is filled with Ca2+) as 100%. [Ca2+]ER was measured within ROI. All experiments were performed at room temperature.
The permeabilized cells were stimulated by IP3 (10 μM) and loaded with Ca2+ in Ca2+-loading solution. This Ca2+ releasing and loading cycle could be repeated several times in the same permeabilized cells. The permeabilized cells were conditioned by repeating this Ca2+ releasing and loading cycle at least twice before usage.
Solutions
Normal PIPES buffer solution contained (in mM): NaCl 140, KCl 5, glucose 5.5, MgCl2 0.6, CaCl2 1.0, PIPES 10; BSA 0.1%, pH 7.4. Low Ca2+ PIPES buffer solution contained 0.1 mM CaCl2 instead of 1.0 mM CaCl2. Normal HEPES buffer solution (in mM): NaCl 125.4, glucose 11.5, KCl 5.9, MgCl2 1.2, CaCl2 1.5, HEPES 10; pH 7.4. Low Ca2+ HEPES buffer solution contained 0.1 mM CaCl2 instead of 1.5 mM CaCl2. Ca2+-free HEPES buffer solution contained 0.5 mM EGTA instead of 1.5 mM CaCl2. Ca2+-free EGTA solution contained (in mM): magnesium (methansulphonate)2 0.55, potassium methansulphonate 131, ATP 3.9, PIPES 20 and EGTA 1. The ionic strength was adjusted to 0.2 M, and the pH was adjusted to 6.8 at 20°C. Free Ca2+ concentration was changed by adding an appropriate amount of Ca2+ (methansulphonate)2. The Ca2+-loading solution was added 0.502 mM Ca2+ (methansulphonate)2, and pCa was adjusted to 6 at 20°C. The ionic compositions of these solutions were calculated by a computer program developed by Fabiato (1981) with slight modification (Miyamoto et al., 2000).
Chemicals
Xestospongin C was kindly donated by Dr M. Kobayashi (University of Osaka, Japan). Other drugs used were dinitrophenyl-human serum albumin (DNP-HSA), monoclonal anti-DNP (mouse IgE isotype), thapsigargin, triton X-100, p-nitrophenyl-N-acetyl-β-D-glucosamide, DMEM powder, bovine serum albumin, β-escin (Sigma Chemicals, St. Louis MO, U.S.A.), fura-PE3/AM (TEF Laboratories, Austin TX, U.S.A.), mag-fura-2/AM (Molecular Probes, Eugene OR, U.S.A.), cremophor EL (Nacalai Tesque, Tokyo, Japan), IP3, EGTA (Dojindo Laboratories, Kumamoto, Japan) and foetal bovine serum (Filtron, Brooklyn, Australia).
Statistical analysis
The results of the experiments were expressed as means±s.e.mean. Statistical evaluation of the data was performed using the unpaired Student's t-test for comparisons between pairs of groups and by one-way analysis of variance (ANOVA) followed by either Dunnett's test or the Tukey test for comparisons among more than two groups. A value of P<0.05 was taken as significant.
Results
Xestospongin C inhibited DNP-HSA-induced secretion
The intracellular β-hexosaminidase was released by DNP-HSA (0.01 – 100 ng ml−1) stimulation for 30 min in normal PIPES buffer solution in a concentration-dependent manner (data not shown). Ten ng ml−1 DNP-HSA induced 80% of the maximum degranulation that could be induced by 100 ng ml−1 DNP-HSA, so the following experiments were done with 10 ng ml−1 DNP-HSA. RBL-2H3 cells were incubated with or without xestospongin C (1 – 10 μM) for 15 min in PIPES buffer solution before being stimulated with DNP-HSA (10 ng ml−1). Xestospongin C inhibited the DNP-HSA-induced degranulation in a concentration-dependent manner (Figure 1a).
Figure 1.
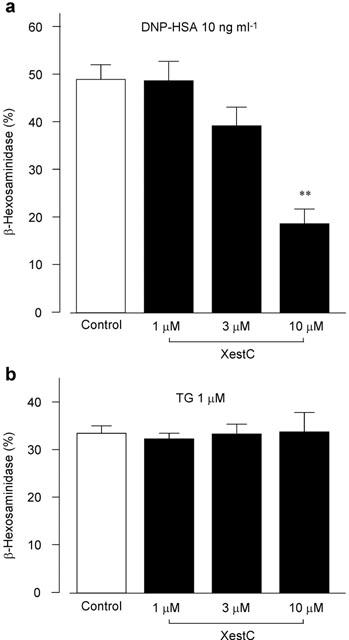
Effect of xestospongin C on degranulation. RBL-2H3 cells were preincubated without (Control) or with xestospongin C (XestC) for 15 min at 37°C, then were stimulated with either 10 ng ml−1 DNP-HSA (a) or 1 μM thapsigargin (TG) (b) for 30 min. The released β-hexosaminidase was calculated as a percentage of the total amount of β-hexosaminidase. Results are expressed as mean±s.e.mean of 8 – 17 experiments. **Significantly different from the control with P<0.01.
As shown in Figure 1b, the intracellular β-hexosaminidase was released also by thapsigargin (1 μM), a potent inhibitor of Ca2+-ATPase in the ER membrane, for 30 min in normal PIPES buffer solution. Xestospongin C (1 – 10 μM) did not inhibit the thapsigargin-induced degranulation. The intracellular β-hexosaminidase was also released by thapsigargin (1 μM) for 30 min in low (0.1 mM) Ca2+ PIPES buffer solution (20.4±2.4%, n=4). Xestospongin C did not inhibit the degranulation (20.3±1.4%, n=4, 3 μM xestospongin C; 17.8±1.1%, n= 4, 10 μM xestospongin C; n=4).
Xestospongin C inhibited DNP-HSA-induced increase in [Ca2+]i
In normal HEPES buffer solution (1.5 mM Ca2+), DNP-HSA (10 ng ml−1) induced a sustained increase in [Ca2+]i with diverse patterns of oscillations (Figure 2a). Pretreatment of the cells with xestospongin C (3 – 10 μM) for 15 min decreased the DNP-HSA-induced sustained increase in [Ca2+]i. As shown in Figure 2b, xestospongin C decreased the area under the curve (AUC: see Methods) induced by DNP-HSA stimulation in a concentration-dependent manner.
Figure 2.
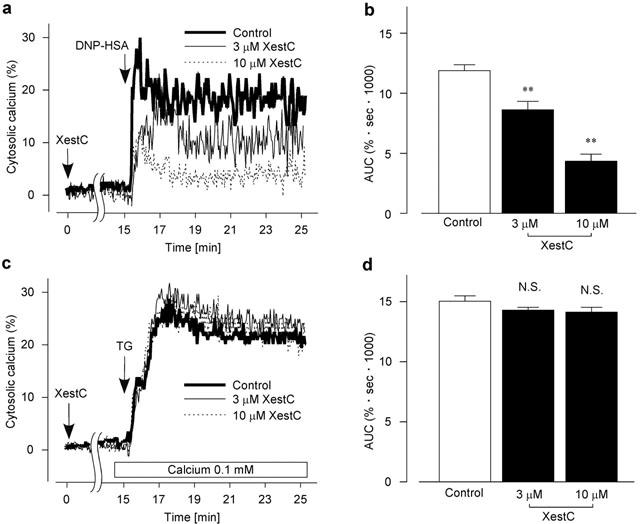
Effect of xestospongin C on the increase in [Ca2+]i (a and c). Typical recording of either 10 ng ml−1 DNP-HSA-induced (a) or 1 μM thapsigargin (TG)-induced (c) increase in [Ca2+]i in the fura-PE3-loaded RBL-2H3 cells without (Control) or with xestospongin C (XestC). Cells were preincubated with xestospongin C for 15 min. In c, the external solution was changed to a low Ca2+ HEPES buffer solution 30 s before stimulation with thapsigargin. (b) AUC for 10 min after the DNP-HSA stimulation in (a). (d) AUC for 10 min after the TG stimulation in (c). Results are expressed as mean±s.e.mean of 33 – 46 cells. **Significantly different from the control with P<0.01. N.S. not significantly different.
In normal HEPES buffer solution (1.5 mM Ca2+), thapsigargin (1 μM) induced a sustained increase in [Ca2+]i (thapsigargin-induced AUC for 10 min; 22.1±0.6%·s·1000, n=23). Xestospongin C (3 – 10 μM) did not change the AUC (21.5±0.8%·s·1000, n=20, 3 μM xestospongin C; 20.0±0.7%·s·1000, n=14, 10 μM xestospongin C). Because the thapsigargin (1 μM)-induced Ca2+ increment in normal HEPES buffer solution (1.5 mM Ca2+) was too large to compare with the effect of xestospongin C on DNP-HSA induced increment of [Ca2+]i, the external solution was changed to a low Ca2+ HEPES buffer solution (0.1 mM Ca2+) 30 s before the stimulation with thapsigargin. In a low Ca2+ HEPES buffer solution, the thapsigargin-induced sustained increase in [Ca2+]i was comparable in amplitude to that induced by DNP-HSA as shown in Figure 2a. Xestospongin C (3 – 10 μM) changed neither the thapsigargin-induced increase in [Ca2+]i (Figure 2c) nor the AUC (Figure 2d).
Xestospongin C inhibited DNP-HSA-induced Ca2+ release from the ER
As shown in Figure 3a, the addition of DNP-HSA (10 ng ml−1) for 3 min induced a transient increase in [Ca2+]i in Ca2+-free HEPES buffer solution. Subsequent application of thapsigargin (10 μM) elicited a small increase in [Ca2+]i with a gradual decrease in the continuous absence of external Ca2+. In the cells treated with xestospongin C (3 – 10 μM) for 15 min, DNP-HSA induced a smaller increase in [Ca2+]i than it did in the absence of xestospongin C. A subsequent application of thapsigargin induced a larger increase in [Ca2+]i than that induced in the absence of xestospongin C. AUC for 3 min after the DNP-HSA stimulation was decreased (Figure 3b), whereas AUC for 7 min after the thapsigargin stimulation was increased (Figure 3c) by xestospongin C in a concentration-dependent manner. Xestospongin C did not change the total AUC during the stimulation with DNP-HSA and subsequent thapsigargin for 10 min (Figure 3d).
Figure 3.
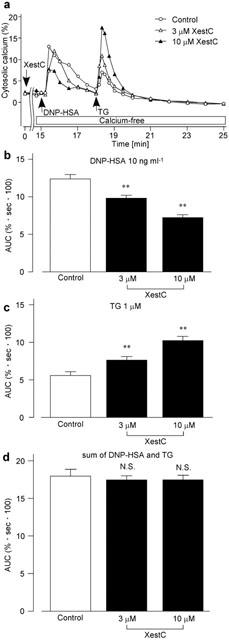
Effect of xestospongin C on DNP-HSA-induced Ca2+ release. (a) The fura-PE3-loaded RBL-2H3 cells were stimulated with 10 ng ml−1 DNP-HSA for 3 min in Ca2+-free HEPES buffer solution followed by subsequent stimulation with 10 μM thapsigargin (TG) for 7 min. The cells had been preincubated without (Control) or with xestospongin C (XestC) for 15 min in normal HEPES buffer solution. The external solution was changed to Ca2+-free HEPES buffer solution for the last 30 s of preincubation. AUC in response to DNP-HSA (b), to TG (c) or the sum of both (d). Results are expressed as mean±s.e.mean of 27 – 38 cells. **Significantly different from the control with P<0.01. N.S. not significantly different.
Xestospongin C inhibited IP3-induced Ca2+ release in the β-escin-permeabilized cells
To investigate the direct effect of xestospongin C on the IP3-induced Ca2+ release from the ER, [Ca2+]ER was monitored using mag-fura-2-loaded RBL-2H3 cells permeabilized with β-escin. After [Ca2+]ER was increased by Ca2+-loading solution and reached a stable value, the cells were treated with or without xestospongin C (3 – 10 μM) for 3 min (Figure 4a). The external solution was changed to a Ca2+-free EGTA solution 30 s before the stimulation with IP3. In the absence of xestospongin C (Control), IP3 decreased [Ca2+]ER to the level close to basal level. The effect of IP3 to decrease [Ca2+]ER was attenuated by the preincubation with xestospongin C. The amount of [Ca2+]ER remaining 2 min after the addition of IP3 was increased by xestospongin C in a concentration-dependent manner (Figure 4b).
Figure 4.
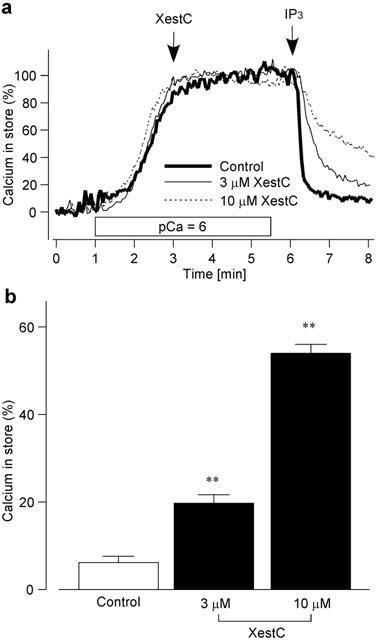
Effect of xestospongin C on IP3-induced Ca2+ release. (a) Typical traces of [Ca2+]ER in the mag-fura-2-loaded RBL-2H3 cells permeabilized with 40 μM β-escin. After Ca2+-loading solution (pCa=6) was introduced, the cells were treated without (Control) or with xestospongin C (XestC) for 3 min. Then the solution was changed to Ca2+-free EGTA solution 30 s before IP3 stimulation, and the cells were stimulated by IP3 (10 μM) with or without continued xestospongin C treatment. (b) [Ca2+]ER 2 min after IP3 stimulation without (Control) or with xestospongin C (XestC) preincubation for 3 min. Results are expressed as mean±s.e.mean of 33 – 59 cells. **Significantly different from the control with P<0.01.
Xestospongin C inhibited DNP-HSA-induced CCE
To deplete the Ca2+ stores, the cells were stimulated with DNP-HSA (10 ng ml−1) for 5 min in Ca2+-free HEPES buffer solution (0.5 mM EGTA). The cells were then treated with or without xestospongin C (3 – 10 μM) for 15 min in the continued absence of external Ca2+ and presence of DNP-HSA. The external solution was then changed to normal HEPES buffer solution (1.5 mM Ca2+) with or without continuous xestospongin C treatment in the presence of DNP-HSA (Figure 5a). In the absence of xestospongin C (control), the addition of Ca2+ to the external solution induced a transient increase followed by a sustained increase in [Ca2+]i. Soon after the addition of external Ca2+, the transient increase in [Ca2+]i was almost the same whether xestospongin C was present or absent. In the presence of xestospongin C, however, the sustained increase in [Ca2+]i was inhibited. As shown in Figure 5b, xestospongin C decreased the AUC in a concentration-dependent manner.
Figure 5.
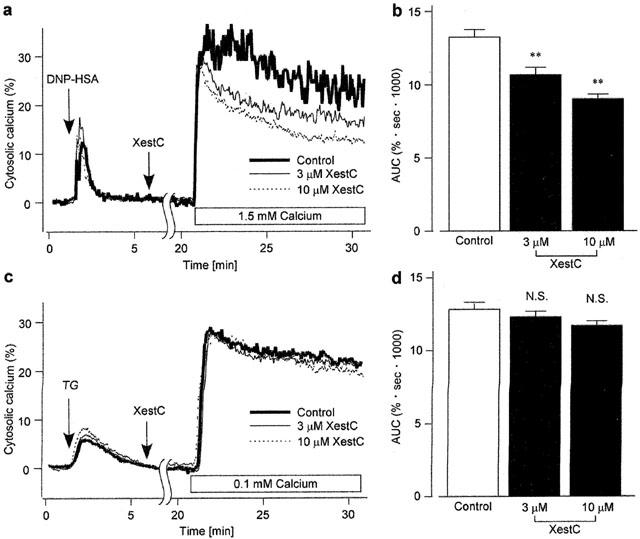
Effect of xestospongin C on the CCE. (a and c) The fura-PE3-loaded RBL-2H3 cells were stimulated with either 10 ng ml−1 DNP-HSA (a) or 1 μM thapsigargin (TG) (c) in a Ca2+-free HEPES buffer solution for 5 min. The cells were subsequently incubated without (Control) or with xestospongin C (XestC) for 15 min in the continuous presence of DNP-HSA or thapsigargin. The external solution was then changed to normal HEPES buffer solution (a) or low Ca2+ HEPES buffer solution (c) with or without continued treatment of xestospongin C in the presence of respective agents. Typical recordings are shown. (b) AUC for 10 min after changing the external solution to normal HEPES buffer solution in (a). (d) AUC for 10 min after changing the external solution to low Ca2+ HEPES buffer solution in (c). Results are expressed as mean±s.e.mean of 32 – 41 cells. **Significantly different from the control with P<0.01. N.S. not significantly different.
In the case of thapsigargin-induced depletion of Ca2+ stores followed by re-addition of 0.1 mM Ca2+ in the continuous presence of thapsigargin (low Ca2+ HEPES buffer solution), similar amplitudes of increase in [Ca2+]i were observed regardless of the treatment with xestospongin C (3 – 10 μM) (Figure 5c). As shown in Figure 5d, xestospongin C did not change the AUC.
Discussion
In the present experiments, we have examined the effect of xestospongin C on FcεRI-mediated Ca2+ release, CCE and degranulation. We found that xestospongin C (3 – 10 μM) did not change the total amount of ER Ca2+ released by a combination of DNP-HSA and thapsigargin (Figure 3d). This result indicates that xestospongin C altered neither the ER Ca2+ homeostasis maintained by Ca2+ pumps nor the size of Ca2+ stores in intact RBL-2H3 cells. In contrast, xestospongin C decreased the DNP-HSA-induced Ca2+ release in Ca2+-free HEPES buffer solution (Figure 3a,b) and increased subsequent thapsigargin-induced Ca2+ release (Figure 3a,c). These results suggest that xestospongin C inhibits DNP-HSA-induced Ca2+ release. We further investigated the effect of xestospongin C on IP3-induced Ca2+ release from the ER using mag-fura-2-loaded RBL-2H3 cells, which were permeabilized with β-escin. Exogenously applied IP3 elicited a Ca2+ release from the ER, and xestospongin C significantly inhibited the IP3-induced Ca2+ release (Figure 4). These results suggest that xestospongin C passes through the plasma membrane of intact RBL-2H3 cells and inhibits IP3-induced Ca2+ release by blocking the IP3-receptors on the ER membrane.
We next examined whether xestospongin C affects CCE. As demonstrated in Figure 5c,d, xestospongin C did not change the thapsigargin-induced CCE, which suggests that xestospongin C does not directly inhibit SOCs. However, as demonstrated in Figure 5a,b, xestospongin C inhibited DNP-HSA-induced CCE. Because DNP-HSA, but not thapsigargin, produces IP3 to deplete the Ca2+ stores, we considered DNP-HSA-induced CCE to be inhibited by xestospongin C by its blocking of the IP3 receptors. It has been suggested that IP3 production is crucial for Ca2+ release from the ER, not only in the initial transient phase of increase in [Ca2+]i but also in the sustained phase (Millard et al., 1989; Hirose et al., 1999; Nash et al., 2001). Once CCE is activated during the sustained phase of stimulation, increased [Ca2+]i plays a role in various physiological functions including the refilling of Ca2+ stores (Takemura & Putney, 1989; Parekh & Penner, 1997). Taken together, these findings suggest that IP3 may release Ca2+ from the ER during the sustained phase of the [Ca2+]i increase in the antigen-stimulated mast cells.
It has been reported that the activity of CCE inversely correlates with the amount of Ca2+ in the ER (Sedova et al., 2000). Soon after the application of Ca2+, as demonstrated in Figure 5a, the activity of CCE was not changed by the treatment with xestospongin C. This result may indicate that the ER had been equally depleted irrespective of the treatment with xestospongin C. However, xestospongin C inhibited the CCE during the sustained phase of the [Ca2+]i increase. These results are consistent with our suggestion that xestospongin C inhibits the IP3-induced release of Ca2+ with the consequence of an acceleration of Ca2+ refilling. In this way, in the xestospongin C-treated cells, the ER is replenished with Ca2+ and thus attenuates CCE activation. Ching et al. (2001) have recently shown that, in RBL-2H3 cells, pathways other than IP3 (i.e. phosphoinositide 3-kinase) also trigger the Ca2+ influx. The effect of xestospongin C on this pathway should be clarified in the future study.
As demonstrated in Figures 2 and 5, xestospongin C did not inhibit the thapsigargin-induced CCE, suggesting that xestospongin C does not inhibit SOCs. However, it has recently been hypothesized that there is a ‘conformational-coupling' between the ER membrane IP3 receptors and the SOCs in the plasma membrane, and this conformational-coupling is needed to activate the SOCs (Irvine, 1990). Moreover, it was reported that xestospongin C prevents the conformational-coupling in HEK293 cells by the direct interaction with IP3 receptor and xestospongin C is more effective for the inhibition of CCE than Ca2+ release (Ma et al., 2000). In our experiments, 3 – 10 μM xestospongin C did not change the thapsigargin-induced CCE (Figure 5c,d), whereas it inhibited the DNP-HSA-induced Ca2+ release (Figure 3). These results suggest that the susceptibility of RBL-2H3 mast cells to xestospongin C is different from that of other cell types reported so far. In addition, in DDT1MF-2 cells, SOCs activation mediated by the conformational-coupling is inhibited by jasplakinolide, a cell-permeate stabilizer of actin filaments (Patterson et al., 1999). In RBL-2H3 cells, however, jasplakinolide (3 μM) did not inhibit CCE (our unpublished observation). Given these findings, we proposed that the conformational-coupling model might not be applicable to the activation of SOCs in RBL-2H3 cells.
It is generally recognized that in mast cells, degranulation requires an increase in [Ca2+]i mediated by the CCE (Neher, 1991; Sullivan et al., 1999). As demonstrated in Figure 2, xestospongin C did not change the thapsigargin-induced increase in [Ca2+]i, although it inhibited the DNP-HSA-induced increase in [Ca2+]i. Furthermore, xestospongin C inhibited the DNP-HSA-induced degranulation without changing the thapsigargin-induced degranulation (Figure 1). These results suggest that, in RBL-2H3 cells, xestospongin C inhibits the DNP-HSA-induced degranulation through the inhibition of CCE.
In summary, FcεRI-mediated production of IP3 contributes to the increase in [Ca2+]i, not only in the initial transient phase but also in the subsequent sustained phase. In the sustained [Ca2+]i increase, Ca2+ replenished through the CCE is released again by the continuous production of IP3, resulting in the prolonged store depletion. Depletion of the Ca2+ store subsequently activates the CCE, which is a necessary step for the degranulation in RBL-2H3 mast cells. Xestospongin C selectively blocks the IP3 receptors and thus inhibits the [Ca2+]i increase and degranulation.
Acknowledgments
This work was supported by the Program for Promotion of Basic Research Activities for Innovative Biosciences (BRAIN) and a Grant-in-Aid for Scientific Research from the Ministry of Education, Culture, and Sciences.
Abbreviations
- CCE
capacitative calcium entry
- DNP-HSA
dinitrophenyl-human serum albumin
- ER
endoplasmic reticulum
- FcεRI
high-affinity receptor for the Fc region of IgE
- IgE
immunoglobulin E
- IP3
inositol 1,4,5-triphosphate
- RBL
rat basophilic leukemia
- SOCs
store-operated channels
References
- BERRIDGE M.J. Inositol trisphosphate and calcium signalling. Nature. 1993;361:315–325. doi: 10.1038/361315a0. [DOI] [PubMed] [Google Scholar]
- BERRIDGE M.J., BOOTMAN M.D., LIPP P. Calcium–a life and death signal. Nature. 1998;395:645–648. doi: 10.1038/27094. [DOI] [PubMed] [Google Scholar]
- CHING T.T., HSU A.L., JOHNSON A.J., CHEN C.S. Phosphoinositide 3-kinase facilitates antigen-stimulated Ca2+ influx in RBL-2H3 mast cells via a phosphatidylinositol 3,4,5-trisphosphate-sensitive Ca2+ entry mechanism. J. Biol. Chem. 2001;276:14814–14820. doi: 10.1074/jbc.M009851200. [DOI] [PubMed] [Google Scholar]
- CLAPHAM D.E. Intracellular calcium. Replenishing the stores. Nature. 1995;375:634–635. doi: 10.1038/375634a0. [DOI] [PubMed] [Google Scholar]
- FABIATO A. Myoplasmic free calcium concentration reached during the twitch of an intact isolated cardiac cell and during calcium-induced release of calcium from the sarcoplasmic reticulum of a skinned cardiac cell from the adult rat or rabbit ventricle. J. Gen. Physiol. 1981;78:457–497. doi: 10.1085/jgp.78.5.457. [DOI] [PMC free article] [PubMed] [Google Scholar]
- GAFNI J., MUNSCH J.A., LAM T.H., CATLIN M.C., COSTA L.G., MOLINSKI T.F., PESSAH I.N. Xestospongins: potent membrane permeable blockers of the inositol 1,4,5-trisphosphate receptor. Neuron. 1997;19:723–733. doi: 10.1016/s0896-6273(00)80384-0. [DOI] [PubMed] [Google Scholar]
- HIROSE K., KADOWAKI S., TANABE M., TAKESHIMA H., IINO M. Spatiotemporal dynamics of inositol 1,4,5-trisphosphate that underlies complex Ca2+ mobilization patterns. Science. 1999;284:1527–1530. doi: 10.1126/science.284.5419.1527. [DOI] [PubMed] [Google Scholar]
- HU Q., DESHPANDE S., IRANI K., ZIEGELSTEIN R.C. [Ca2+]i oscillation frequency regulates agonist-stimulated NF-κB transcriptional activity. J. Biol. Chem. 1999;274:33995–33998. doi: 10.1074/jbc.274.48.33995. [DOI] [PubMed] [Google Scholar]
- IRVINE R.F. ‘Quantal' Ca2+ release and the control of Ca2+ entry by inositol phosphates–a possible mechanism. FEBS Lett. 1990;263:5–9. doi: 10.1016/0014-5793(90)80692-c. [DOI] [PubMed] [Google Scholar]
- KISELYOV K., XU X., MOZHAYEVA G., KUO T., PESSAH I., MIGNERY G., ZHU X., BIRNBAUMER L., MUALLEM S. Functional interaction between InsP3 receptors and store-operated Htrp3 channels. Nature. 1998;396:478–482. doi: 10.1038/24890. [DOI] [PubMed] [Google Scholar]
- LEWIS R.S. Store-operated calcium channels. Adv. Second Messenger Phosphoprotein Res. 1999;33:279–307. doi: 10.1016/s1040-7952(99)80014-7. [DOI] [PubMed] [Google Scholar]
- MA H.T., PATTERSON R.L., VAN ROSSUM D.B., BIRNBAUMER L., MIKOSHIBA K., GILL D.L. Requirement of the inositol trisphosphate receptor for activation of store-operated Ca2+ channels. Science. 2000;287:1647–1651. doi: 10.1126/science.287.5458.1647. [DOI] [PubMed] [Google Scholar]
- MILLARD P.J., RYAN T.A., WEBB W.W., FEWTRELL C. Immunoglobulin E receptor cross-linking induces oscillations in intracellular free ionized calcium in individual tumor mast cells. J. Biol. Chem. 1989;264:19730–19739. [PubMed] [Google Scholar]
- MIYAMOTO S., IZUMI M., HORI M., KOBAYASHI M., OZAKI H., KARAKI H. Xestospongin C, a selective and membrane-permeable inhibitor of IP3 receptor, attenuates the positive inotropic effect of alpha-adrenergic stimulation in guinea-pig papillary muscle. Br. J. Pharmacol. 2000;130:650–654. doi: 10.1038/sj.bjp.0703358. [DOI] [PMC free article] [PubMed] [Google Scholar]
- NARENJKAR J., MARSH S.J., ASSEM E.S. The characterization and quantification of antigen-induced Ca2+ oscillations in a rat basophilic leukemia cell line (RBL-2H3) Cell Calcium. 1999;26:261–269. doi: 10.1054/ceca.1999.0065. [DOI] [PubMed] [Google Scholar]
- NASH M.S., YOUNG K.W., JOHN CHALLISS R.A., NAHORSKI S.R. Receptor-specific messenger oscillations. Nature. 2001;413:381–382. doi: 10.1038/35096643. [DOI] [PubMed] [Google Scholar]
- NEHER E. Ion influx as a transduction signal in mast cells. Int. Arch. Allergy. Appl. Immunol. 1991;94:47–50. doi: 10.1159/000235322. [DOI] [PubMed] [Google Scholar]
- ORTEGA E., HAZAN B., ZOR U., PECHT I. Mast cell stimulation by monoclonal antibodies specific for the Fc epsilon receptor yields distinct responses of arachidonic acid and leukotriene C4 secretion. Eur. J. Immunol. 1989;19:2251–2256. doi: 10.1002/eji.1830191211. [DOI] [PubMed] [Google Scholar]
- PAREKH A.B., PENNER R. Store depletion and calcium influx. Physiol. Rev. 1997;77:901–930. doi: 10.1152/physrev.1997.77.4.901. [DOI] [PubMed] [Google Scholar]
- PATTERSON R.L., VAN ROSSUM D.B., GILL D.L. Store-operated Ca2+ entry: evidence for a secretion-like coupling model. Cell. 1999;98:487–499. doi: 10.1016/s0092-8674(00)81977-7. [DOI] [PubMed] [Google Scholar]
- PUTNEY J.W. , JR A model for receptor-regulated calcium entry. Cell Calcium. 1986;7:1–12. doi: 10.1016/0143-4160(86)90026-6. [DOI] [PubMed] [Google Scholar]
- PUTNEY J.W. , JR Capacitative calcium entry revisited. Cell Calcium. 1990;11:611–624. doi: 10.1016/0143-4160(90)90016-n. [DOI] [PubMed] [Google Scholar]
- REISCHL I.G., COWARD W.R., CHURCH M.K. Molecular consequences of human mast cell activation following immunoglobulin E-high-affinity immunoglobulin E receptor (IgE- FcεRI) interaction. Biochem. Pharmacol. 1999;58:1841–1850. doi: 10.1016/s0006-2952(99)00226-9. [DOI] [PubMed] [Google Scholar]
- SEDOVA M., KLISHIN A., HUSER J., BLATTER L.A. Capacitative Ca2+ entry is graded with degree of intracellular Ca2+ store depletion in bovine vascular endothelial cells. J. Physiol. 2000;523:549–559. doi: 10.1111/j.1469-7793.2000.t01-3-00549.x. [DOI] [PMC free article] [PubMed] [Google Scholar]
- SULLIVAN R., PRICE L.S., KOFFER A. Rho controls cortical F-actin disassembly in addition to, but independently of, secretion in mast cells. J. Biol. Chem. 1999;274:38140–38146. doi: 10.1074/jbc.274.53.38140. [DOI] [PubMed] [Google Scholar]
- TAKEMURA H., PUTNEY J.W. , JR Capacitative calcium entry in parotid acinar cells. Biochem. J. 1989;258:409–412. doi: 10.1042/bj2580409. [DOI] [PMC free article] [PubMed] [Google Scholar]
- TAYLOR C.W., THORN P. Calcium signalling: IP3 rises again…and again. Curr. Biol. 2001;11:R352–R355. doi: 10.1016/s0960-9822(01)00192-0. [DOI] [PubMed] [Google Scholar]