

Abstract
To determine the role of actin assembly in the Ca2+ signalling of mast cells activated by cross-linking of FcεRI, we examined the effects of cytochalasin D, an inhibitor of actin polymerization.
In the RBL-2H3 cells, F-actin content was increased by sensitization with anti-dinitrophenol (DNP) IgE. In these cells, cytochalasin D induced oscillatory increases in cytosolic Ca2+ ([Ca2+]i); these increase were inhibited by jasplakinolide, a stabilizer of actin filaments.
In the IgE-sensitized RBL-2H3 cells, DNP-human serum albumin (DNP-HSA) augmented actin assembly. DNP-HSA also increased the production of IP3, [Ca2+]i and degranulation. Cytochalasin D enhanced all of these DNP-HSA-induced effects.
In a Ca2+-free solution, DNP-HSA induced a transient increase in [Ca2+]i, and this increase was accelerated by cytochalasin D. After cessation of the DNP-HSA-induced Ca2+ release, the re-addition of Ca2+ induced a sustained increase in [Ca2+]i through capacitative Ca2+ entry (CCE), and this increase was enhanced by cytochalasin D.
The effect of cytochalasin D in enhancing the CCE activity was prevented by xestospongin C.
In contrast, neither the Ca2+ release nor the CCE activation that was induced by thapsigargin was affected by cytochalasin D.
These results suggest that actin de-polymerization stimulates the FcεRI-mediated signalling to augment the release of Ca2+ from the endoplasmic reticulum in RBL-2H3 cells.
Keywords: actin, RBL-2H3, calcium, cytochalasin D, IP3
Introduction
The release of histamine and other inflammatory mediators from mast cells is the primary event in a variety of acute allergic and inflammatory stages. Rat basophilic leukaemia cell (RBL-2H3) is a tumour mast cell line used frequently as an experimental model for mucosal mast cells. RBL-2H3 cells express receptors with a high-affinity receptor for the Fc region of IgE (FcεRI) on the cell-surface membrane. Antigen-mediated cross-linking of FcεRI is a critical step for triggering the degranulation of mast cells (Jouvin et al., 1995). Furthermore, an increase in the cytosolic calcium level ([Ca2+]i) is considered to be an essential and ubiquitous mechanism in the process of the degranulation of mediators in mast cells.
The activation of receptors coupled to inositol 1,4,5-trisphosphate (IP3) production evokes a biphasic increase in intracellular Ca2+ in which an initial Ca2+ release is followed by a sustained Ca2+ influx (Berridge, 1993; Taylor & Thorn, 2001). In non-excitable cells, including mast cells, IP3-induced depletion of intracellular Ca2+ in the endoplasmic reticulum (ER) activates Ca2+ entry across the plasma membrane. This process, termed capacitative calcium entry (CCE), is also known as store-operated calcium entry (Putney, 1986, 1990; Clapham, 1995). CCE is mediated by store-operated channels (SOCs) in the plasma membrane (Zweifach & Lewis, 1996; Parekh et al., 1997; Lewis, 1999).
It is well known that an actin cortex, a network of actin filaments organized and regulated by actin-binding proteins, supports the plasma membrane of the cell. In general, half of the actin in a cell is monomeric (G-actin), and the rest is polymerized into filaments (F-actin) (Barkalow & Hartwig, 1995; Carlier & Pantaloni, 1997). The polymerization-depolymerization transition constitutes an important component of the cellular response to receptor activation. In platelets and smooth muscle cells, for instance, polymerization of actin at the cell periphery prevents CCE from occurring (Patterson et al., 1999; Rosado et al., 2000). In mast cells, on the other hand, inhibition of F-actin polymerization slows the time-dependent decrease of this antigen-stimulated tyrosine phosphorylation of FcεRI β subunit (Holowka et al., 2000). However, the role of actin in the regulation of FcεRI-mediated Ca2+ signalling has not been clarified.
We report here that, although actin disassembly does not enhance the thapsigargin-induced increase in [Ca2+]i in RBL-2H3 mast cells, it enhances the antigen-induced increase in [Ca2+]i in the IgE-sensitized cells. Our results indicate for the first time that FcεRI-mediated Ca2+ release is regulated by the actin cytoskeleton in the RBL-2H3 cells.
Methods
Cells
RBL-2H3 cells (ATCC, VA, U.S.A.) were maintained in Dulbecco's Modified Eagle's Medium (DMEM) supplemented with 10% foetal bovine serum and 1% penicillin-streptomycin. Trypsinized cells were plated into culture dishes 1–3 days before usage. In most of the experiments, RBL-2H3 cells were incubated overnight with anti-DNP IgE (0.05 μg ml−1) in DMEM before use.
β-Hexosaminidase degranulation
As an index of degranulation, the release of β-hexosaminidase was measured (Ortega et al., 1989). IgE-sensitized RBL-2H3 cells (2×10⁵ cells per well) in 24-well plates were washed three times with PIPES buffered solution (in mM: NaCl 140, KCl 5, glucose 5.5, MgCl2 0.6, PIPES 10, pH 7.4, and either CaCl2 1 or EGTA 0.5; BSA 0.1%). The attached cells were stimulated at 37°C under gentle rotation. The supernatants were collected and transferred to a 96-well plate. Triton X-100 solution (0.5%) was added to the cells to quantify the enzyme activity remaining in the cells. The extracts were transferred to the 96-well plate. To each well of the 96-well plate, 50 μl of substrate solution, 1.3 mg ml−1 p-nitrophenyl-N-acetyl-β-D-glucosamide in 0.04 M sodium citrate, pH 4.5, was added. The 96-well plate was incubated at 37°C for 60 min under gentle rotation. A stop solution (150 μl) containing 0.2 M glycine adjusted to pH 10.0 with NaOH was added to each well. The absorbance at 405 nm (optical density: OD) of each well was measured with the microplate reader (Model 3550, BIO-RAD, Tokyo, Japan). The percentage of degranulation was calculated by the following formula:
F-actin assay
Total F-actin content in RBL-2H3 cells was measured as described by Frigeri & Apgar (1999) with some modification. RBL-2H3 cells (2.5×10⁵ cells per well) in 24-well cluster plates were fixed with 3.7% formaldehyde in HEPES buffered solution (in mM: NaCl 125.4, glucose 11.5, KCl 5.9, MgCl2 1.2, HEPES 10, pH 7.4, either CaCl2 1.5 or EGTA 0.5) for 15 min at 37°C after the incubations specified in the Results section below. Cells were washed with HEPES buffered solution, and permeabilized by 0.2% Triton X-100 in HEPES buffered solution for 90 s. Cells were washed twice and stained by FITC-labelled phalloidin (FITC-phalloidin, 6 u ml−1) for 2.5 h in a dark room at room temperature. The cells were washed three times with HEPES buffered solution, and FITC-phalloidin bound to F-actin was extracted by incubating the cells with 75% methanol for 2 h in a dark room at 4°C. The relative fluorescence of the supernatant, which included the extracts, was measured using a spectrofluorometer (JASCO, Tokyo, Japan) with an excitation wavelength of 495 nm and an emission wavelength of 520 nm. The percentage of F-actin was given by taking the resting value to be 100%.
Measurement of [Ca2+]i
RBL-2H3 cells grown on glass cover slips were washed twice with HEPES buffered solution. Cells were loaded with fura-PE3 by exposure to HEPES buffered solution containing 5 μM fura-PE3 acetoxymethyl ester with 0.01% cremophor EL for 40 min in a dark room at 37°C. For fluorescence measurements, cells on glass cover slips were placed in a bath on the stage of an inverted microscope (TE-300, Nikon, Tokyo, Japan) equipped with a 40 fold objective lens. The acquisition and analysis were done with a Ca2+-imaging system (PTI-4700, Photon Technology International, NJ, U.S.A.). Images of 510 nm fluorescence were captured using 340 and 380 nm wavelength light. Every 3 s, the images at 340 nm were divided by the images at 380 nm to provide resultant ratio images that are indicators of [Ca2+]i. Data are expressed as relative values that are derived by taking the resting level of [Ca2+]i as 0% and the level in the presence of 3 μM ionomycin with 3 mM Ca2+ as 100%. [Ca2+]i was measured within regions of interest that consisted of pixel arrays in which all points were averaged together. All experiments were performed at 37°C.
Quantification of the [Ca2+]i oscillations
In RBL-2H3 cells, the changes in [Ca2+]i induced by antigens were oscillatory, asynchronous, irregular and varied tremendously amongst cells. In this type of cell, measuring the area under the antigen-induced Δ [Ca2+]i per time curve (area under the curve; AUC) was effective for quantifying the antigen-induced response (Narenjkar et al., 1999). The following equation was used for calculating the AUC of each response:
The area for each section was calculated as a trapezoid whose heights were Yi and Yi+1 and whose base was equal to the interval time between each two samples (ΔX=3 s). Finally, the calculated areas for all sections were summed.
Assay of IP3
IP3 was measured as described by Ishii et al. (1997), with some modification, using an IP3 [3H] radioreceptor assay kit. IgE-sensitized RBL-2H3 cells (4×10⁵ cells per well) in 24-well cluster plates were washed three times with HEPES buffered solution. The attached cells were stimulated with DNP-HSA at 37°C in HEPES buffered solution. The reaction was halted using ice-cold 16% trichloroacetic acid. The amount of IP3 in the extract was detected according to the manufacturer's instructions.
Chemicals
Drugs and chemicals used were dinitrophenyl (DNP)-human serum albumin (DNP-HSA), mouse monoclonal anti-DNP (anti-DNP-IgE), cytochalasin D, thapsigargin, U73122, U73343, Triton X-100, p-nitrophenyl-N-acetyl-β-D-glucosamide, DMEM powder, BSA (Sigma chemicals, St. Louis, MO, U.S.A.), jasplakinolide, FITC-phalloidin (Molecular Probes, Eugene, OR, U.S.A.), fura-PE3/AM (TEF LABS, Austin, TX, U.S.A.), cremophor EL (Nacalai Tesque, Tokyo, Japan), EGTA (Dojindo Laboratories, Kumamoto, Japan) and foetal bovine serum (Filtron, Brooklyn, Australia). IP3 [3H] radioreceptor assay kit (DuPont NEN, Boston, MA, U.S.A.). Mycalolide B and xestospongin C were kindly donated by Dr N. Fusetani (The University of Tokyo, Japan) and Dr M. Kobayashi (The University of Osaka), respectively.
Statistical analysis
The results of the experiments were expressed as means±s.e.mean. Statistical evaluation of the data was performed using the unpaired Student's t-test for comparisons between pairs of groups and by one-way analysis of variance (ANOVA) followed by either Dunnett's test or the Tukey test for comparisons among more than two groups. A value of P<0.05 was taken as significant.
Results
Cytochalasin D increased DNP-HSA-induced degranulation
In the IgE-sensitized RBL-2H3 cells, the intracellular β-hexosaminidase was released by DNP-HSA (0.01–100 ng ml−1) stimulation for 30 min in PIPES buffered solution in a concentration-dependent manner. Because 10 ng ml−1 DNP-HSA induced the submaximum degranulation, this concentration of DNP-HSA was employed in the following experiments. Treatment of the cells with 300 nM cytochalasin D, a widely utilized membrane-permeate inhibitor of actin polymerization, had no effect on the basal degranulation of β-hexosaminidase (5.5±0.4%, n=3, control; 7.6±1.0%, n=3, in the presence of cytochalasin D). However, 10 nM–3 μM cytochalasin D enhanced the degranulation induced by DNP-HSA (10 ng ml−1) in a concentration-dependent manner and found that degranulation was enhanced submaximally by cytochalasin D at 300 nM (n=4). As shown in Figure 1, pretreatment of the cells for 15 min with cytochalasin D (300 nM) significantly increased DNP-HSA-induced degranulation.
Figure 1.
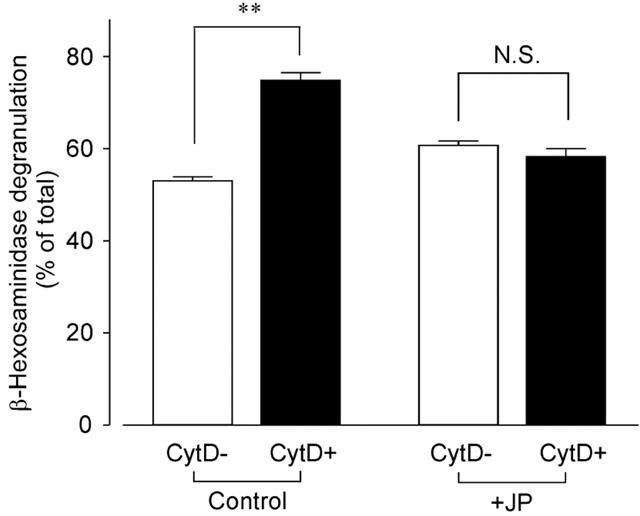
Effect of cytochalasin D on DNP-HSA-induced β-hexosaminidase degranulation. RBL-2H3 cells were preincubated without (Control) or with jasplakinolide (3 μM) for 45 min (+JP) in the presence (CytD+) or absence (CytD−) of cytochalasin D (300 nM) for the last 15 min followed by the addition of DNP-HSA (10 ng ml−1) for 30 min to induce degranulation. The percentages of released β-hexosaminidase were calculated against the total amount of β-hexosaminidase. Results are expressed as means±s.e.mean of 10–14 experiments. **Significantly different with P<0.01. N.S. Not significantly different.
We then examined the effect of jasplakinolide, a cell-permeate stabilizer of actin filaments (Patterson et al., 1999; Rosado et al., 2000), on β-hexosaminidase degranulation. Treatment of the cells with jasplakinolide (3 μM) for 75 min had no effect on the degranulation (4.5±0.6%, n=4) under the resting condition. On the other hand, the effect of cytochalasin D to enhance the DNP-HSA-induced degranulation was suppressed by pretreatment with 0.1–3 μM jasplakinolide for 45 min in a concentration-dependent manner (data not shown). As shown in Figure 1, 3 μM jasplakinolide completely inhibited the effect of cytochalasin D on degranulation.
Cytochalasin D inhibited DNP-HSA-induced F-actin polymerization
As shown in Figure 2a, IgE-sensitization (overnight) significantly increased F-actin content. Incubation of IgE-sensitized RBL-2H3 cells with cytochalasin D (300 nM) for 20 min did not change the F-actin content under the resting condition (Figure 2b). Exposure of the RBL-2H3 cells to DNP-HSA (10 ng ml−1) for 5 min increased F-actin. Preincubation with cytochalasin D for 15 min completely prevented the F-actin polymerization induced by DNP-HSA.
Figure 2.
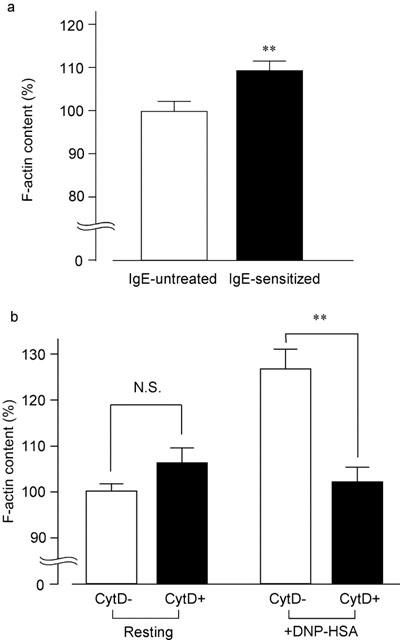
Effect of cytochalasin D on DNP-HSA-induced F-actin polymerization. (a) RBL-2H3 cells were treated without (IgE-untreated) or with IgE (0.05 μg ml−1; IgE-sensitized) overnight. The F-actin content is shown as a percentage of the F-actin content in IgE-untreated cells. (b) IgE-sensitized RBL-2H3 cells were preincubated with (CytD+) or without cytochalasin D (300 nM) for 15 min (CytD−), followed by incubation without (Resting) or with DNP-HSA (10 ng ml−1) for 5 min (+DNP-HSA). The F-actin content is shown as a percentage of the F-actin content at the resting state. Results are expressed as means±s.e.mean of 8–20 experiments. **Significantly different with P<0.01. N.S. Not significantly different.
Actin disassembly increased [Ca2+]i in IgE-sensitized cells
In the absence of anti-DNP IgE sensitization, neither cytochalasin D (300 nM) (Figure 3a, n=37) nor mycalolide B (100 nM) (Figure 3b, n=49), another inhibitor of actin polymerization that severs F-actin (Hori et al., 1993; Saito et al., 1994; Saito & Karaki, 1996), changed the basal [Ca2+]i in RBL-2H3 cells.
Figure 3.
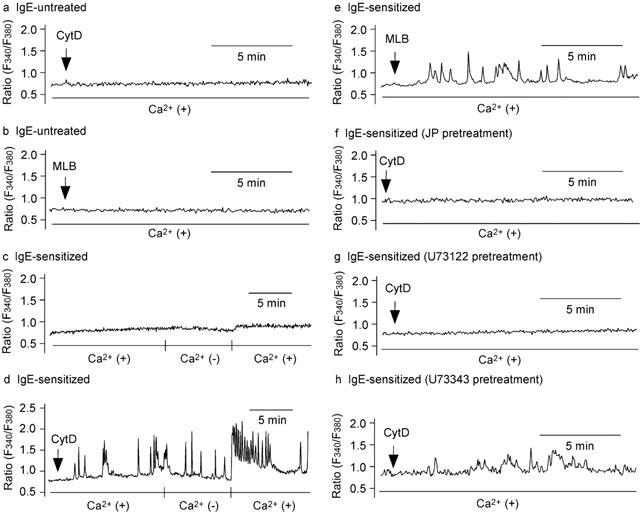
Effect of actin disassembly on [Ca2+]i in IgE-sensitized and untreated cells. Cytochalasin D (CytD) (300 nM) (a) or mycalolide B (MLB) (100 nM) (b) was added to the RBL-2H3 cells without a sensitization by anti-DNP IgE. The IgE-sensitized cells were incubated without (c) or with cytochalasin D for 15 min (d). Ca2+ was removed from the medium for 7 min, and re-added for 10 min. (e) The IgE-sensitized cells were incubated with mycalolide B for 15 min. (f) The IgE-sensitized cells were preincubated with jasplakinolide (JP) (3 μM) for 30 min and subsequently incubated with cytochalasin D for 15 min. The IgE-sensitized cells were preincubated with U73122 (g) or U73343 (h) for 10 min and subsequently incubated with cytochalasin D for 15 min. Typical recordings are shown (n=37–99).
In RBL-2H3 cells sensitized to anti-DNP IgE (0.05 μg ml−1) for 12–24 h, the basal level of [Ca2+]i was stable regardless of the existence of external Ca2+ (Figure 3c). The addition of cytochalasin D (300 nM) induced frequent [Ca2+]i oscillations in 59 out of 99 cells (59.6% of cells). Ca2+ oscillations were observed at least 7 min after removal of external Ca2+. Re-addition of Ca2+ increased [Ca2+]i in the presence of cytochalasin D (Figure 3d), but failed to increase it in the absence of cytochalasin D (Figure 3c). [Ca2+]i oscillations were also observed in 41 out of 45 cells (91.1% of cells) when mycalolide B (100 nM) was applied for 15 min (Figure 3e). Pretreatment of the cells with jasplakinolide (3 μM) for 30 min abolished the [Ca2+]i oscillations induced by cytochalasin D in all IgE-sensitized cells (Figure 3f, n=62).
Pretreatment of the cells with U73122 (100 nM), an inhibitor of phospholipase C, for 10 min abolished [Ca2+]i oscillations induced by cytochalasin D (300 nM) in all IgE-sensitized cells (Figure 3g, n=38). It is well known that this concentration of U73122 is selective for phospholipase C (Seebeck et al., 1998). In the presence of U73343 (100 nM), an analogue of U73122 that acts as a weak inhibitor of phospholipase C (Seebeck et al., 1998), cytochalasin D induced [Ca2+]i oscillations in 23 out of 42 cells (54.8% of cells), indicating that U73343 is ineffective (Figure 3h).
DNP-HSA-induced increase in [Ca2+]i and IP3 production was enhanced by actin disassembly
DNP-HSA (10 ng ml−1) induced an oscillatory increase in [Ca2+]i (Figure 4a), which was enhanced by pretreatment with cytochalasin D (300 nM) for 15 min. These results were summarized in Figure 4b and also analysed by measuring the area under the curve (AUC) for 10 min after the DNP-HSA stimulation. As shown in Figure 4c, cytochalasin D significantly increased AUC. To further clarify the role of actin polymerization on the DNP-HSA-induced increase in [Ca2+]i, we examined the effect of jasplakinolide. Pretreatment of the cells with jasplakinolide (3 μM) for 45 min did not change the resting [Ca2+]i (n=49), and had no effect on the DNP-HSA-induced increase in [Ca2+]i (Figure 4c). The effect of cytochalasin D in augmenting [Ca2+]i was completely suppressed by jasplakinolide.
Figure 4.
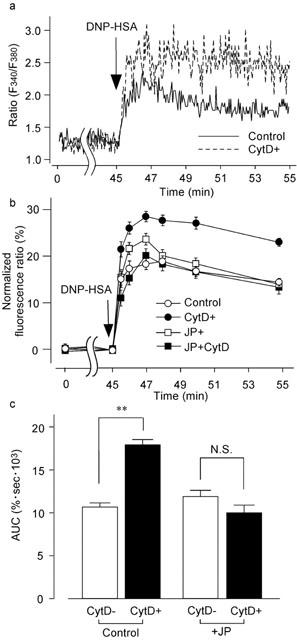
Effect of actin disassembly on the DNP-HSA-induced increase in [Ca2+]i. (a) Typical recording of 10 ng ml−1 DNP-HSA-induced increase in [Ca2+]i in the fura-PE3-loaded RBL-2H3 cells without (Control) or with cytochalasin D (CytD+). Cells were preincubated with cytochalasin D (300 nM) for 15 min. (b) Quantified results of [Ca2+]i induced by DNP-HSA (10 ng ml−1). The RBL-2H3 cells were preincubated without (Control) or with jasplakinolide (3 μM) for 45 min (+JP) in the presence (CytD+) or absence (CytD−) of cytochalasin D (300 nM) for the last 15 min. (c) AUC for 10 min after the DNP-HSA stimulation. Results are expressed as means±s.e.mean of 34–49 cells. **Significantly different with P<0.01. N.S. Not significantly different.
As shown in Figure 5, DNP-HSA (10 ng ml−1) induced IP3 production that lasted for at least 10 min after the DNP-HSA stimulation. In RBL-2H3 cells treated with cytochalasin D (300 nM) for 15 min, the levels of DNP-HSA-induced IP3 production at 5 and 10 min were significantly increased.
Figure 5.
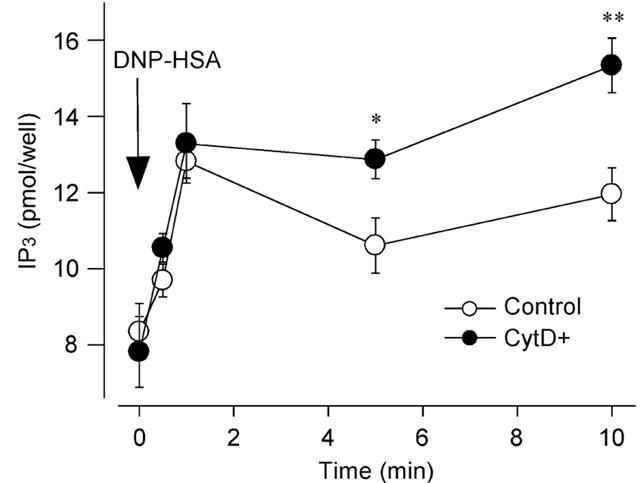
Effect of cytochalasin D on DNP-HSA-induced IP3 production. Quantified results of IP3 production induced by DNP-HSA. The RBL-2H3 cells were preincubated without (Control) or with 300 nM cytochalasin D (CytD+) for 15 min. IP3 production was measured at ., 30 s, 1, 5 and 10 min after the DNP-HSA (10 ng ml−1) stimulation. Results are expressed as means±s.e.mean of six experiments. Significantly different with *P<0.05, **P<0.01.
Ca2+ release was activated by cytochalasin D
In the absence of extracellular Ca2+, DNP-HSA (10 ng ml−1) induced a phasic increase in [Ca2+]i that may be attributable to Ca2+ release from the endoplasmic reticulum (ER) (Gericke et al., 1995). DNP-HSA-induced Ca2+ releases were diverse in frequency, amplitude and shape. Figure 6a shows the two representative patterns of DNP-HSA-induced Ca2+ release. In 24 out of 36 cells (66.7%), mono-phasic Ca2+ release was observed after DNP-HSA stimulation (Figure 6a left), whereas, in the remaining 12 cells (33.3%), several Ca2+ spikes were observed (Figure 6a right). In the cells pretreated with cytochalasin D (300 nM) for 15 min, the time lag between stimulation and Ca2+ release was shorter than that which occurred in the absence of cytochalasin D (Figure 6b). To characterize the effect of cytochalasin D on Ca2+ release due to DNP-HSA, we calculated the time required to initiate the [Ca2+]i increase after the addition of DNP-HSA (Figure 6c), and the time-to-peak after the addition of DNP-HSA (Figure 6d). Pretreatment of the cells with cytochalasin D significantly shortened the lag period. The time-to-peak period was also significantly shortened by cytochalasin D. We also calculated the piles of AUC for Ca2+ release induced by DNP-HSA (Figure 6e). The data show that, compared to the response in the control, Ca2+ was released at a significantly faster rate in the cytochalasin D-treated cells. As shown in the inset in Figure 6e, the total amount of Ca2+ released from the ER in the cytochalasin D-treated cells did not differ from that released from the ER in the control cells. To evaluate the amount of Ca2+ remaining in ER after DNP-HSA stimulation in Ca2+-free solution, thapsigargin (100 nM) was applied 5 min after the addition of DNP-HSA. Both in the cytochalasin D-treated cells and in the untreated cells, thapsigargin did not induce Ca2+ release (n=13, 16).
Figure 6.
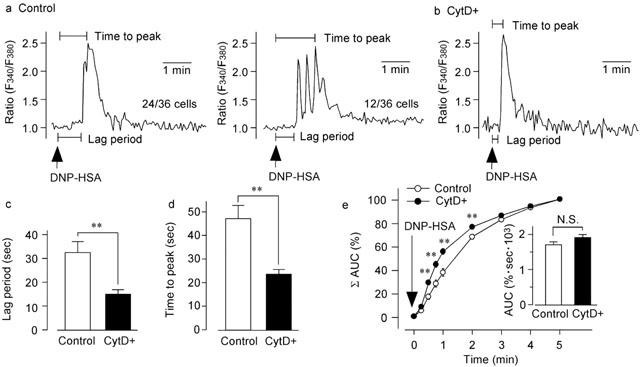
Effect of cytochalasin D on DNP-HSA-induced Ca2+ release. (a) Typical recordings of 10 ng ml−1 DNP-HSA-induced Ca2+ release in the absence of extracellular Ca2+ and in the presence of 0.5 mM EGTA. DNP-HSA was applied 2 min after RBL-2H3 cells were exposed to Ca2+-free solution. (b) Typical recordings of DNP-HSA-induced Ca2+ release in the cells preincubated with cytochalasin D (300 nM) for 15 min. (c) Time between DNP-HSA stimulation and the first Ca2+ release (Lag period) in the cells preincubated without (Control) or with cytochalasin D (300 nM) for 15 min (CytD+). (d) Time between DNP-HSA stimulation and the [Ca2+]i peak (Time to peak) in the cells preincubated without (Control) or with cytochalasin D (300 nM) for 15 min (CytD+). (e) Normalized-piles of AUC of the DNP-HSA-induced Ca2+ release in the cells preincubated without (Control) or with cytochalasin D (300 nM) (CytD+). The total AUC for a 5 min DNP-HSA stimulation was taken as 100%. Inset: AUC for 5 min after DNP-HSA stimulation of the cells preincubated without (Control) or with cytochalasin D (CytD+). Results are expressed as means±s.e.mean of 33–36 cells. **Significantly different with P<0.01. N.S. Not significantly different.
DNP-HSA-induced Ca2+ influx was enhanced by cytochalasin D
In the absence of extracellular Ca2+, the addition of DNP-HSA (10 ng ml−1) evoked a transient increase in [Ca2+]i as described above. The subsequent addition of 1.5 mM Ca2+ to the external medium induced a sustained increase in [Ca2+]i (Figure 7a). The Ca2+ influx induced by the addition of 1.5 mM Ca2+ was enhanced by cytochalasin D (300 nM). Pretreatment of the cells with mycalolide B (100 nM) for 15 min also enhanced Ca2+ influx. The increase in [Ca2+]i due to the addition of Ca2+ as analysed by AUC in Figure 7b indicated that both cytochalasin D and mycalolide B significantly increased the Ca2+ influx.
Figure 7.
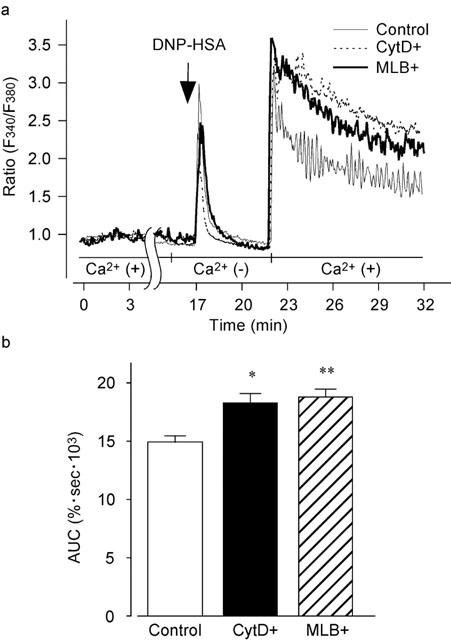
Augmentation of DNP-HSA-induced Ca2+ influx by actin disassembly. (a) The fura-PE3-loaded RBL-2H3 cells were treated with 300 nM cytochalasin D (CytD+), 100 nM mycalolide B (MLB+) or with neither agent (Control) in normal HEPES buffered solution for 15 min. After stimulation with DNP-HSA (10 ng ml−1) for 5 min in the absence of Ca2+ (with 0.5 mM EGTA), 1.5 mM Ca2+ was added to the medium without EGTA. Typical recordings are shown in panel a. (b) AUC for 10 min after the addition of 1.5 mM Ca2+. Results are expressed as means±s.e.mean of 27–57 cells. Significantly different with *P<0.05, **P<0.01.
To elucidate the role of IP3 in the sustained [Ca2+]i increase, we examined the effect of xestospongin C, a novel membrane-permeable inhibitor of inositol 1,4,5-triphosphate (IP3) receptor (Gafni et al., 1997). After stimulation with DNP-HSA for 5 min in the absence of external Ca2+ to deplete the Ca2+ store, cells were treated with xestospongin C (10 μM) for 15 min with or without cytochalasin D (300 nM). The subsequent addition of 1.5 mM Ca2+ to the medium induced a rapid and sustained increase in [Ca2+]i in these cells (Figure 8a). Xestospongin C decreased the [Ca2+]i that was induced by the re-addition of Ca2+. As shown in Figure 8c, the AUC in the presence of xestospongin C was significantly smaller than that in the control. Cytochalasin D also significantly increased [Ca2+]i (Figure 8b), and this effect was decreased by xestospongin C to the level in the presence of xestospongin C alone (Figure 8c; P>0.05).
Figure 8.
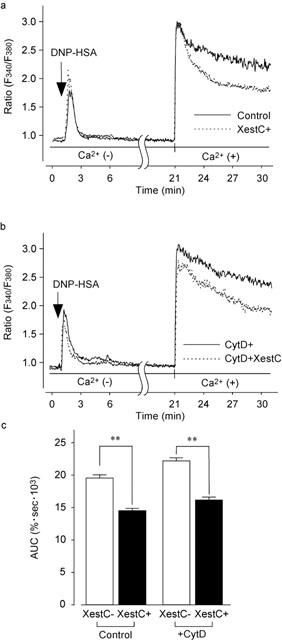
Augmentation of DNP-HSA-induced Ca2+ influx by actin disassembly and its inhibition by xestospongin C. (a) The fura-PE3-loaded RBL-2H3 cells were stimulated with DNP-HSA (10 ng ml−1) in a Ca2+-free solution for 5 min. The cells were subsequently incubated without (Control) or with xestospongin C (10 μM) for 15 min (XestC+). Then 1.5 mM Ca2+ was added to external space. Typical recordings are shown in panel a. (b) The fura-PE3-loaded RBL-2H3 cells were stimulated with DNP-HSA (10 ng ml−1) in the Ca2+-free solution for 5 min. The cells were subsequently incubated with cytochalasin D (300 nM), and without (CytD+) or with xestospongin C (10 μM) for 15 min (CytD+XestC). Then 1.5 mM Ca2+ was added to external space. Typical recordings are shown in panel b. (c) AUC for 10 min after the addition of Ca2+. Results are expressed as means±s.e.mean of 37–45 cells. Significantly different with **P<0.01.
We also examined the effect of xestospongin C on thapsigargin-induced increment in [Ca2+]i. Xestospongin C (10 μM) did not affect the thapsigargin-induced increase in [Ca2+]i (n=37, 40), suggesting that xestospongin C did not affect directly SOCs activation (Oka et al., 2002).
Thapsigargin-induced Ca2+ release and influx were not enhanced by cytochalasin D
As shown in Figure 9a, thapsigargin (100 nM) evoked a transient increase in [Ca2+]i in the absence of extracellular Ca2+. After reaching the peak, the thapsigargin-induced transient increase in [Ca2+]i gradually decreased to a level below the resting level in 5 min. DNP-HSA (10 ng ml−1) that was added 5 min after the thapsigargin stimulation did not have any effect (n=15). The addition of 0.1 mM Ca2+ induced a sustained increase in [Ca2+]i. Pretreatment of the cells with neither cytochalasin D (300 nM) for 15 min nor jasplakinolide (3 μM) for 45 min changed the increase in [Ca2+]i that was induced not only by thapsigargin but also by the addition of 0.1 mM Ca2+ to the medium containing thapsigargin (Figure 9a). Measurements of AUC supported these conclusions as shown in Figure 9b,c. We also calculated the time required to initiate the [Ca2+]i increase and the time-to-peak after the addition of thapsigargin in the absence of Ca2+, and found that there were no differences between the cells incubated with or without cytochalasin D (lag period; 5.8±0.9 s, n=16, control cells; 5.4±0.7 s, n=20, cytochalasin D-treated cells: time-to-peak; 30.6±2.6 s, n=16, control cells; 27.3±3.3 s, n=20, cytochalasin D-treated cells).
Figure 9.
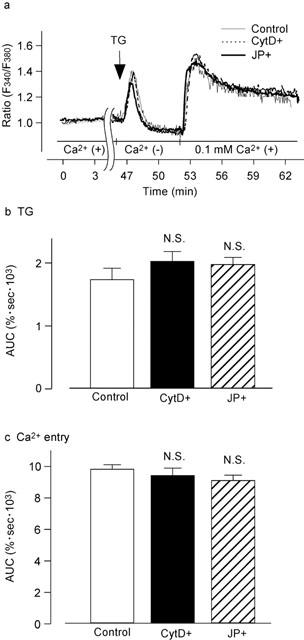
Effect of actin disassembly on the thapsigargin-induced increase in [Ca2+]i. (a) The fura-PE3-loaded RBL-2H3 cells were treated without (Control) or with 300 nM cytochalasin D for 15 min (CytD+) or 3 μM jasplakinolide for 45 min (JP+). The cells were subsequently stimulated with 100 nM thapsigargin (TG) for 5 min in the absence of Ca2+ (with 0.5 mM EGTA). Then 0.1 mM Ca2+ was added to the medium without EGTA. Note that 0.1 mM Ca2+, instead of 1.5 mM Ca2+, was applied to the medium in this series of experiments because capacitative Ca2+ entry (CCE) was strongly and maximally activated by thapsigargin. Typical traces are shown in panel a. (b) AUC for 5 min after stimulation with thapsigargin. (c) AUC for 10 min after the addition of 0.1 mM Ca2+. Results are expressed as means±s.e.mean of 29–37 cells. N.S. Not significantly different.
Discussion
Reorganization of actin assembly has been shown to be involved in the degranulation of mast cells (Tasaka, 1994; Holowka et al., 2000). As demonstrated in Figure 2b, DNP-HSA increased F-actin in RBL-2H3 cells, and cytochalasin D prevented this antigen-induced actin polymerization. However, as was observed in the platelets (Rosado et al., 2000), cytochalasin D did not change the basal level of F-actin. Because cytochalasin D inhibits actin polymerization by binding and capping the barbed end of the actin filaments (Cooper, 1987; 1991), it is suggested that the ‘treadmilling' of actin in RBL-2H3 cells at the resting condition is very slow (Fox & Phillips, 1981). As demonstrated in Figure 1, the degranulation of β-hexosaminidase induced by DNA-HSA was augmented by cytochalasin D, and this augmentation was inhibited by jasplakinolide, an actin stabilizer (Patterson et al., 1999; Rosado et al., 2000). These results suggest that actin assembly plays an important role in the mast cell degranulation. The aim of this study is to clarify the role of actin assembly mediated by the cross-linking of IgE-FcεRI in mast cells.
As demonstrated in Figure 3a,b, neither cytochalasin D nor mycalolide B, another actin depolymerizing agent (Hori et al., 1993; Saito et al., 1994; Saito & Karaki, 1996), changed the resting level of [Ca2+]i in the absence of IgE sensitization. However, these actin depolymerizers induced oscillatory increments in [Ca2+]i in the IgE-sensitized cells (Figure 3d,e), and these [Ca2+]i oscillations were eliminated by an actin stabilizer, jasplakinolide (Figure 3f), suggesting that IgE sensitization alone changes the responsiveness of cells to actin depolymerizers. Indeed, IgE sensitization increased F-actin content (Figure 2a). The Ca2+ oscillations induced by cytochalasin D continued for at least 7 min after the removal of extracellular Ca2+ and subsequent addition of Ca2+ induced Ca2+ influx (Figure 3d), which was not induced in the absence of cytochalasin D (Figure 3c), suggesting that cytochalasin D-induced Ca2+ oscillations may be largely attributable to the Ca2+ release from the ER. U73122, a phospholipase C (PLC) inhibitor (Seebeck et al., 1998), completely inhibited the [Ca2+]i oscillations induced by cytochalasin D (Figure 3g). Considering that cross-linking of FcεRI by multivalent antigen with receptor-bound antigen-specific IgE leads to the activation of non-receptor tyrosine kinases, Lyn and Syk, which is involved in the activation of PLC (Reischl et al., 1999), IgE-FcεRI-meditaed [Ca2+]i oscillations in the presence of actin depolymerizing agents may be induced through the activation of PLC.
We next examined whether or not these actin depolymerizers affect the [Ca2+]i mobilization, which was induced by antigen-mediated cross-linking of FcεRI. As shown in Figure 4, cytochalasin D enhanced the DNP-HSA-induced increase in [Ca2+]i in the IgE-treated cells, and jasplakinolide completely prevented this enhancement. The actin depolymerizer also increased IP3 production, which was induced by cross-linking of FcεRI (Figure 5). These results suggest that PLC phosphorylation may mediate the release of DNP-HSA-induced Ca2+ by inhibiting actin polymerization, as discussed above.
It is well known that in non-excitable cells there are two crucial sources of Ca2+ for signalling: IP3-mediated Ca2+ release from internal Ca2+ stores and the subsequent Ca2+ influx, CCE, from external space (Putney & Bird, 1993; Parekh & Penner, 1997). Therefore, we investigated the effect of actin disassembly on both Ca2+ release and CCE.
To investigate the possibility that actin assembly modulates Ca2+ release, we examined the effect of cytochalasin D on the DNP-HSA-induced Ca2+ release from ER in Ca2+-free solution. As shown in Figure 6, cytochalasin D shortened the time lag for DNP-HSA-induced Ca2+ release, suggesting that cytochalasin D accelerates Ca2+ release from ER in the RBL-2H3 cells stimulated by DNP-HSA. Recently, it has been shown that the inhibition of F-actin polymerization enhances antigen-stimulated tyrosine phosphorylation of FcεRI, and that RBL-2H3 cells stimulated with antigen in the presence of cytochalasin D exhibited an increase in tyrosine phosphorylation of the β subunit of FcεRI (Holowka et al., 2000). These results suggest that the inhibition of F-actin polymerization regulates antigen-stimulated increase in [Ca2+]i, but further investigation is needed to clarify this point.
As demonstrated in Figures 7 and 8, the re-addition of Ca2+ to the store-depleted cells, which had been stimulated by DNP-HSA in Ca2+-free solution, induced a prolonged increase in [Ca2+]i by CCE, and this sustained increase was enhanced by both cytochalasin D and mycalolide B. To investigate whether IP3 production is related to the sustained increase in [Ca2+]i, we used a membrane-permeable blocker of IP3 receptor, xestospongin C (Gafni et al., 1997). As demonstrated in Figure 8, xestospongin C significantly decreased the DNP-HSA-induced sustained increase in [Ca2+]i. Furthermore, xestospongin C decreased the sustained [Ca2+]i that had been augmented by cytochalasin D to the control level. Several papers have suggested that one obvious role of CCE is to replenish the intracellular Ca2+ stores (Takemura & Putney, 1989; Parekh & Penner, 1997), and that, in the sustained phase of oscillatory increase in [Ca2+]i, IP3 participates in the release of Ca2+ (Figures 4 and 5) (Millard et al., 1989; Nash et al., 2001). We propose that these results, taken together, suggest that actin disassembly may enhance the sustained increase in [Ca2+]i that is induced by DNP-HSA through the activation of IP3 production.
One crucial remaining question was whether the augmented Ca2+ release directly participates in the enhancement of the increase in [Ca2+]i or the potentiation of CCE. As shown in Figure 6e, cytochalasin D accelerated the Ca2+ release without changing the total amount of released Ca2+, suggesting that the sustained increase in [Ca2+]i is not dependent on the Ca2+ release but on the Ca2+ influx from external space, CCE. Sedova et al. (2000) showed that, in the vascular endothelium, the activity of CCE is proportional to the level of store filling over the wide range. These results suggest that the release of replenished Ca2+, which is accelerated by actin depolymerizers, may result in the augmentation of further Ca2+ depletion in the ER, and that this profound depletion of stored Ca2+ may eventually enhance the total activity of CCE.
To evaluate the possibility that actin may affect CCE by directly changing the SOCs activity, we activated SOCs without a concomitant rise in IP3 by depleting the store using thapsigargin (Ribeiro et al., 1997; Rosado et al., 2000). As demonstrated in Figure 9, neither the thapsigargin-induced Ca2+ release nor the activation of CCE was affected by cytochalasin D and jasplakinolide, suggesting that the actin does not directly affect SOCs. In NIH3T3 cells, it has been also reported that cytochalasin D did not alter the thapsigargin-activated CCE (Ribeiro et al., 1997).
The degranulation in mast cells is closely related to [Ca2+]i (Sullivan et al., 1999; Aketani et al., 2001). In the present experiments, cytochalasin D augmented both the degranulation and [Ca2+]i, which were induced by DNP-HSA. Moreover, the cytochalasin D-induced augmentations were inhibited by jasplakinolide (Figures 1 and 4). These results suggest that the inhibition of actin polymerization might be involved in the augmentation of degranulation through the increment in [Ca2+]i.
Graier et al. (1998) have demonstrated that the increase in [Ca2+]i due to a submaximal concentration of bradykinin in porcine endothelial cells can be observed when the cells are treated with nocodasol, an inhibitor of microtubules. They speculated that the disruption of the microtubule assembly may affect the subcellular Ca2+ signalling and thus change the responsiveness of fura-2 to the agonist. In the present study, however, we observed close correlation between the change in fura-PE3 signals and IP3 production (Figures 4 and 5). In addition, degranulation was also closely associated with the changes in [Ca2+]i as detected by fura-PE3 (Figure 1). These data suggest that fura-PE3 signals in the RBL-2H3 cells represent the averaged concentration of cytosolic Ca2+ and that the disruption of actin assembly does not affect the subcellular Ca2+ signals, unlike the case with porcine endothelial cells, in which the microtubule assembly was disrupted.
In conclusion, in RBL-2H3 cells, the inhibition of antigen-induced actin assembly may regulate the activity of PLC in a manner that increases [Ca2+]i and degranulation without any direct effect on SOCs activity. It is suggested that the antigen-induced acceleration of actin assembly may serve as a negative feedback control in the mast cell degranulation.
Acknowledgments
This work was supported by a Program for Promotion of Basic Research Activities for Innovative Biosciences (BRAIN) and a Grant-in-Aid for Scientific Research from the Ministry of Education, Culture and Sciences.
Abbreviations
- CCE
capacitative calcium entry
- DNP-HSA
dinitrophenyl-human serum albumin
- ER
endoplasmic reticulum
- FcεRI
high-affinity receptor for the Fc region of IgE
- IgE
immunoglobulin E
- IP3
inositol 1,4,5-triphosphate
- RBL
rat basophilic leukaemia
- SOCs
store-operated channels
References
- AKETANI S., TESHIMA R., UMEZAWA Y., SAWADA J. Correlation between cytosolic calcium concentration and degranulation in RBL-2H3 cells in the presence of various concentrations of antigen-specific IgEs. Immunol. Lett. 2001;75:185–189. doi: 10.1016/s0165-2478(00)00311-4. [DOI] [PubMed] [Google Scholar]
- BARKALOW K., HARTWIG J.H. The role of actin filament barbed-end exposure in cytoskeletal dynamics and cell motility. Biochem. Soc. Trans. 1995;23:451–456. doi: 10.1042/bst0230451. [DOI] [PubMed] [Google Scholar]
- BERRIDGE M.J. Inositol trisphosphate and calcium signalling. Nature. 1993;361:315–325. doi: 10.1038/361315a0. [DOI] [PubMed] [Google Scholar]
- CARLIER M.F., PANTALONI D. Control of actin dynamics in cell motility. J. Mol. Biol. 1997;269:459–467. doi: 10.1006/jmbi.1997.1062. [DOI] [PubMed] [Google Scholar]
- CLAPHAM D.E. Intracellular calcium. Replenishing the stores. Nature. 1995;375:634–635. doi: 10.1038/375634a0. [DOI] [PubMed] [Google Scholar]
- COOPER J.A. Effects of cytochalasin and phalloidin on actin. J. Cell. Biol. 1987;105:1473–1478. doi: 10.1083/jcb.105.4.1473. [DOI] [PMC free article] [PubMed] [Google Scholar]
- COOPER J.A. The role of actin polymerization in cell motility. Annu. Rev. Physiol. 1991;53:585–605. doi: 10.1146/annurev.ph.53.030191.003101. [DOI] [PubMed] [Google Scholar]
- FOX J.E., PHILLIPS D.R. Inhibition of actin polymerization in blood platelets by cytochalasins. Nature. 1981;292:650–652. doi: 10.1038/292650a0. [DOI] [PubMed] [Google Scholar]
- FRIGERI L., APGAR J.R. The role of actin microfilaments in the down-regulation of the degranulation response in RBL-2H3 mast cells. J. Immunol. 1999;162:2243–2250. [PubMed] [Google Scholar]
- GAFNI J., MUNSCH J.A., LAM T.H., CATLIN M.C., COSTA L.G., MOLINSKI T.F., PESSAH I.N. Xestospongins: potent membrane permeable blockers of the inositol 1,4,5- trisphosphate receptor. Neuron. 1997;19:723–733. doi: 10.1016/s0896-6273(00)80384-0. [DOI] [PubMed] [Google Scholar]
- GERICKE M., DAR O., DROOGMANS G., PECHT I., NILIUS B. Immunological stimulation of single rat basophilic leukemia RBL-2H3 cells co-activates Ca2+-entry and K+-channels. Cell Calcium. 1995;17:71–83. doi: 10.1016/0143-4160(95)90104-3. [DOI] [PubMed] [Google Scholar]
- GRAIER W.F., PALTAUF-DOBURZYNSKA J., HILL B.J., FLEISCHHACKER E., HOEBEL B.G., KOSTNER G.M., STUREK M. Submaximal stimulation of porcine endothelial cells causes focal Ca2+ elevation beneath the cell membrane. J. Physiol. 1998;506:109–125. doi: 10.1111/j.1469-7793.1998.109bx.x. [DOI] [PMC free article] [PubMed] [Google Scholar]
- HOLOWKA D., SHEETS E.D., BAIRD B. Interactions between Fc(epsilon)RI and lipid raft components are regulated by the actin cytoskeleton. J. Cell. Sci. 2000;113:1009–1019. doi: 10.1242/jcs.113.6.1009. [DOI] [PubMed] [Google Scholar]
- HORI M., SAITO S., SHIN Y.Z., OZAKI H., FUSETANI N., KARAKI H. Mycalolide-B, a novel and specific inhibitor of actomyosin ATPase isolated from marine sponge. FEBS Lett. 1993;322:151–154. doi: 10.1016/0014-5793(93)81557-g. [DOI] [PubMed] [Google Scholar]
- ISHII I., IZUMI T., TSUKAMOTO H., UMEYAMA H., UI M., SHIMIZU T. Alanine exchanges of polar amino acids in the transmembrane domains of a platelet-activating factor receptor generate both constitutively active and inactive mutants. J. Biol. Chem. 1997;272:7846–7854. doi: 10.1074/jbc.272.12.7846. [DOI] [PubMed] [Google Scholar]
- JOUVIN M.H., NUMEROF R.P., KINET J.P. Signal transduction through the conserved motifs of the high affinity IgE receptor Fc epsilon RI. Semin. Immunol. 1995;7:29–35. doi: 10.1016/1044-5323(95)90005-5. [DOI] [PubMed] [Google Scholar]
- LEWIS R.S. Store-operated calcium channels. Adv. Sec. Messenger Phosphoprotein Res. 1999;33:279–307. doi: 10.1016/s1040-7952(99)80014-7. [DOI] [PubMed] [Google Scholar]
- MILLARD P.J., RYAN T.A., WEBB W.W., FEWTRELL C. Immunoglobulin E receptor cross-linking induces oscillations in intracellular free ionized calcium in individual tumor mast cells. J. Biol. Chem. 1989;264:19730–19739. [PubMed] [Google Scholar]
- NARENJKAR J., MARSH S.J., ASSEM E.S. The characterization and quantification of antigen-induced Ca2+ oscillations in a rat basophilic leukaemia cell line (RBL-2H3) Cell Calcium. 1999;26:261–269. doi: 10.1054/ceca.1999.0065. [DOI] [PubMed] [Google Scholar]
- NASH M.S., YOUNG K.W., JOHN CHALLISS R.A., NAHORSKI S.R. Intracellular signallingReceptor-specific messenger oscillations. Nature. 2001;413:381–382. doi: 10.1038/35096643. [DOI] [PubMed] [Google Scholar]
- OKA T., SATO K., HORI M., OZAKI H., KARAKI H. Xestospongin C, a novel blocker of IP3 receptor, attenuates the increase of cystolic calcium level and degranulation that is induced by antigen in RBL-2H3 mast cells. Br. J. Pharmacol. 2002;135:1959–1966. doi: 10.1038/sj.bjp.0704662. [DOI] [PMC free article] [PubMed] [Google Scholar]
- ORTEGA E., HAZAN B., ZOR U., PECHT I. Mast cell stimulation by monoclonal antibodies specific for the Fc epsilon receptor yields distinct responses of arachidonic acid and leukotriene C4 secretion. Eur. J. Immunol. 1989;19:2251–2256. doi: 10.1002/eji.1830191211. [DOI] [PubMed] [Google Scholar]
- PAREKH A.B., FLEIG A., PENNER R. The store-operated calcium current I(CRAC): nonlinear activation by InsP3 and dissociation from calcium release. Cell. 1997;89:973–980. doi: 10.1016/s0092-8674(00)80282-2. [DOI] [PubMed] [Google Scholar]
- PAREKH A.B., PENNER R. Store depletion and calcium influx. Physiol. Rev. 1997;77:901–930. doi: 10.1152/physrev.1997.77.4.901. [DOI] [PubMed] [Google Scholar]
- PATTERSON R.L., VAN ROSSUM D.B., GILL D.L. Store-operated Ca2+ entry: evidence for a secretion-like coupling model. Cell. 1999;98:487–499. doi: 10.1016/s0092-8674(00)81977-7. [DOI] [PubMed] [Google Scholar]
- PUTNEY J.W., Jr A model for receptor-regulated calcium entry. Cell Calcium. 1986;7:1–12. doi: 10.1016/0143-4160(86)90026-6. [DOI] [PubMed] [Google Scholar]
- PUTNEY J.W., Jr Capacitative calcium entry revisited. Cell Calcium. 1990;11:611–624. doi: 10.1016/0143-4160(90)90016-n. [DOI] [PubMed] [Google Scholar]
- PUTNEY J.W., Jr, BIRD G.S. The signal for capacitative calcium entry. Cell. 1993;75:199–201. doi: 10.1016/0092-8674(93)80061-i. [DOI] [PubMed] [Google Scholar]
- REISCHL I.G., COWARD W.R., CHURCH M.K. Molecular consequences of human mast cell activation following immunoglobulin E-high-affinity immunoglobulin E receptor (IgE- FcepsilonRI) interaction. Biochem. Pharmacol. 1999;58:1841–1850. doi: 10.1016/s0006-2952(99)00226-9. [DOI] [PubMed] [Google Scholar]
- RIBEIRO C.M., REECE J., PUTNEY J.W., Jr Role of the cytoskeleton in calcium signaling in NIH 3T3 cells. An intact cytoskeleton is required for agonist-induced [Ca2+]i signalling, but not for capacitative calcium entry. J. Biol. Chem. 1997;272:26555–26561. doi: 10.1074/jbc.272.42.26555. [DOI] [PubMed] [Google Scholar]
- ROSADO J.A., JENNER S., SAGE S.O. A role for the actin cytoskeleton in the initiation and maintenance of store-mediated calcium entry in human platelets. Evidence for conformational coupling. J. Biol. Chem. 2000;275:7527–7533. doi: 10.1074/jbc.275.11.7527. [DOI] [PubMed] [Google Scholar]
- SAITO S., KARAKI H. A family of novel actin-inhibiting marine toxins. Clin. Exp. Pharmacol. Physiol. 1996;23:743–746. doi: 10.1111/j.1440-1681.1996.tb01770.x. [DOI] [PubMed] [Google Scholar]
- SAITO S., WATABE S., OZAKI H., FUSETANI N., KARAKI H. Mycalolide B, a novel actin depolymerizing agent. J. Biol. Chem. 1994;269:29710–29714. [PubMed] [Google Scholar]
- SEDOVA M., KLISHIN A., HUSER J., BLATTER L.A. Capacitative Ca2+ entry is graded with degree of intracellular Ca2+ store depletion in bovine vascular endothelial cells. J. Physiol. 2000;523:549–559. doi: 10.1111/j.1469-7793.2000.t01-3-00549.x. [DOI] [PMC free article] [PubMed] [Google Scholar]
- SEEBECK J., KRUSE M.L., SCHMIDT-CHOUDHURY A., SCHMIDTMAYER J., SCHMIDT W.E. Pituitary adenylate cyclase activating polypeptide induces multiple signaling pathways in rat peritoneal mast cells. Eur. J. Pharmacol. 1998;352:343–350. doi: 10.1016/s0014-2999(98)00372-0. [DOI] [PubMed] [Google Scholar]
- SULLIVAN R., PRICE L.S., KOFFER A. Rho controls cortical F-actin disassembly in addition to, but independently of, secretion in mast cells. J. Biol. Chem. 1999;274:38140–38146. doi: 10.1074/jbc.274.53.38140. [DOI] [PubMed] [Google Scholar]
- TAKEMURA H., PUTNEY J.W., Jr Capacitative calcium entry in parotid acinar cells. Biochem. J. 1989;258:409–412. doi: 10.1042/bj2580409. [DOI] [PMC free article] [PubMed] [Google Scholar]
- TASAKA K. Molecular mechanism of histamine release: the role of intermediate filaments and membrane skeletons. J. Physiol. Pharmacol. 1994;45:479–492. [PubMed] [Google Scholar]
- TAYLOR C.W., THORN P. Calcium signalling: IP3 rises again…and again. Curr. Biol. 2001;11:R352–R355. doi: 10.1016/s0960-9822(01)00192-0. [DOI] [PubMed] [Google Scholar]
- ZWEIFACH A., LEWIS R.S. Calcium-dependent potentiation of store-operated calcium channels in T lymphocytes. J. Gen. Physiol. 1996;107:597–610. doi: 10.1085/jgp.107.5.597. [DOI] [PMC free article] [PubMed] [Google Scholar]