

Abstract
Pharmacological studies of α7 nicotinic acetylcholine receptors are confounded by the fact that rapid desensitization to high agonist concentration causes α7 peak responses to occur well in advance of complete solution exchange. For this reason, peak currents are an invalid measure of response to applied agonist concentrations. We show that results comparable to those that have been corrected for instantaneous concentration are obtained if net charge is used as the measure of receptor response.
Dose response curves obtained with these methods indicate that α7 receptors are approximately 10 fold more sensitive to agonist than previously reported. The agonists, ACh, choline, cytisine, GTS-21, 4OH-GTS-21 and 4-MeO-CA have the same rank order potency for both human and rat receptors: 4-MeO-CA > 4OH-GTS-21 > GTS-21 > cytisine > ACh > choline. However, differences in efficacy exist between rat and human receptors. GTS-21 is more efficacious for rat than human α7 receptors and cytisine more efficacious for human than rat α7 receptors.
Choline is the least potent agonist for both human and rat α7, with a potency approximately 10 fold lower than that of ACh. While the EC50 for the activation of α7 receptors by choline (400–500 μM) is outside the normal physiological range (10–100 μM), choline can nonetheless produce detectable levels of channel activation in the physiological concentration range. Since these concentrations are relatively non-desensitizing, the contribution of choline-activated α7 receptor current may play a significant role in the regulation of calcium homeostasis in α7-expressing neurons.
Keywords: Nicotinic acetylcholine receptor, alpha7, Xenopus oocyte, desensitization, GTS-21, choline, dose-response, kinetics
Introduction
Neuronal nicotinic acetylcholine receptors of the α7 subtype have been proposed to represent a therapeutic target for treating a number of CNS disorders, including schizophrenia and Alzheimer's disease (Lindstrom, 1997). This has led to the drive for creating selective agonists for this potentially important receptor. However, α7-type nAChRs possess a unique form of concentration-dependent rapid desensitization, which creates a special challenge for the pharmacological characterization of these receptors (Papke & Thinschmidt, 1998).
A conventional analysis of agonist efficacy and potency relies on determining the relationship between agonist concentration and some measure of functional response, typically the peak of an evoked current in a voltage-clamp experiment. Many such analyses have been published utilizing the Xenopus oocyte expression system. The most important underlying assumption of such a concentration-response analysis is that the response which is measured correctly corresponds to the activation produced by the concentration of the drug which was applied. We have previously shown that this most basic assumption is invalid in typical studies of α7-type nAChR (Papke et al., 1998). When a high concentration of agonist is applied to an oocyte that is expressing α7 receptors, the response is rapid and very brief. Through a careful study of solution exchange and response kinetics, we determined that the response to the application of a high concentration of agonist is, in fact, so rapid that the peak response occurs well before the solution exchange is complete and that the response is so brief that the current may be nearly returned to baseline by the time the drug concentration in the chamber is maximal. Through the calculation of instantaneous concentration (i.e. extrapolating the fractional solution exchange at the moment that the peak responses occurred), we determined that during a steep concentration ramp the receptors were optimally activated in a narrow band of concentration. Once concentration increased outside of that optimal range for activation, channels were more likely to close than open, accounting for the rapid desensitization. By delivering progressively steeper concentration ramps (that is, by applying higher and higher agonist concentration to the chamber), the band of optimal concentration reached the cell sooner and was tighter (in a temporal sense). This had the effect of producing larger peak responses without the actual activation of more receptors, simply through the better synchronization of roughly equivalent populations of receptors (Papke & Thinschmidt, 1998). The stimulation of brief transient responses during a steep ramp in agonist concentration is not unique to α7 receptors expressed in Xenopus oocytes, but is also seen in α7 responses of acutely dissociated neurons under conditions when the speed of the concentration ramp is 1000 fold more steep than in oocyte experiments, arguing that this rapid desensitization is an agonist concentration-dependent property that is intrinsic to the native receptor (Papke et al., 2000a).
Essentially all published reports of α7 receptor pharmacology, including work done in our lab (Meyer et al., 1998b), make the false association between peak currents as a measure of response and the applied agonist concentration. This false assumption yields concentration-response functions that typically underestimate the effective concentrations by an order of magnitude. Thus α7 receptors have regularly been described as low affinity receptors (Seguela et al., 1993). It is true that α7 receptors do not adopt a high affinity desensitized conformation common to beta subunit-containing nAChR, so they are not detected in nicotine binding experiments. However, when concentration-response functions are corrected for the effects of rapid desensitization, we determine that the EC50 of ACh (acetylcholine) for α7 receptors is roughly equivalent to that of the putative high-affinity receptors. This is an important observation since it resolves the paradox that the concentrations of α7 agonists which were most effective in certain in vitro assays were also much lower than the previous estimates of EC50 values based on measurements of peak responses.
In this paper we revisit the basic issue of agonist potency for the activation of α7 nAChR. Our previously published method for concentration correction is a difficult method to use, since it requires careful calibrations of solution delivery and flow dynamics, as well as precise control of drug delivery and flow rates. In this study we demonstrate that the relatively simple measurement of net charge accumulation over the entire duration of a drug delivery produces results that are essentially equivalent to those generated by more complicated concentration-correction methods. Net charge represents the time integration of all the channel activation that occurs in response to a drug application. Similar methods have been applied to the analysis of the α7-mediated responses of cultured hippocampal neurons and acutely dissociated hypothalamic neurons (Mike et al., 2000; Papke et al., 2000a). Through the use of net charge analysis we see that the principal effect of applying high concentrations of agonist to a population of α7 receptors is to increase the synchronization of channel activation, not the total amount of channel activation. That is, channels appear to open most readily when the concentration is in a certain range. Applications of high concentration of agonist produce a steep concentration gradient, which in turn allows larger peak currents to be observed. When lower concentrations are applied the range of optimal concentration becomes temporally broader. We note that with the application of high agonist concentration, the moment of synchronized activation (i.e. the peak current) occurs well in advance of the time when the full concentration of the drug is present in the chamber.
The drugs used in these experiments include the therapeutically relevant α7-selective partial agonist GTS-21 ([3-(2,4-dimethoxybenzylidene)-anabaseine]) and its active metabolite 4OH-GTS-21 ([3-(4-hydroxy-2-methoxybenzylidene)-anabaseine]) (Meyer et al., 1998a). We confirm that these drugs discriminate between the rat and human α7 receptor subtypes. We also include a characterization of cytisine and an anabaseine derivative, 4MeO-CA ([3-(4-methoxycinnamilidene)-anabaseine]), which has previously only been studied with rat α7 receptors (Meyer et al., 1998b).
Methods
Preparation of RNA
The rat α7 clone was obtained from Dr Jim Boulter (UCLA) and the human α7 clone was provided by Dr Jon Lindstrom (University of Pennsylvania). After linearization and purification of cloned cDNAs, RNA transcripts were prepared in vitro using the appropriate mMessage mMachine kit from Ambion Inc. (Austin, TX, U.S.A.).
Expression in Xenopus oocytes
Mature (>9 cm) female Xenopus laevis African toads (Nasco, Ft. Atkinson, WI, U.S.A.) were used as a source of oocytes. Prior to surgery, frogs were anaesthetized by placing the animal in a 1.5 g l−1 solution of MS222 (3-aminobenzoic acid ethyl ester) for 30 min. Oocytes were removed from an incision made in the abdomen.
In order to remove the follicular cell layer, harvested oocytes were treated with 1.25 mg ml−1 collagenase from Worthington Biochemical Corporation (Freehold, NJ, U.S.A.) for 2 h at room temperature in calcium-free Barth's solution (mM: NaCl 88, HEPES pH 7.6 10, MgSO4 0.33, gentamicin sulphate 0.1 mg ml−1). Subsequently, stage 5 oocytes were isolated and injected with 50 nl (5–20 ng) each of the appropriate subunit cRNAs. Recordings were made 5 to 15 days after injection.
Chemicals
4MeO-CA was provided by Dr John Zoltewicz (University of Florida, U.S.A.). GTS-21 and 4OH-GTS-21 were provided by Taiho Pharmaceuticals (Tokyo, Japan). All other chemicals for electrophysiology were obtained from Sigma Chemical Co. (St. Louis, MO, U.S.A.). Fresh acetylcholine stock solutions were made daily in Ringer's solution and diluted.
Electrophysiology
Oocyte recordings were made with a Warner Instruments (Hamden, CT, U.S.A.) OC-725C oocyte amplifier interfaced to either a Macintosh or Gateway personal computer. Data were acquired using Labview software (National Instruments) or pClamp8 (Axon Instruments). Sampling rates were between 10 and 20 Hz and the data were filtered at 6 Hz. Oocytes were placed in a Warner RC-8 recording chamber with a total volume of about 0.6 ml and perfused at room temperature with frog Ringer's solution (mM: NaCl 115, KCl 2.5, HEPES pH 7.3 10, CaCl2 1.8) containing 1 μM atropine to inhibit potential muscarinic responses. A Mariotte flask filled with Ringer's solution was used to maintain a constant hydrostatic pressure for drug deliveries and washes. Drugs were diluted in perfusion solution and loaded into a 2 ml loop at the terminus of the perfusion line. A bypass of the drug-loading loop allowed bath solution to flow continuously while the drug loop was loaded, and then drug application was synchronized with data acquisition by using a two-way electronic valve. The rate of bath solution exchange and all drug applications was 6 ml min−1. Current electrodes were filled with a solution containing (mM:) CsCl 250, CsF 250, EGTA 100 and had resistances of 0.5–2 MΩ. Voltage electrodes were filled with 3 M KCl and had resistances of 1–3 MΩ.
The solution exchange profile shown in Figure 1 was generated by averaging 12 open tip voltage measurements of junction potential when 2 ml of 115 mM CsCl was introduced into the recording chamber using the drug loop. A small baseline correction was made to compensate for the drift in the offset potential cause by contamination of the electrode solution with CsCl.
Figure 1.
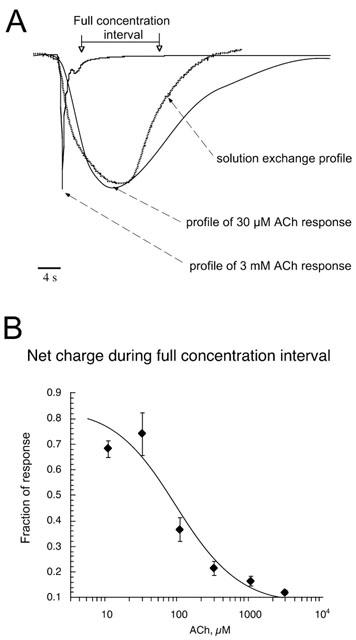
Comparison between the kinetics of responses and solution flow. (A) This figure illustrates the kinetic features of a rat α7 receptor response to a relatively low agonist concentration (30 μM ACh) and a high agonist concentration (3 mM ACh). For the sake of comparison, the responses have been scaled to the same maximum amplitude and are shown along with an open tip recording that provides a measurement of solution exchange in the recording chamber (see Methods). Note that while the response to 30 μM ACh was parallel to the profile of solution exchange in the chamber, the peak response to the application of 3 mM ACh occurred well before the maximal concentration of 3 mM could possibly have been achieved. The data traces are the same as those in Figure 2A. The 30 μM response has been vertically scaled up approximately 16 fold. While the unscaled responses differed 16 fold in peak amplitude, they differed no more than 2 fold in area under the curve (net charge). The period of time when agonist concentration was close to maximal (see Methods) is indicated by the arrows. (B) The relative fraction of net charge accumulated during the period of maximal agonist concentration decreases as the applied concentration of ACh increases (see Methods).
Experimental protocols and data analysis
Current responses to drug applications were studied under two-electrode voltage clamp at a holding potential of −50 mV. Holding currents immediately prior to agonist application were subtracted from measurements of the peak response to agonist. All drug applications were separated by wash periods of 5 min. Each oocyte received two initial control applications of 300 μM ACh, then an experimental drug application, and then a follow-up control application of 300 μM ACh.
Responses to experimental drug applications were calculated relative to the preceding ACh control responses in order to normalize the data, compensating for the varying levels of channel expression among the oocytes. Means and standard errors (s.e.m.) were calculated from the normalized responses of at least four oocytes for each experimental concentration. The application of some experimental drugs caused the subsequent ACh control responses to be reduced, suggesting some form of residual inhibition (or prolonged desensitization). In order to measure the residual inhibitory effects, this subsequent control response was compared to the pre-application control ACh response.
For concentration-response relations, data derived from net charge analyses were plotted using Kaleidagraph 3.0.2 (Abelbeck Software; Reading, PA, U.S.A.), and curves were generated from the Hill equation
 |
where Imax denotes the maximal response for a particular agonist/subunit combination, and n represents the Hill coefficient. Imax, n, and the EC50 were all unconstrained for the fitting procedures. Negative Hill slopes were applied for the calculation of IC50 values.
Net charge analysis
Drug delivery was controlled by electronic valves that were synchronized to the data acquisition. Drug delivery to the chamber began approximately 6 s after valve activation. For net charge measurement, a 90-s segment of data beginning 2 s after valve activation was selected from each response. A time interval of 90 s was chosen for current integration since this is approximately twice the duration of the agonist pulse as measured with open-tip recording (Figure 1). A duration significantly longer than the open-tip pulse duration was chosen since we have previously shown that diffusion to the back side of the oocyte is relatively slow but essentially complete after two pulse durations (Papke & Thinschmidt, 1998). Data collected using Labview were analysed for net charge using a worksheet template in Microsoft Excel 98. Data were first adjusted to account for any baseline offset by subtracting the value of the first data point in a set from all succeeding data points. Baseline reference was also corrected for possible drift. Raw net charge was calculated by taking the sum of all the baseline-adjusted points. The normalized net charge values were calculated by dividing the net charge value of the experimental response by the net charge value calculated for the preceding 300 μM ACh control response. For data obtained with pClamp, Clampfit 8.0 (Axon Instruments, Union City, CA, U.S.A.) was used for manual baseline adjustment and the calculation of net charge over 90 s intervals.
Determination of full concentration intervals
We have previously characterized solution exchange in our experimental chambers based on junction-potential measurements (Papke & Thinschmidt, 1998). As shown in Figure 1, the time course of solution exchange, as measured by open-tip recording of junction-potential changes in the bath, is reasonably well-synchronized with the profile of an α7 response to 30 μM ACh. Therefore, we used data obtained in response to the application of 30 μM ACh to cells expressing rat α7 nAChR to define that interval of time when the response corresponded to maximal agonist concentration. Specifically, the responses of 4 cells to the application of 30 μM ACh were averaged and used to generate a normalized average net charge response to 30 μM ACh. We determined the range of that response which included the median±one standard deviation in order to define a time period of maximal concentration, that is, when the concentration in the bath was closest to the actual concentration applied. By definition, 68% of the net charge in the averaged response to the application of 30 μM ACh accumulated during this interval. This interval, which is marked in Figure 1A, encompasses a range around the time of the peak solution exchange predicted by open-tip junction-potential measurements.
Results
Figure 1 shows the rate at which experimental solutions flow into our Warner recording chambers (solution-exchange profile, based on junction-potential measurements, see methods) compared to the kinetics of α7-mediated responses. Responses to 30 μM ACh and 3 mM ACh have been scaled to the same amplitude for comparison to the CsCl open-tip recording, which was made in the same chamber. Responses of α7 receptors to the application of agonist at high concentrations were much faster than the kinetics of solution exchange. While the peak of the 30 μM ACh response was well-coordinated with the solution-exchange profile, the 3 mM response returned to baseline by the time that the concentration of ACh in the chamber reached 3 mM.
Typically, whole-cell responses of ligand-gated ion channels are characterized by their peak amplitudes. An alternative measure of response is net charge (area under the curve), which is an integration of current over time and thus reflects the total amount of channel activation in response to a drug application. Measurements of net charge are unaffected by the amount of synchronization of channel opening that occurs with rapid change in agonist concentration. The channel openings stimulated by the application of 30 μM ACh occurred over the entire duration of the agonist application, so that the majority of the net charge accumulated during the time agonist concentration was near maximal (see Methods). However, when 3 mM ACh was applied, nearly all of the current flowed during the leading edge of the solution exchange, when the concentration in the chamber was much lower than the applied concentration.
The fact that during the application of high concentration of agonist charge accumulated before the full concentration of agonist was delivered to the bath suggested that at the full high concentration, agonist preferentially inhibited or desensitized the receptors. In order to quantify how high concentrations of ACh promote channel inactivation or desensitization, we measured the percentage of the total net charge which accumulated during the time when concentration was near maximal. As shown in Figure 1B, the fraction of the net charge which accumulated during the interval of full concentration decreased as a function of the agonist concentration applied. A curve fit of the data in Figure 1B suggested that high concentrations of ACh selectively promoted deactivation or desensitization, with an IC50 value of approximately 68 μM and a Hill slope of −1. For the comparison of relative amplitude and areas, Figure 2A shows the responses of a Xenopus oocyte expressing rat α7 receptors to ACh applied at varying concentrations. The amplitude of the peak response to 3 mM ACh was 16 fold larger than the peak response to 30 μM. However, the amount of total activation produced by the application of 3 mM ACh to the bath, calculated by the measurement of net charge, was no more than 2 fold larger than that produced by the application of 30 μM ACh. This relation is evident by visual inspection of the areas under the respective traces.
Figure 2.
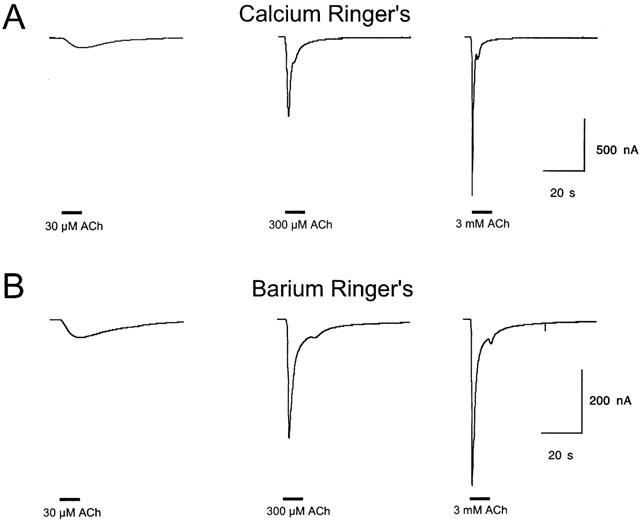
Responses of Rat α7 receptors to varying concentrations of ACh in both calcium-containing and calcium-free barium-substituted Ringer's solution. (a) Raw data obtained in normal calcium-containing Ringer's solution. Representative traces of rat α7 ACh receptor activation by varying concentrations of ACh. Receptors were expressed in Xenopus oocytes and responses were recorded using conventional two-electrode voltage-clamp. Responses to 300 μM ACh were used as internal controls in all cells for purposes of normalization. All evoked responses were separated by 5 min wash periods (not shown). The traces shown in panel A were obtained in the presence of normal Ringer's solution which contained 1.8 mM calcium. (B) Representative traces of rat α7 ACh receptor activation by varying concentrations of ACh in the presence of Ringer's solution in which 1.8 mM barium was substituted for calcium. For purposes of normalization, responses to 300 μM ACh (also in barium-substituted Ringer's) were used as internal controls. Between evoked responses, cells were given 5 min wash periods in barium-substituted Ringer's.
A comparison of the apparent concentration-response relationships for ACh activation of peak currents and net charge through rat α7 receptors is shown in Figure 3 (see Table 1 for curve fit values). The plot of net charge shows that maximal channel activation was achieved with the application of 300 μM ACh and that the application of concentrations greater than 300 μM produced no larger response. However, by producing channel activation in a progressively more synchronous manner, the application of ACh at concentrations greater that 300 μM led to larger peak currents. As shown in Figure 1, these peak currents occurred when agonist concentration in the chamber was still relatively low, producing an erroneous representation in the concentration-response relationship for peak currents. This misrepresentation results in a very high value being fit for the EC50 in such plots (>500 μM, Table 1). This error is not present in the net charge analysis.
Figure 3.
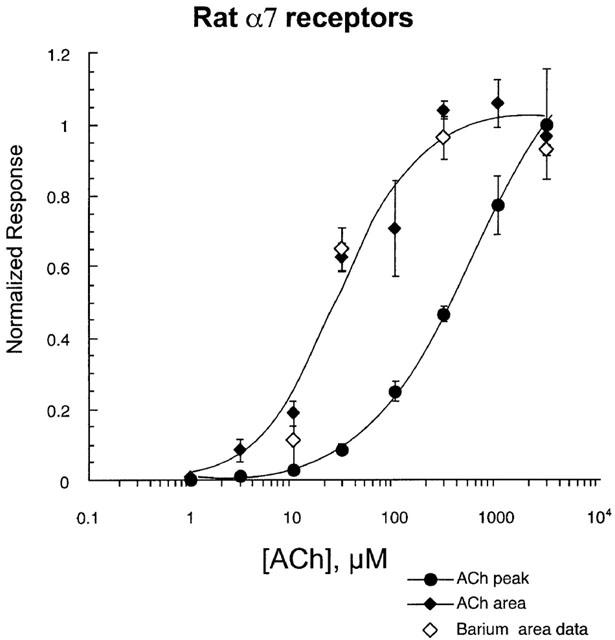
Comparison of concentration-response studies based on measurements of peak current amplitudes and net charge accumulation. Responses to varying concentrations of applied ACh were measured as peak currents and net charge. Oocytes expressing rat α7 receptors were tested for their responses to ACh. Both peak currents and net charge were measured (see Methods). Data from each response were normalized to the corresponding values for the control 300 μM ACh responses obtained before the preceding 5 min wash. Peak responses were initially measured relative to the 300 μM peak current and the values were subsequently scaled to the value for the maximum peak currents evoked by 3 mM ACh. Since the 300 μM control responses corresponded to the maximal net charge, net charge data are simply expressed relative to the 300 μM ACh responses. The filled diamonds represent net charge analysis conducted on cells recorded in normal calcium-containing Ringer's. The open diamonds represent data obtained in Ringer's solution which had 1.8 mM barium substituted for calcium.
Table 1.
Curve fits for Hill equations

Normal Ringer's solution contains 1.8 mM calcium, and it is known that calcium entry through α7 receptors can have the effect of activating calcium-dependent chloride channels. Calcium is also important for the normal functioning of nAChR (Adams & Nutter, 1992; Amador & Dani, 1995; Bonfante-Cabarcas et al., 1996; Vernino et al., 1992). Since it was important to maintain the presence of this physiologically important ion, we determined whether the presence of calcium-dependent chloride currents would compromise our net charge analysis of α7 pharmacology. The substitution of barium for calcium is effective at reducing the chloride component of the α7 activation-associated responses. We have previously reported that although recording α7-mediated responses in barium-substituted Ringer's greatly reduced the absolute magnitude of the responses, it did not alter the effect of concentration on the relative amplitude of peak responses (Papke et al., 1997). In order to validate net charge analysis under the physiologically relevant condition of 1.8 mM calcium, we compared net charge calculations made in normal Ringer's and in barium-substituted Ringer's. Representative responses of cells expressing rat α7 receptors to varying concentrations of ACh, and recorded in barium-substituted Ringer's, are shown in Figure 2B. Currents were smaller in the barium-substituted Ringer's, but the other essential concentration-dependent features of the responses were relatively unchanged. In normal Ringer's, a sample of twelve 300 μM ACh control responses had an average amplitude of 635±136 nA and net charge of 21±5 nCoulombs. In barium-substituted Ringer's, 300 μM ACh responses had an average amplitude of 224±24 nA and a net charge of 13±3 nCoulombs (n=4). Barium substitution therefore had a somewhat greater effect on peak amplitude (65% reduction) than net charge (40% reduction). However, although differing somewhat in wave form, because each group was normalized based on respective internal controls, the basic relationships between peak amplitudes and net charge as functions of agonist concentration applied were essentially unaffected by the barium substitution. As shown in Figure 3, normalized net charge values showed no difference between the calcium and barium groups over the entire range from 10 μM to 3 mM ACh.
Analysis of net charge was applied to two drugs we previously identified as α7-selective partial agonists, GTS-21 and 4OH-GTS-21. These drugs were evaluated on both human and rat α7 receptor clones expressed in Xenopus oocytes and compared to ACh responses. The results are shown in Figure 4. As illustrated by the raw data traces in Figure 4A, although these drugs differ from ACh in both potency and relative efficacy (compared to ACh), the α7 receptor-mediated responses to these drugs show concentration-dependent kinetic features which are similar to ACh-evoked responses. Therefore we applied the same method of net-charge analysis to the characterization of these drugs. Our results suggest that the EC50 values for these experimental drugs are roughly an order of magnitude lower than previously estimated (Table 1, compare with Table 3). Our results confirm that GTS-21 has a lower efficacy for human receptors than for rat α7 receptors, though perhaps not as low as previously estimated by measurements of peak currents (Briggs et al., 1997; Meyer et al., 1998a). The 4-hydroxy metabolite of GTS-21 has a greater efficacy and potency than the parent compound for both the human and the rat receptors.
Figure 4.
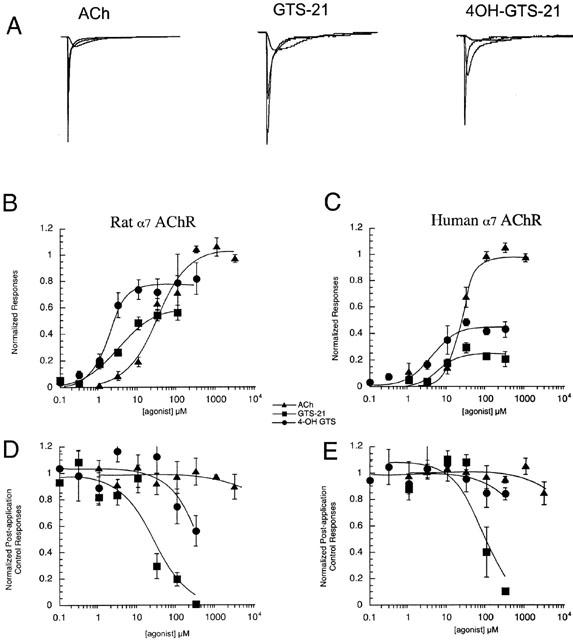
Rat and human α7 AChR responses to ACh, GTS-21, and 4OH-GTS-21. (A) The left-most set of raw data traces are representative responses of human α7 receptors to the application of 30 μM, 300 μM, and 3 mM ACh. The middle set are representative responses of rat α7 receptors to the application of 10, 30, and 100 μM GTS-21. The right-most set are representative responses of human α7 receptors to the application of 3, 10, and 100 μM 4OH-GTS-21. The raw data traces were scaled relative to the internal ACh controls in each oocyte. Additionally, since the agonists varied in efficacy, the GTS-21 and 4OH-GTS-21 data were given a further vertical scaling of 400% relative to the ACh control data. Each trace represents 90 s of recording. (B) The concentration-response relationships for net charge in the responses of oocytes expressing rat α7 AChR to ACh, GTS-21, and 4OH-GTS-21. All responses were normalized to net charge of the individual oocyte's response to 300 μM ACh applied 5 min before the experimental application. (C) The concentration-response relationships for net charge in the responses of oocytes expressing human α7 AChR to ACh, GTS-21, and 4OH-GTS-21. All responses were normalized to net charge of the individual oocyte's response to 300 μM ACh applied 5 min before the experimental application. (D) The residual inhibition of control (300 μM) ACh responses of rat α7-injected oocytes after the application of ACh, GTS-21, or 4OH-GTS-21 at the indicated concentrations. All responses were normalized to the individual oocyte's response to 300 μM ACh applied 5 min before the application of the experimental agonist. (E) The residual inhibition of control (300 μM) ACh responses of human α7-injected oocytes after the application of ACh, GTS-21 or 4OH-GTS-21 at the indicated concentrations. All responses were normalized to the individual oocyte's response to 300 μM ACh applied 5 min before the application of the experimental agonist. Note that for panels C and D, the data are based on the peak currents of the control responses since inhibition of ACh controls was reflected equally as decreases in peak and in area (not shown).
Table 3.
Previously published Imax and EC50 values for α7 receptors

Subsequent to activation by GTS-21, α7 receptors exhibited residual inhibitory desensitizing effects that caused there to be a decrease in subsequent ACh control responses (regardless of whether measured by peak or area). Inhibitory activity was much less with 4OH-GTS-21 and largely absent with ACh (Figure 4C,D, Table 2). These observations have been previously reported (Meyer et al., 1998a). However, based on the previous estimate of EC50, this inhibitory activity would have been expected in the same concentration range as maximal activation. The present analysis indicates that higher concentrations of GTS-21 are required to produce residual inhibition than are required to activate the receptors optimally. The ratio of IC50 to EC50 is approximately nine for rat α7 receptors and 14 for human α7 receptors. Previous estimates of these ratios were 0.3 and 0.7, respectively.
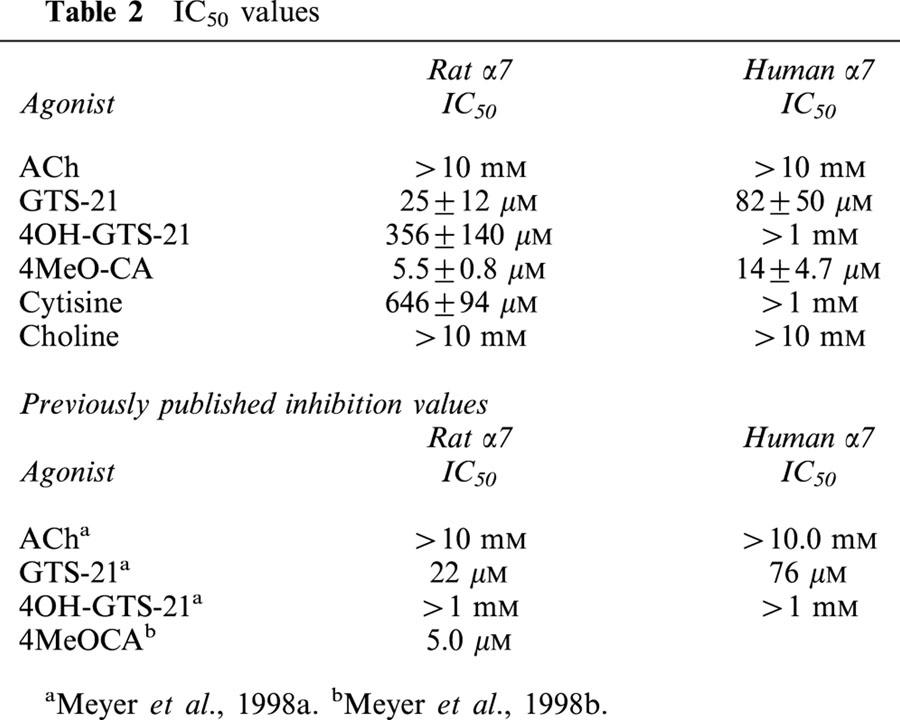
Table 2.
IC50 values
As shown in Figure 5A, the responses of α7 receptors to choline, cytisine, and the cinnamylidene-anabaseine compound 4MeO-CA have the same concentration-dependent kinetic features as the responses to ACh and the GTS-21 compounds (Figure 4). Choline has been identified as an α7-selective agonist but has not previously been thoroughly characterized on both human and rat α7 receptors. Net charge analysis (Figure 5B-E) indicates that choline is fully efficacious with both human and rat receptors (compared to ACh controls, Table 1). Although EC50 values estimated for choline were relatively high, about 10 fold higher than for ACh, it is interesting to note that choline produced clearly detectable responses at concentrations of 30 μM or less. Responses to 30 μM choline were 6±2% and 12±6% of the maximal net charge responses for rat and human α7 receptors, respectively. Additionally, choline produced essentially no residual inhibition of subsequent ACh responses over the entire concentration range tested.
Figure 5.

Rat and human α7 AChR responses to 4-MeO-CA, cytisine and choline. (A) The left-most set of raw data traces are representative responses of human α7 receptors to the application of 100 μM, 1 mM, and 10 mM choline. The middle set are representative responses of human α7 receptors to the application of 1, 3, and 30 μM 4-MeO-CA. The right-most set are representative responses of human α7 receptors to the application of 3, 30, and 300 μM cytisine. The raw data traces were scaled relative to the internal ACh controls in each oocyte. Additionally, since the agonists varied in efficacy, the 4MeO-CA and cytisine data were given a further vertical scaling relative to the ACh control data of 500 and 200% respectively. Each trace represents 90 s of recording. (A) The concentration-response relationships for net charge in the responses of oocytes injected with RNA coding for the rat α7 subunit to 4-MeO-CA, cytisine and choline. All responses were normalized to net charge in the individual oocyte's response to 300 μM ACh applied 5 min before the experimental application. (B) The concentration-response relationships for net charge in the responses of oocytes injected with RNA coding for the human α7 subunit to 4-MeO-CA, cytisine, and choline. All responses were normalized to net charge in the individual oocyte's response to 300 μM ACh applied 5 min before the experimental application. (C) The residual inhibition of control (300 μM) ACh responses of rat α7-injected oocytes after the application of 4-MeO-CA, cytisine, and choline at the indicated concentrations. All responses were normalized to the individual oocyte's response to 300 μM ACh applied 5 min before the application of the experimental agonist. (D) The residual inhibition of control (300 μM) ACh responses of human α7 injected oocytes after the application of 4-MeO-CA, cytisine, and choline at the indicated concentrations. All responses were normalized to the individual oocyte's response to 300 μM ACh applied 5 min before the application of the experimental agonist. Note that for panels C and D, the data are based on the peak currents of the control responses since inhibition of ACh controls was reflected equally as decreases in peak and in area (not shown).
Cytisine has been reported to be an effective agonist on chicken (Bertrand et al., 1992) and human α7 receptors (Chavez-Noriega et al., 1997; Houlihan et al., 2001), however, data regarding its effects on rat α7 receptors are limited (Seguela et al., 1993). A net charge analysis of cytisine's effects on both human and rat α7 receptors indicates that this agonist has similar potency for both of these receptors but lower efficacy for rat than human α7 (Figure 5B–E).
Cinnamylidene anabaseines have been identified which appear to be selective full agonists of α7 receptors (de fiebre et al., 1995; Meyer et al., 1998b). We conducted net charge analysis of the cinnamylidene compound 4MeO-CA, which was previously characterized only with rat α7 receptors (Meyer et al., 1998b). This compound was somewhat more efficacious with rat α7 receptors compared to human, with potency not significantly different between the two. In regard to residual inhibition of subsequent ACh control responses, this compound was even more potent than GTS-21. However, as with GTS-21, the inhibitory activity was most pronounced in a concentration range higher than that which optimally activated the receptors. Specifically, the ratio of IC50 to EC50 is approximately 11 for rat α7 receptors and 15 for human α7 receptors (Figure 5B–E).
Discussion
Conventional concentration-response analysis assumes that a known concentration is simultaneously achieved at all of the ion channels by the drug application system. It is clear that this assumption is not valid for α7 nAChR responses to the application of high concentrations of agonist. We previously proposed that α7 concentration-response functions could be corrected by extrapolating estimates of instantaneous concentration at the time of the peak responses from a careful study of solution exchange dynamics (Papke & Thinschmidt, 1998). Although that method undoubtedly provided improved estimates of agonist potency, it was difficult to calculate the correction factor.
Demonstrably, the application of a concentration ramp has the effect of synchronizing channel opening without increasing the number of channel openings. Therefore we used time integration to provide estimates of net channel activation. We have previously used net charge analysis to show that EC50s and efficacy may be underestimated for agents which are mixed agonist-antagonists (de fiebre et al., 1995; Papke et al., 1997; 2000b). In the present study we show that when net charge analysis is used to study the pharmacology of α7 nAChR, results are comparable to those obtained with concentration-correction methods (compare values in Table 1). We show that results obtained with net charge analysis are relatively unaffected by the details of the recording methods and thus this method may be easily used by other groups studying this receptor.
In a sense, the use of net charge as a measure of response is more like a study of dose-response than concentration-response, since it accepts the effects of pharmacokinetics, measuring response during the change in drug concentration, not just under the conditions of maximum concentration. Analyses of α7 responses based on peak currents frequently show response curves that fail to reach a well defined maximum (see Figure 3). Our net charge data show that there is a true plateau in the dose-response function of α7 receptors, and that maximum total amount of channel opening is obtained with relatively low agonist concentrations. This is consistent with the hypothesis that increases in peak amplitude represent synchronization, not increases in activation. When a bolus of drug is applied to the chamber, it is the nature of the α7 receptor to respond within a narrow range of concentration. If the concentration ramp is steep, then the maximal activation is synchronized within that narrow range of concentration on the rising edge of the drug application.
Previous studies of α7 receptor pharmacology from our own laboratory and many others have been based on the same false association between peak response and applied concentration. Published estimates for the ACh EC50 of α7 receptors (Table 3) average about 200 μM and range from 107–334 μM. Most of these estimates were obtained from experiments on Xenopus oocytes, but even the values based on the responses of cultured neurons and transfected HEK cells have estimated the ACh EC50 to be greater than 100 μM. Analysis of net charge lowers the estimate for the ACh EC50 by at least a factor of five, belying the concept that α7 is a receptor subtype with low affinity for activation.
Just as the erroneous association between peak response and applied concentration equally impacts estimates based on slow oocyte responses and rapid neuronal responses, net charge analysis can be applied equally well across such diverse time scales. In the present study, which involved a calculation of net charge over a 90 s period, with a time constant for drug application of approximately 6 s, we estimated the EC50 of 4OH-GTS-21 to be 1.6±0.2 μM with a Hill coefficient n=2.1±0.4. In experiments with acutely dissociated hypothalamic neurons, under conditions when the solution exchange was estimated to have a time constant of 5.6 ms, a fit of the net charge response function for a time interval of 500 ms gave an estimated EC50 of 1.6±0.6 μM for 4OH-GTS-21 with a Hill slope n=2.6±0.2 (Uteshev et al., 2002). Nonetheless, important differences were observed between the net charge analysis of oocyte responses and the responses of acutely dissociated neurons. Specifically, in the measurements of neuronal currents made on this rapid time scale, peak current amplitude increased monotonically and reached a plateau, while the curve for net charge was bell-shaped, such that the application of higher agonist concentrations produced smaller net-charge responses. This is in contrast to the oocyte responses, where we see the net measurement reach a plateau, while peak current amplitudes seemingly can always be increased by applying steeper concentration ramps (Figure 3). The fact that net charge measurements from the acutely dissociated neurons decrease with high agonist concentration applications is consistent with the idea that high levels of agonist occupancy are intrinsically inhibitory. We hypothesize that during the slow agonist applications to oocytes, the receptors can be in a range of optimal occupancy long enough to produce a maximal net charge response (limited by slow desensitization), while the time spent at the optimal level of agonist occupancy during the 5–10 ms concentration ramp applied to the neuronal receptors is too brief for the cells to open as much as when a lower agonist concentration is applied for a longer period of time.
The fact that some essential features of the α7 response can be replicated on vastly different time scales supports the hypothesis that agonist concentration itself, and consequently fractional occupancy of multiple agonist binding sites, is what drives both activation and fast desensitization of α7 receptors. As homomeric pentamers, α7 receptors have as many as five potential agonist binding sites. We have proposed that channel opening is most likely to occur when some, but not all, of these sites are bound by agonist (Papke et al., 2000a). At saturating levels of agonist occupancy, the channels appear to close or preferentially desensitize. A similar model has been proposed for related homo-pentameric 5-HT3a receptors (Mott et al., 2001). The 5-HT3a receptors show their most rapid desensitization when all agonist binding sites are bound by agonist, although for 5HT3a receptors both activation and desensitization are much slower than for α7 nAChR.
Detailed modeling of the concentration dependence of α7 receptor activation and inactivation/desensitization will require macroscopic current and single channel recording with extremely high temporal resolution and precise knowledge of solution exchange kinetics. Nonetheless, the oocyte data indicate that the macroscopic responses are shaped by at least two concentration-dependent processes, one for channel activation and the other for desensitization (or other forms of inactivation). Net charge analysis of rat α7 activation by ACh has an EC50 of 30 μM (Figure 3). As shown in Figure 1, charge is accumulated throughout the application of 30 μM ACh, but with the application of higher ACh concentrations, the flow of charge is reduced once the full agonist concentration is achieved in the chamber (IC50=68 μM). In the case of these oocyte experiments, since the response kinetics of the α7 receptors are so rapid compared to rate of solution exchange, it may be possible to predict the amplitude of the current at multiple points during a concentration ramp as the product of the activation and inactivation factors at a particular concentration. Specifically, we computed a predicted fractional response as a function of concentration with the equation below, where the EC50=30 μM and IC50=68 μM.
We modelled the concentration changes that would occur in response to various drug applications between 30 μM and 3 mM. We calculated the predicted concentration at 50 ms intervals, and using 6 s as the time constant of solution exchange, 64% of the asymptotic (i.e. full applied) concentration is obtained at the end of a 6 s interval. In Figure 6 we show how the response relationship given above predicts responses to the concentration ramps of varying steepness. The response curve for the 30 μM application continues to increase throughout the entire 6 s. In all other cases, the response reaches a maximum when the concentration is approximately 65 μM. This simple model predicts several of the qualitative features of the α7 receptor-mediated responses, including the timing of peak responses during the rising edge of a high concentration agonist application, and the ability of the receptor to generate a prolonged response to the application of a low concentration of agonist.
Figure 6.
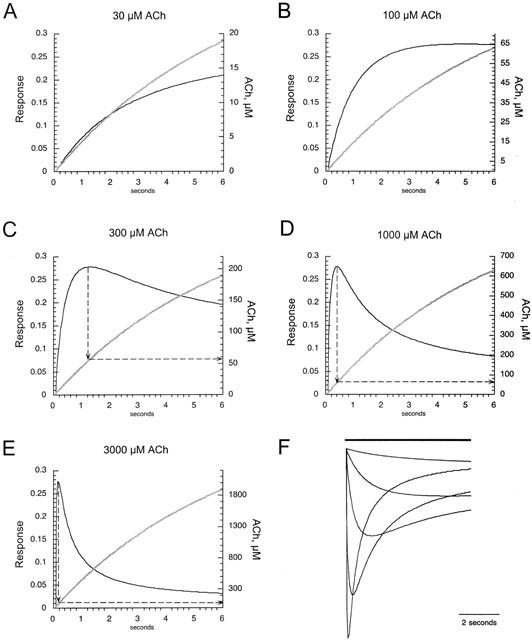
Response calculated as the product of activation and inactivation through the course of slow concentration ramps. Panels A–E show the predicted slope of partial concentration change (thick grey line, Y axis on right hand side) that would be achieved over a period of 6 s, with a time constant of 6 s for solution exchange and the full (asymptotic) concentrations indicated at the top of the panels. The thin black lines in panels A–E show the response function calculated at 50 ms intervals, predicted by the equation in the text. In panels C–E the dashed arrows index the concentrations that correspond to the peak values in the predicted responses. (F) The response curves from panels A–E have been inverted, superimposed, and vertically scaled by ratios of the peak responses experimentally observed in response to the application of ACh over the indicated range of concentrations. This family of curves strongly resembles the original whole cell oocyte currents.
The concept that low concentrations of agonist can promote relatively sustained activation of α7 supports the idea that this receptor may be a good therapeutic target. Several α7-selective agonists have been shown to be cytoprotective in a wide variety of assays including ischemic insults in vivo, trophic factor deprivation, and β-amyloid toxicity (Dajas-Bailador et al., 2000; Kaneko et al., 1997; Kihara et al., 2001; Li et al., 1999; Miao et al., 1998; Shimohama & Kihara, 2001; Strahlendorf et al., 2001). Since α7 receptors have a high permeability for calcium, net charge measurements can be equated to calcium signals, and the kinetics of the response reflect how that calcium signal will be integrated over time by the cell. We have shown that calcium fluxes of similar magnitude, but occurring over different time scales, differ in how they affect intracellular signaling pathways (Li et al., 1999). Concentrations of GTS-21 that are around the EC50 for net charge accumulation are those concentrations which are most effective in assays of cytoprotection. Concentrations of GTS-21 that are 10 fold over the EC50 can be cytotoxic to cells expressing α7 receptors. The cytoprotective dosages require several hours of drug exposure to be effective, suggesting the calcium signal is time-integrated over a extended period. In contrast, cytotoxic concentrations of GTS-21 require only a very brief exposure to the drug, suggesting that a calcium spike associated with time integration during the instant of drug application becomes a trigger for an apoptotic response (Li et al., 1999). A similar high concentration of GTS-21, applied slowly, was not cytotoxic (Papke et al., 2000a).
The development of new therapeutic agents frequently begins with studies of animal models for specific disease states, using rats or rodent cells in tissue culture. However, drugs which are developed with these animal models are intended ultimately for use in humans, and so it is important to know that drugs which are effective in animal models will also be useful for treating human disease. We previously reported that GTS-21, which could protect rodent-derived PC12 cells from β-amyloid toxicity, would not protect human-derived SK-N-SH cells from the same insult (Meyer et al., 1998a). This was presumably due to the reduced efficacy of GTS-21 for human α7 receptors, since 4OH-GTS-21, which is more efficacious on human α7, was cytoprotective for both the rodent and the human cells. The present study reports for the first time the effectiveness of 4MeO-Ca on human α7 receptors. Like 4OH-GTS-21, this agent does not seem to discriminate between human and rat α7 receptors to the same degree that GTS-21 does. However, in contrast to 4OH-GTS-21, 4MeO-Ca shows both agonist activity and a high degree of inhibitory activity. The study of these and other anabaseine derivatives may ultimately make it possible to design drugs with an optimal activity profile for use in treating human disease.
Previous studies of choline as an α7 agonist have utilized the rat receptor (Papke et al., 1996) or rodent tissue (Alkondon et al., 1997). We show that human and rat α7 receptors are equally sensitive to choline. Although choline levels in human brain are unknown, choline levels in human plasma have been reported to range between 5 and 15 μM (Buchman et al., 2000; Fossati et al., 1994), similar to levels reported for rats. Basal choline levels in rat brain are reportedly around 10 μM (Klein et al., 1992), and with neurologic insults and trauma they may rise as high as 100 μM (Jope & Gu, 1991; Scremin & Jenden, 1991). Therefore the range in which choline can begin to affect α7 receptors corresponds to physiological levels of choline in vivo. As revealed by net charge analysis, concentrations of choline as low as 30 μM can produce detectable amounts of α7 activation. Since, even at very high concentrations, choline does not appear to produce long-lived desensitization or inactivation, it is possible that the small activation produced by physiological choline concentrations might persist and represent a form of tonic activation that could then impact the calcium homeostasis of α7-expressing neurons.
In conclusion, our results provide an important re-evaluation of the functional pharmacology of α7 receptors. It appears that these receptors are tuned by their unusual concentration-driven desensitization to function optimally in a narrow concentration range. When high concentrations of agonist are applied, activation is essentially transient during the time when the concentration is temporally optimal. Contrasting this transient activation to conditions when low agonist concentrations are present, we can identify two modalities of α7 receptor function. At least for some indications such as cytoprotection, it is the ability of low agonist concentrations to produce channel activation over a relatively long period of time that is likely to have the greatest therapeutic significance.
Acknowledgments
This work was supported by NIH grants NS32888-02 and GM57481-01A2. We thank Drs Ed Meyer, Vladimir Uteshev and Charles J. Frazier for comments on the manuscript. We thank Irena Garic, Bernadette Schoneburg and Clare Stokes for technical assistance. We thank Taiho Pharmaceuticals for providing GTS-21 and 4OH-GTS-21 and support for the study of those agonists.
Abbreviations
- ACh
acetylcholine
- nAChR
nicotinic acetylcholine receptor
- GTS-21
[3-(2,4-dimethoxybenzylidene)-anabaseine], 4MeO-CA, [3-(4,methoxycinnamilidene)-anabaseine]
- 4-OH-GTS-21
[3-(4-hydroxy,2,methoxybenzylidene)-anabaseine]
References
- ADAMS D.J., NUTTER T.J. Calcium permeability and modulation of nicotinic acetylcholine receptor-channels in rat parasympathetic neurons. J. Physiol. 1992;86:67–76. doi: 10.1016/s0928-4257(05)80009-9. [DOI] [PubMed] [Google Scholar]
- ALKONDON M., ALBUQUERQUE E.X. Diversity of nicotinic acetylcholine receptors in rat hippocampal neurons. III. Agonist actions of the novel alkaloid epibatidine and analysis of type II current. J. Pharmcol. Exp. Therap. 1995;274:771–782. [PubMed] [Google Scholar]
- ALKONDON M., PEREIRA E.F., CORTES W.S., MAELICKE A., ALBUQUERQUE E.X. Choline is a selective agonist of alpha7 nicotinic acetylcholine receptors in the rat brain neurons. Eur. J. Neurosci. 1997;9:2734–2742. doi: 10.1111/j.1460-9568.1997.tb01702.x. [DOI] [PubMed] [Google Scholar]
- AMADOR M., DANI J.A. Mechanism for modulation of nicotinic acetylcholine receptors that can influence synaptic transmission. J. Neurosci. 1995;15:4525–4532. doi: 10.1523/JNEUROSCI.15-06-04525.1995. [DOI] [PMC free article] [PubMed] [Google Scholar]
- AMAR M., THOMAS P., JOHNSON C., LUNT G.G., WONNACOTT S. Agonist pharmacology of the neuronal alpha 7 nicotinic receptor expressed in Xenopus oocytes. FEBS Lett. 1993;327:284–288. doi: 10.1016/0014-5793(93)81005-k. [DOI] [PubMed] [Google Scholar]
- BERTRAND D., BERTRAND S., BALLIVET M. Pharmacological properties of the homomeric alpha 7 receptor. Neurosci Lett. 1992;146:87–90. doi: 10.1016/0304-3940(92)90179-b. [DOI] [PubMed] [Google Scholar]
- BONFANTE-CABARCAS R., SWANSON K.L., ALKONDON M., ALBUQUERQUE E.X. Diversity of nicotinic acetylcholine receptors in rat hippocampal neurons. IV. Regulation by external Ca++ of alpha-bungarotoxin-sensitive receptor function and of rectification induced by internal Mg++ J. Pharmacol. Exp. Ther. 1996;277:432–444. [PubMed] [Google Scholar]
- BRIGGS C.A., ANDERSON D.J., BRIONI J.D., BUCCAFUSCO J.J., BUCKLEY M.J., CAMPBELL J.E., DECKER M.W., DONNELLY-ROBERTS D., ELLIOT R.L., GOPALAKRISHNAN M., HOLLADAY M.W., HUI Y., JACKSON W., KIM D.J.B., MARSH K.C., O'NEILL A.O., PENDERGAST M.A., RYTHER K.B., SULLIVAN J.P., ARNERIC S.P. Functional characterization of the novel nicotinic receptor ligand GTS-21 in vitro and in vivo. Pharm. Biochem. Behav. 1997;57:231–241. doi: 10.1016/s0091-3057(96)00354-1. [DOI] [PubMed] [Google Scholar]
- BRIGGS C.A., MCKENNA D.G. Activation and inhibition of the human alpha7 nicotinic acetylcholine receptor by agonists. Neuropharmacology. 1998;37:1095–1102. doi: 10.1016/s0028-3908(98)00110-5. [DOI] [PubMed] [Google Scholar]
- BUCHMAN A.L., AWAL M., JENDEN D., ROCH M., KANG S.H. The effect of lecithin supplementation on plasma choline concentrations during a marathon. J. Am. Coll. Nutr. 2000;19:768–770. doi: 10.1080/07315724.2000.10718076. [DOI] [PubMed] [Google Scholar]
- CHAVEZ-NORIEGA L.E., CRONA J.H., WASHBURN M.S., URRUTIA A., ELLIOTT K.J., JOHNSON E.C. Pharmacological characterization of recombinant human neuronal nicotinic acetylcholine receptors h alpha 2 beta 2, h alpha 2 beta 4, h alpha 3 beta 2, h alpha 3 beta 4, h alpha 4 beta 2, h alpha 4 beta 4 and h alpha 7 expressed in Xenopus oocytes. J. Pharmacol. Exp. Ther. 1997;280:346–356. [PubMed] [Google Scholar]
- COUTURIER S., BERTRAND D., MATTER J.M., HERNANDEZ M.-C., BERTRAND S., MILLAR N., VALERA S., BARKAS T., BALLIVET M. A neuronal nicotinic acetylcholine receptor subunit (α7) is developmentally regulated and forms a homo-oligomeric channel blocked by α-btx. Neuron. 1990;5:847–856. doi: 10.1016/0896-6273(90)90344-f. [DOI] [PubMed] [Google Scholar]
- DAJAS-BAILADOR F.A., LIMA P.A., WONNACOTT S. The alpha7 nicotinic acetylcholine receptor subtype mediates nicotine protection against NMDA excitotoxicity in primary hippocampal cultures through a Ca(2+) dependent mechanism. Neuropharmacology. 2000;39:2799–2807. doi: 10.1016/s0028-3908(00)00127-1. [DOI] [PubMed] [Google Scholar]
- DE FIEBRE C.M., MEYER E.M., ZOLTEWICZ J., HENRY J.C., MURASKIN S., KEM W.R., PAPKE R.L. Characterization of a family of anabaseine-derived compounds reveals that the 3-(4)-dimethylaminocinnamylidine derivative (DMAC) is a selective agonist at neuronal nicotinic α7/[125I]α-bungarotoxin receptor subtypes. Mol. Pharmacol. 1995;47:164–171. [PubMed] [Google Scholar]
- FOSSATI T., COLOMBO M., CASTIGLIONI C., ABBIATI G. Determination of plasma choline by high-performance liquid chromatography with a postcolumn enzyme reactor and electrochemical detection. J. Chromatogr. B. Biomed Appl. 1994;656:59–64. doi: 10.1016/0378-4347(94)00070-0. [DOI] [PubMed] [Google Scholar]
- GOPALAKRISHNAN M., BUISSON B., TOUMA E., GIORDANO T., CAMPBELL J.E., HU I., DONNELLY-ROBERTS D., ARNERIC S.P., BERTRAND D., SULLIVAN J.P. Stable expression and pharmacological properties of the human α7 nicotinic acetylcholine receptor. Eur. J. Pharm. 1995;290:237–246. doi: 10.1016/0922-4106(95)00083-6. [DOI] [PubMed] [Google Scholar]
- HOULIHAN L.M., SLATER Y., GUERRA D.L., PENG J.H., KUO Y.P., LUKAS R.J., CASSELS B.K., BERMUDEZ I. Activity of cytisine and its brominated isosteres on recombinant human alpha7, alpha4beta2 and alpha4beta4 nicotinic acetylcholine receptors. J. Neurochem. 2001;78:1029–1043. doi: 10.1046/j.1471-4159.2001.00481.x. [DOI] [PubMed] [Google Scholar]
- JOPE R.S., GU X. Seizures increase acetylcholine and choline concentrations in rat brain regions. Neurochem. Res. 1991;16:1219–1226. doi: 10.1007/BF00966699. [DOI] [PubMed] [Google Scholar]
- KANEKO S., MAEDA T., KUME T., KOCHIYAMA H., AKAIKE A., SHIMOHAMA S., KIMURA J. Nicotine protects cultured cortical neurons against glutamate-induced cytotoxicity via alpha7-neuronal receptors and neuronal CNS receptors. Brain Res. 1997;765:135–140. doi: 10.1016/s0006-8993(97)00556-8. [DOI] [PubMed] [Google Scholar]
- KEMPSILL F.E., COVERNTON P.J., WHITING P.J., CONNOLLY J.G. Agonist activation and alpha-bungarotoxin inhibition of wild type and mutant alpha7 nicotinic acetylcholine receptors. Eur. J. Pharmacol. 1999;383:347–359. doi: 10.1016/s0014-2999(99)00646-9. [DOI] [PubMed] [Google Scholar]
- KIHARA T., SHIMOHAMA S., SAWADA H., HONDA K., NAKAMIZO T., SHIBASAKI H., KUME T., AKAIKE A. alpha 7 nicotinic receptor transduces signals to phosphatidylinositol 3-kinase to block A beta-amyloid-induced neurotoxicity. J. Biol. Chem. 2001;276:13541–13546. doi: 10.1074/jbc.M008035200. [DOI] [PubMed] [Google Scholar]
- KLEIN J., KOPPEN A., LOFFELHOLZ K., SCHMITTHENNER J. Uptake and metabolism of choline by rat brain after acute choline administration. J. Neurochem. 1992;58:870–876. doi: 10.1111/j.1471-4159.1992.tb09337.x. [DOI] [PubMed] [Google Scholar]
- KRAUSE R.M., BUISSON B., BERTRAND S., CORRINGER P.J., GALZI J.L., CHANGEUX J.P., BERTRAND D. Ivermectin: a positive allosteric effector of the alpha7 neuronal nicotinic acetylcholine receptor. Mol. Pharmacol. 1998;53:283–294. doi: 10.1124/mol.53.2.283. [DOI] [PubMed] [Google Scholar]
- LI Y., PAPKE R.L., HE Y.-J., MILLARD B., MEYER E.M. Characterization of the neuroprotective and toxic effects of α7 nicotinic receptor activation in PC12 cells. Brain Res. 1999;81:218–225. doi: 10.1016/s0006-8993(99)01372-4. [DOI] [PubMed] [Google Scholar]
- LINDSTROM J. Nicotinic acetylcholine receptors in health and disease. Mol. Neurobiol. 1997;15:193–222. doi: 10.1007/BF02740634. [DOI] [PubMed] [Google Scholar]
- MACOR J.E., GURLEY D., LANTHORN T., LOCH J., MACK R.A., MULLEN G., TRAN O., WRIGHT N., GORDON J.C. The 5-HT3 antagonist tropisetron (ICS 205-930) is a potent and selective alpha7 nicotinic receptor partial agonist. Bioorg. Med. Chem. Lett. 2001;11:319–321. doi: 10.1016/s0960-894x(00)00670-3. [DOI] [PubMed] [Google Scholar]
- MEYER E., KURYATOV A., GERZANICH V., LINDSTROM J., PAPKE R.L. Analysis of 40H-GTS-21 selectivity and activity at human and rat α7 nicotinic receptors. J. Pharmacol. Exp. Ther. 1998a;287:918–925. [PubMed] [Google Scholar]
- MEYER E.M., TAY E.T., ZOLTEWICZ J.A., PAPKE R.L., MEYERS C., KING M., FIEBRE C.M.D. Neuroprotective and memory-related actions of novel α7 nicotinic agents with different mixed agonist/antagonist properties. J. Pharmacol. Exp. Ther. 1998b;284:1026–1032. [PubMed] [Google Scholar]
- MIAO H., LIU C., BISHOP K., GONG Z.H., NORDBERG A., ZHANG X. Nicotine exposure during a critical period of development leads to persistent changes in nicotinic acetylcholine receptors of adult rat brain. J. Neurochem. 1998;70:752–762. doi: 10.1046/j.1471-4159.1998.70020752.x. [DOI] [PubMed] [Google Scholar]
- MIKE A., CASTRO N.G., ALBUQUERQUE E.X. Choline and acetylcholine have similar kinetic properties of activation and desensitization on the alpha7 nicotinic receptors in rat hippocampal neurons. Brain Res. 2000;882:155–168. doi: 10.1016/s0006-8993(00)02863-8. [DOI] [PubMed] [Google Scholar]
- MOTT D.D., ERREGER K., BANKE T.G., TRAYNELIS S.F. Open probability of homomeric murine 5-HT(3A) serotonin receptors depends on subunit occupancy. J. Physiol. 2001;535:427–443. doi: 10.1111/j.1469-7793.2001.00427.x. [DOI] [PMC free article] [PubMed] [Google Scholar]
- PAPKE R.L., BENCHERIF M., LIPPIELLO P. An evaluation of neuronal nicotinic acetylcholine receptor activation by quaternary nitrogen compounds indicates that choline is selective for the α7 subtype. Neurosci. Lett. 1996;213:201–204. doi: 10.1016/0304-3940(96)12889-5. [DOI] [PubMed] [Google Scholar]
- PAPKE R.L., MEYER E., NUTTER T., UTESHEV V.V. Alpha7-selective agonists and modes of alpha7 receptor activation. Eur. J. Pharmacol. 2000a;393:179–195. doi: 10.1016/s0014-2999(00)00009-1. [DOI] [PubMed] [Google Scholar]
- PAPKE R.L., THINSCHMIDT J.S. The correction of alpha7 nicotinic acetylcholine receptor concentration-response relationships in Xenopus oocytes. Neurosci. Let. 1998;256:163–166. doi: 10.1016/s0304-3940(98)00786-1. [DOI] [PubMed] [Google Scholar]
- PAPKE R.L., THINSCHMIDT J.S., MOULTON B.A., MEYER E.M., POIRIER A. Activation and inhibition of rat neuronal nicotinic receptors by ABT-418. Br. J. Pharm. 1997;120:429–438. doi: 10.1038/sj.bjp.0700930. [DOI] [PMC free article] [PubMed] [Google Scholar]
- PAPKE R.L., WEBSTER J.C., LIPPIELLO P.M., BENCHERIF M., FRANCIS M.M. The activation and inhibition of human nAChR by RJR-2403 indicate a selectivity for the α4β2 receptor subtype. J. Neurochem. 2000b;75:204–216. doi: 10.1046/j.1471-4159.2000.0750204.x. [DOI] [PubMed] [Google Scholar]
- SCREMIN O.U., JENDEN D.J. Time-dependent changes in cerebral choline and acetylcholine induced by transient global ischemia in rats. Stroke. 1991;22:643–647. doi: 10.1161/01.str.22.5.643. [DOI] [PubMed] [Google Scholar]
- SEGUELA P., WADICHE J., DINELY-MILLER K., DANI J.A., PATRICK J.W. Molecular cloning, functional properties and distribution of rat brain alpha 7: a nicotinic cation channel highly permeable to calcium. J. Neurosci. 1993;13:596–604. doi: 10.1523/JNEUROSCI.13-02-00596.1993. [DOI] [PMC free article] [PubMed] [Google Scholar]
- SHIMOHAMA S., KIHARA T. Nicotinic receptor-mediated protection against beta-amyloid neurotoxicity. Biol. Psychiatry. 2001;49:233–239. doi: 10.1016/s0006-3223(00)01100-8. [DOI] [PubMed] [Google Scholar]
- STRAHLENDORF J.C., ACOSTA S., MILES R., STRAHLENDORF H.K. Choline blocks AMPA-induced dark cell degeneration of Purkinje neurons: potential role of the alpha7 nicotinic receptor. Brain Res. 2001;901:71–78. doi: 10.1016/s0006-8993(01)02270-3. [DOI] [PubMed] [Google Scholar]
- UTESHEV V.V., MEYER E.M., PAPKE R.L.Activation and inhibition of native neuronal alpha-bungarotoxin-sensitive nicotinic ACh receptors Brain Res. 2002(in press) [DOI] [PubMed]
- VERNINO S., AMADOR M., LUETJE C.W., PATRICK J., DANI J.A. Calcium modulation and high calcium permeability of neuronal nicotinic acetylcholine receptors. Neuron. 1992;8:127–134. doi: 10.1016/0896-6273(92)90114-s. [DOI] [PubMed] [Google Scholar]