

Abstract
The antigen-induced inflammatory response in the Brown Norway rat is a model commonly used to assess the impact of novel compounds on airway eosinophilia. A detailed functional, cellular and molecular characterization of this model has not yet been performed within a single study. This information together with the temporal changes in this phenomenon should be known before this model can be used, with confidence, to elucidate the mechanisms of action of novel anti-inflammatory drugs.
Antigen challenge caused an accumulation of eosinophils in lung tissue 24 h after challenge. Accumulation of CD2+ T cells was not apparent until after 72 h.
Interestingly, mRNA for the Th2 type cytokines interleukin (IL)-4, IL-5 and IL-13 and eotaxin were elevated in lung tissue after challenge and the expression of IL-13 and eotaxin protein increased at around 8–12 h. The temporal changes in both the biomarker production and the functional responses are important factors to consider in protocol design prior to initiating a compound screening program.
A neutralising antibody (R73) against αβ-TCR caused a significant reduction in T cell numbers accompanied by a significant suppression of eosinophil accumulation.
Airway hyperreactivity (AHR) was not apparent in this specific Brown Norway model in sensitized animals after a single or multiple challenges although eosinophil influx was seen in the same animals.
In conclusion, this is a convenient pre-clinical model (incorporating the measurement of biomarkers and functional responses) for screening novel small molecule inhibitors and/or biotherapeutics targeted against T cell/eosinophil infiltration/activation.
Keywords: Lung, T lymphocytes, eosinophils, cytokines
Introduction
It is now a widely accepted paradigm that a subset of allergen-sensitized and activated CD4+ T helper 2 (Th2) cells play a key role in orchestrating asthmatic airways inflammation (Kon & Kay, 1999). These cells secrete type 2 cytokines such as interleukin (IL)-4, IL-5 and IL-13 that promote airways eosinophilia and immunoglobulin isotype class switching to IgE (Kay, 1997; Wardlaw, 1999). Studies of asthmatics have revealed increased gene expression for type 2 cytokines in bronchial mucosa and a positive association between expression of these cytokines, especially IL-5, and the severity of disease symptoms (Kay, 1997). However, these cytokines cannot be considered to act in isolation. There is good evidence that other mediators such as the C-C chemokines eotaxin and RANTES act in synergy with type 2 cytokines to recruit eosinophils into asthmatic airways (Bertrand & Ponath, 2000). Furthermore, macrophage-derived cytokines such as tumour necrosis factor alpha (TNFα) and IL-1β might facilitate extravasation of eosinophils and other leukocytes in part by upregulating cellular adhesion molecules such as intercellular adhesion molecule-1 (ICAM-1) and vascular cell adhesion molecule-1 (VCAM-1) (Bjornsdottir & Cypcar, 1999).
Small animal models are used to investigate further the mechanisms that lead to the development of airways inflammation and airway hyper reactivity (AHR) in asthma, and to identify targets for novel asthma therapies. Models of allergic airways inflammation in the rat and mouse have been widely used, since eosinophilia in these species is accompanied by increased expression of genes for type 2 cytokines in lung tissue and by AHR, key hallmarks of human allergic asthma (Garlisi et al., 1997; Underwood et al., 1997). These animal studies have yielded valuable insights into the complex relationships between the many inflammatory mediators and cell types involved in allergic airways inflammation and AHR. To understand more about the temporal relationships between these parameters, we have now carried out a study to determine the time-course of antigen-induced accumulation of eosinophils and T cells, and expression of key proinflammatory mediators including type 2 cytokines and eotaxin, in the Brown Norway rat lung. Cells were counted after recovery from lung tissue by enzymatic disaggregation. Cytokine and chemokine expression in lung tissue was measured either by reverse-transcription polymerase chain reaction (RT–PCR) to assess mRNA expression, or by enzyme-linked immunosorbant assay (ELISA) to measure secreted protein. We also measured AHR to the spasmogens acetylcholine (ACh) and bradykinin (BK) following single or multiple antigen challenge. Brown Norway rats have previously been demonstrated to exhibit an early and a late response with AHR (Laberge et al., 2000) but in this study we only assessed AHR and did not investigate whether these animals exhibited an early and a late response to allergen.
The data regarding the changes in eosinophil and T-cell infiltration and the increase in Th2 cytokine gene and protein expression following allergen challenge in this model over time provides important information regarding the use of this model for investigating the effects of small molecule inhibitors and biotherapeutics. With this information compounds able to inhibit ‘Th2 relevant' biomarkers could be selected in this model based on their efficacy and pharmacokinetic profile and then tested on the same biomarker in man to ensure that an effective dose was being used in clinical trials prior to assessment of the compound on the functional asthma phenotype.
Methods
Animals
Male Brown Norway rats (BN/SsNOlaHsd) were purchased from Harlan-Olac (Bicester, U.K.) at 7–9 weeks of age and housed for 5 days before being used for experimental protocols. Food and water were supplied ad libitum. U.K. Home Office guidelines for animal welfare based on the Animals (Scientific Procedures) Act 1986 were strictly observed.
Sensitization, treatment and challenge regimens
Rats were sensitized by injection on experimental days 0, 12 and 21 with antigen (ovalbumin, 100 μg) administered together with aluminium hydroxide adjuvant (100 mg) in saline (1 ml, intraperitoneal (i.p.). On either day 28 or 29, rats were placed in a 72 l perspex chamber and challenged by exposure for 30 min to an aerosol of ovalbumin generated from a 10 mg ml−1 solution by a nebulizer (deVilbiss Ultraneb, deVilbiss Healthcare, London, U.K.). Sham-challenged controls were similarly exposed to an aerosol of saline. Further animals acted as naïves. Cell populations in the airway lumen and lung tissue, gene and protein expression in lung tissue were determined (as described below) at increasing times (0.5, 2, 4, 6, 8, 12, 24, 48 and 72 h) after antigen or sham challenge. Parameters were also measured in naïve animals at the same time points.
In a parallel group of sensitised animals, cell populations in the airway lumen and airway hyperreactivity were measured at 24 h after single or multiple (one challenge each day for 6 consecutive days) challenge. Twenty-four hour was chosen, as this was the time point chosen for measuring cell infiltration and it has also been used by other workers to measure eosinophilia and AHR (Chiba & Misawa, 1994). Group size was 7–12.
In a separate experiment sensitized BN rats received antibody R73 (neutralizing antibody against αβ-TCR), which we have previously confirmed depletes T cell numbers (300 μg kg−1, i.v., Yoshino et al., 1991; Haddad et al., 2002), isotype-matched control antibody (mouse IgG1) or remained untreated. Twenty-four hours later, rats were challenged by exposure for 30 min to an aerosol of ovalbumin generated from a 10 mg ml−1 solution by a nebuliser (deVilbiss Ultraneb, deVilbiss Healthcare, London, U.K.). Untreated animals were similarly exposed to an aerosol of saline. Further animals acted as naïves. Cell populations in the lung tissue were measured. Group size was eight.
Cell recovery from lung tissue
Rats were euthanized (sodium pentobarbitone, 200 mg kg−1, i.p.), the thorax was opened and the heart and lungs were removed en bloc. A cannula was inserted through the right ventricle to allow the pulmonary vasculature to be flushed at low pressure with cold phosphate-buffered saline to remove the blood pool of cells. The lobes, together with their associated main-stem bronchi, were chopped into 1 mm pieces. A homogenous sample of tissue was immediately frozen in liquid nitrogen and then stored at −80°C until required for mRNA assay or protein concentration as described below. To disaggregate cells, 300 mg of homogenous chopped lung tissue was incubated (37°C) for 1 h with gentle agitation in 10 ml of RPMI 1640 medium/10% foetal bovine serum (FBS) containing collagenase (1 mg ml−1) and DNase (25 μg/ml−1). The recovered cells were filtered (mesh size 70 μm), washed and resuspended in 1 ml RPMI 1640 medium/10% FBS.
Cell counts
Counts of total number of cells recovered from lung tissue were made using an automated cell counter (Cobas Argos, Roche ABX Hematologie, Montpellier, France). Differential cell counts on 200 cells per slide were carried out using standard morphological criteria and the percentage of eosinophils, neutrophils and lymphomononuclear cells were determined from lung tissue on cytocentrifuge preparations stained with Wright–Giemsa stain. Only viable cells were counted.
T lymphocytes recovered from lung tissue were counted by flow cytometry after labelling with fluorophore-labelled monoclonal antibodies. 1×10⁵ cells were incubated (30 min, 4°C) with saturating concentrations of an FITC-labelled antibody against CD2 (MRC OX34), a pan-T cell marker expressed on approximately 80% of T cells in the rat lung, together with a PE-labelled antibody against either CD4 (W3/25) or CD8 (MRC OX8).
Following incubation, erythrocytes were lysed and the remaining cells were stabilized and fixed with commercial reagents (Immunoprep, Coulter, U.K.). Unlabelled cells and fluorophore-labelled IgG isotype control antibody were used to control for autofluorescence and non-specific binding respectively. Flow cytometry was performed using an EPICS XL flow cytometer and software (Coulter Electronics, U.K.). Preliminary gating was achieved with forward- and side-scatter characteristics to define the total lymphocyte population. The number of CD2+ cells that were CD4+ or CD8+ were calculated from two-colour plots of FITC-fluorescence against PE-fluorescence.
RNA extraction from lung tissue
RNA was extracted from the lung tissue using a guanidium thiocyanate-phenol-chloroform extraction technique. Fifty milligram of tissue were homogenized in 800 μl denaturing solution containing guanidine thiocyanate (16 mg), sodium citrate (0.05 M), sarcosyl (80 μl) and β-mercaptoethanol (6 μl). After addition of sodium acetate (2 M, 80 μl), water-saturated phenol (800 μl) and chloroform/isoamylalcohol (49 : 1, 160 μl), the mixture was centrifuged. The aqueous phase, containing RNA, was removed and mixed with an excess volume of isopropanol. The RNA was allowed to precipitate (overnight, −20°C), recovered by centrifugation, and resuspended in 75% ethanol (500 μl). After recovery again by centrifugation, the RNA was freeze-dried and dissolved in water (50 μl). The RNA yield and purity was assessed by A260/A280 spectrophotometric measurements on the Genequant RNA/DNA quantifier (Amersham Pharmacia Biotech, U.K.). RNA was stored at −80°C until used for reverse transcription and polymerase chain reaction (RT–PCR).
Reverse transcription and polymerase chain reaction
RNA (1 μg) was reverse transcribed to complementary deoxyribonucleic acid (cDNA) in 25 μl reverse transcriptase buffer ((in mM): Tris-HCl pH 8.3 50, KCL 50, MgCl2 10, spermidine 0.5 and dithiothreitol 10) containing oligo dT (1 μg), deoxynucleoside triphosphate mix (dNTP, each 0.2 mM) and avian myeloblastosis virus (AMV) reverse transcriptase (20 u). Tubes were incubated in a Perkin Elmer 480 thermal cycler (Boston, MA, U.S.A.) at 42°C for 60 min. Reverse transcriptase was then inactivated by incubation at 94°C for 2 min. The reverse transcription mixture was diluted with 25 μl of RNase-free water ready for use in polymerase chain reaction (PCR).
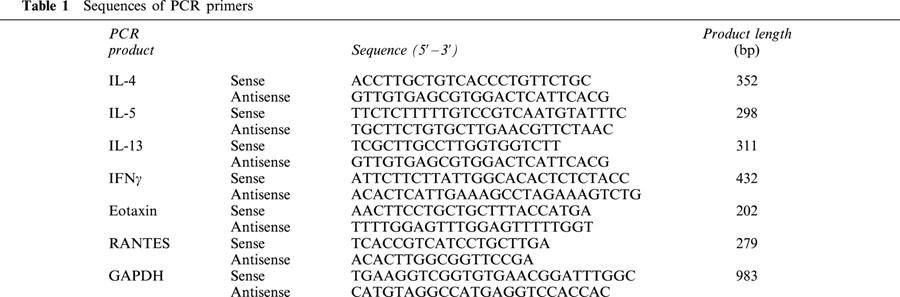
PCR was carried out to amplify target fragments of cDNA for the type 1 cytokine interferon gamma (IFNγ), the type 2 cytokines IL-4, IL-5, IL-13, the C-C chemokines eotaxin and RANTES and a control gene GAPDH. PCR was performed with 4 μl of reverse transcription product using Ready-To-Go PCR beads (Amersham Pharmacia Biotech, Herts, U.K.), which contain Taq DNA polymerase, dNTP and buffer. Beads were reconstituted using RNase-free water and 0.5 μM of each gene-specific forward and reverse primers (obtained from Invitrogen, Paisley, U.K.) to make a final volume of 25 μl. The PCR was carried out in a Perkin Elmer Geneamp PCR system 9700 (PE Biosystems, Warrington, Cheshire, U.K.). After an initial denaturation at 95°C for 5 min, amplication was carried out through 28–40 cycles of denaturation at 94°C for 30 s, annealing at 55°C (GAPDH), 60°C (all other genes) for 30 s and extension at 72°C for 45 s. Final extension was at 72°C for 7 min followed by a final hold at 4°C. Preliminary PCR runs were carried out to determine the numbers of cycles necessary to ensure linear amplification of each target fragment. The cycle numbers used were 28 for GAPDH and 35 for all other fragments.
PCR products together with molecular size markers were separated by electrophoresis through agarose gels (2% in 40 mM tris-acetate/1 mM EDTA buffer) containing 5 μg ml−1 of ethidium bromide to stain PCR products and markers. Bands of each target transcript were visualized by U.V. transillumination and the image photographed using a UVP BioImaging and Analysis System (UVP, Cambridge, U.K.). Optical densities of each band were calculated by image analysis software (Phoretix, UVP, Cambridge, U.K.). For each sample the level of gene expression of each transcript were normalised to that of the housekeeping gene GAPDH.
Measurement of cytokine and chemokine concentrations by ELISA
Approximately 500 mg of the lung tissue was chopped and flash frozen in liquid nitrogen and stored at −80°C until needed. Approximately 250 mg of lung tissue was weighed and homogenized with 1 ml of ice-cold saline. The homogenized sample was then spun at 800×g for 10 min. The resulting supernatant was taken off and stored at −20°C.
IL-13, RANTES, IL-4, IL-1β and IFNγ levels in the lung tissue supernatant were determined using a rat specific solid phase sandwich ELISA kit (Biosource International, Camarillo, CA, U.S.A.). The minimum detectable concentration of IL-13 was 1.5 pg ml−1, RANTES was <20 pg ml−1, IL-4 was <2 pg ml−1, IL-1β was <3 pg ml−1 and IFNγ was <13 pg ml−1 and there was no detectable cross-reactivity with other known rat and mouse cytokines and chemokines. TNFα levels were determined in the lung tissue using a rat specific sandwich immunoassay kit obtained from R & D Systems (R & D Systems Inc., Minneapolis, MN, U.S.A.). The minimum detectable concentration was found to be <5 pg ml−1 and there was no significant cross-reactivity with other known cytokines/chemokines. Because of the high degree of similarity maintained in chemokines across species, a mouse ELISA kit containing a polyclonal antibody which recognises mouse eotaxin was used to detect the rat cognate. Thus rat eotaxin levels were determined using a mouse ELISA kit (R & D Systems Inc., Minneapolis, MN, U.S.A.). No significant cross-reactivity was detected with other cytokines/chemokines and the minimum detectable concentration of eotaxin was found to be <3 pg ml−1.
Measurement of airway reactivity
Rats were anaesthetized with sodium pentobarbitone (80 mg kg−1, i.p.) and mechanically ventilated with a tidal volume of 1 ml 100 g−1 set at 90 p.p.m. Airway resistance (RL) was calculated using a Buxco LS20 respiratory mechanics analyser from measurements of tracheal airflow and intrapulmonary pressure.
Rats received aerosols of either acetylcholine chloride (40, 100, 200 and 400 mM for 5 s, 5 min intervals) or bradykinin (1 mM, 30 s (Huang et al., 1999)). Aerosols were generated by an ultrasonic nebulizer (de Vilbiss Pulmosonic) connected into the inspiratory arm of the ventilation circuit. Airway reactivity was recorded as peak changes in RL after spasmogen administration.
In the same animals, cell influx into the airway lumen was quantified by counting cells recovered in bronchoalveolar lavage (BAL) fluid. Lavage was performed by flushing the airways with two aliquots (each 10 ml kg−1) of RPMI 1640 medium containing 10% foetal bovine serum (FBS) delivered through the tracheal cannula. The two recovered aliquots were pooled. Approximately 4–5 ml of the BAL fluid was recovered. Total white cell counts and differential counts were performed as described previously.
Materials
The following materials and reagents were used: sodium pentobarbitone (Euthatal) (Rhône Mérieux, U.K.); RPMI 1640 medium and foetal bovine serum (Gibco, U.K.); collagenase and DNase (Boehringer, U.K.); Immunoprep leukocyte preparation reagents (Coulter, U.K.); Ovalbumin, aluminium hydroxide, Wright-Giemsa stain, reagents for RNA extraction and ethidium bromide (Sigma, U.K.); antibodies for flow cytometry (Serotec, U.K.); reagents for RT–PCR (Promega and Pharmacia Biotech, U.K.) except tris-acetate/EDTA buffer (Gibco, U.K.). Primers were synthesized from published sequences (Table 1) by Gibco, U.K.
Table 1.
Sequences of PCR primers
Data analysis
Cell counts are expressed as cell number in each ml of BAL or each mg of lung tissue and presented as group mean±s.e.mean. For each PCR product, the optical density of the target band was calculated as a percentage of that for GAPDH obtained from the same animal. For each group, data were normalized for the value obtained in unchallenged animals at the same time point and is presented as a group mean±s.e.mean. ELISA data were expressed as amount of protein in each mg of lung tissue and presented as group mean±s.e.mean. Airway reactivity was assessed by measuring changes in airway resistance evoked by inhaled acetylcholine or bradykinin. Data were expressed as mean±s.e.mean.
In all analyses, the statistical significance of the differences between group results was determined using the Kruskal Wallis multiple comparison test for non-parametric data with Dunn's post-test. P<0.05 was accepted as significant. An antigen-induced change in any parameter was defined as a significant difference between the results in challenged and sham-challenged (saline exposed) groups at the same time point.
Results
Time course for cell infiltration into the lung tissue
Compared with sham-challenged controls, eosinophil numbers were significantly increased 24 h after challenge and remained elevated after 72 h. Neutrophil numbers were significantly elevated 4 h after challenge and remained elevated at 12 h. After 24 h the numbers had fallen and were no longer significantly different to those in sham-challenged animals (Figure 1A,B).
Figure 1.
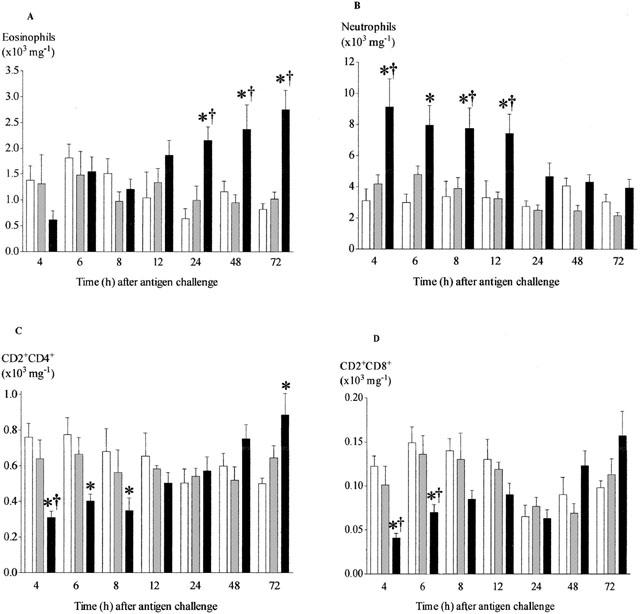
Time course of changes in the number of eosinophils (A), neutrophils (B), CD2+CD4+ (C) and CD2+CD8+ (D) cells recovered from lung tissue after antigen challenge in the Brown Norway rat. Antigen (ovalbumin)-sensitized Brown Norway rats were either unchallenged (open bars), exposed to inhaled saline (sham challenged, shaded bars) or challenged with inhaled antigen aerosol (solid bars). At a range of times after challenge, cells were isolated from lung tissue by enzymatic disaggregation. Cells were counted by light microscopy (a and b) or by flow cytometry (c and d). Group size was 10–12. Results represent mean±s.e.mean. *P<0.05 compared with unchallenged group; †P<0.05 compared with sham challenged group.
The majority of CD2+ cells were also CD4+, with lower numbers expressing CD8 (Figure 1C,D). Interestingly the number of CD2+/CD4+ and CD2+/CD8+ cells were significantly reduced after antigen challenge in the earlier points (4–8 h) of the time course when compared to saline controls. This difference however was lost after 8 h with CD2+/CD4+ being significantly increased at 72 h.
Effect of antibody R73 on cell infiltration into the lung tissue
When compared with the lungs of unchallenged rats, the numbers of total T cells (CD2+) were higher in lungs of antigen-challenged rats but the differences did not achieve significance. However, in antigen-challenged rats the numbers of these cells were significantly reduced in animals pre-treated with antibody R73 (Figure 2A).
Figure 2.
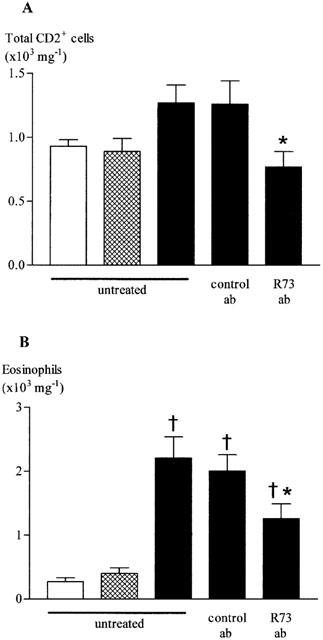
Effect of antibody R73 on total T cells (A) and eosinophils (B) recovered from lung tissue after antigen challenge in the Brown Norway rat. Antigen (ovalbumin)-sensitized Brown Norway rats were either unchallenged and untreated (open bars), exposed to inhaled saline and untreated (shaded bars) or challenged with inhaled antigen aerosol (solid bars) and either untreated, given antibody R73 (300 μg kg−1, i.v.) or control antibody (mouse IgG1). 24 h later, cells were isolated from lung tissue by enzymatic disaggregation. Cells were counted by flow cytometry (a) or by light microscopy (b). Group size was 8. Results represent mean±s.e.mean. †P<0.05 compared with saline challenged group; *P<0.05 compared with challenged, control antibody treated group.
Antigen challenge caused a significant increase in eosinophil numbers in lung tissue. In R73 treated rats, the reduction in T cell numbers was accompanied by a significant inhibition of eosinophil accumulation (Figure 2B).
Time course for gene expression for Th1 and Th2 dependent cytokines in the lung tissue
Compared with expression in sham-challenged controls, levels of mRNA for the cytokines IL-4, IL-5, IL-13 and eotaxin each became significantly increased 2 h after challenge. Expression of mRNA for IL-4, IL-13 and eotaxin had returned to basal level after 8 h, but the level of mRNA for IL-5 did not decline until after 24 h (Figure 3A,B,C,E). In contrast, there was no significant increase in expression of mRNA for IFNγ at any time point (Figure 3D). In contrast, expression of mRNA for RANTES showed only a significant fall that was apparent after 12 h and maintained until at least 72 h after challenge (Figure 3F). Figure 4 shows an example of each gene transcript at 8 h.
Figure 3.
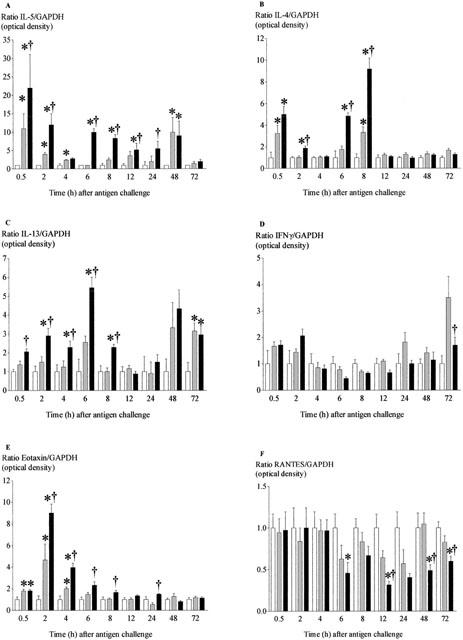
Time-course of changes in expression of mRNA for IL-5 (A), IL-4 (B), IL-13 (C), IFN-γ (D), eotaxin (E) and RANTES (F) in lung tissue after antigen challenge in the Brown Norway rat. Antigen (ovalbumin)-sensitized Brown Norway rats were either unchallenged (open bars), exposed to inhaled saline (sham challenged, shaded bars) or challenged with inhaled antigen aerosol (solid bars). At a range of times after challenge, gene expression was determined by RT–PCR. For each animal, the optical density of the target band was calculated as a percentage of that for GAPDH. For each group, data were normalised for the value obtained in unchallenged animals at the same time-point. Group size was 10–12. Results represent mean±s.e.mean. *P<0.05 compared with unchallenged group; †P<0.05 compared with sham challenged group.
Figure 4.
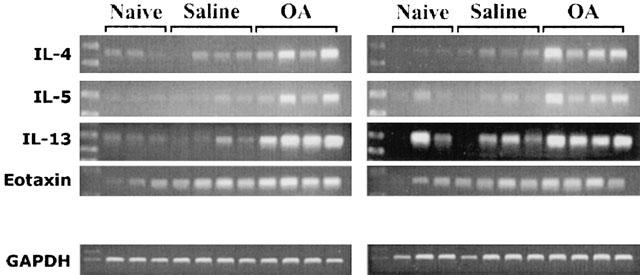
Changes in expression of mRNA for cytokines and chemokines in lung tissue 8 h after antigen challenge in the Brown Norway rat. Agarose gels of PCR-amplified cDNA prepared by reverse transcription of RNA extracted from lung tissue. Antigen (ovalbumin)-sensitized Brown Norway rats were either unchallenged, exposed to inhaled saline (sham challenged) or challenged with inhaled antigen aerosol.
Time course for protein expression for Th1 and Th2 dependent cytokines and TNFα, IL-1β in the lung tissue
To confirm the increase in mRNA expression translates into changes in protein we measured lung homogenate levels of IL-4, IL-13, IFNγ, eotaxin and RANTES (as yet there is no ELISA kit for rat IL-5). There was no significant increase in IL-4 protein in antigen challenged compared to saline challenged rats (Figure 5A), IL-13 was significantly increased following antigen challenge starting at 2 h and this was observed up to 12 h (Figure 5B). IFNγ remained below detection at all time points after challenge (data not shown). The concentration of eotaxin was significantly elevated 4 h after challenge, and returned to basal level after 48 h (Figure 5C). In agreement with the gene expression data, there was no significant decrease in secretion of RANTES (Figure 5D). We also measured two cytokines known to be involved in inflammation, TNFα and IL-1β in lung tissue homogenates. These became significantly increased 0.5 and 2 h after challenge, respectively. The significant increase in IL-1β levels seemed to be maintained longer than the levels of TNFα (Figure 6).
Figure 5.
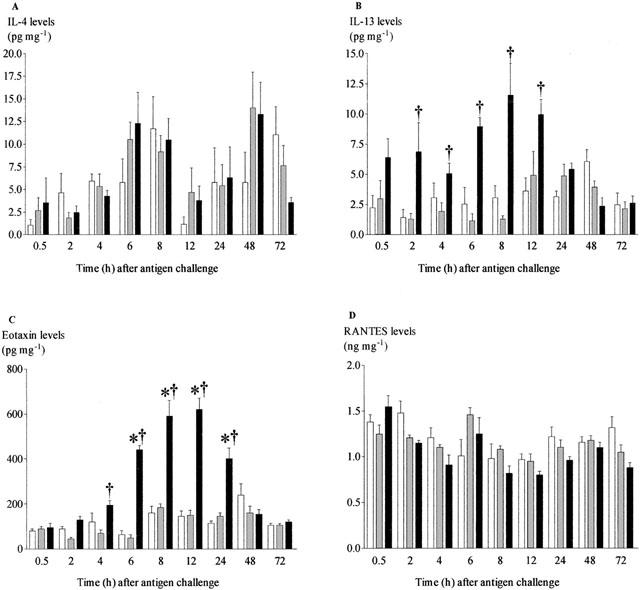
Time-course of changes in concentrations of IL-4 (A), IL-13 (B), eotaxin (C) and RANTES (D) in lung tissue after antigen challenge in the Brown Norway rat. Antigen (ovalbumin)-sensitised Brown Norway rats were either unchallenged (open bars), exposed to inhaled saline (sham challenged, shaded bars) or challenged with inhaled antigen aerosol (solid bars). At a range of times after challenge, chemokine concentrations in tissue were determined by ELISA. Group size was 10–12. Results represent mean±s.e.mean. *P<0.05 compared with unchallenged group; †P<0.05 compared with sham challenged group.
Figure 6.
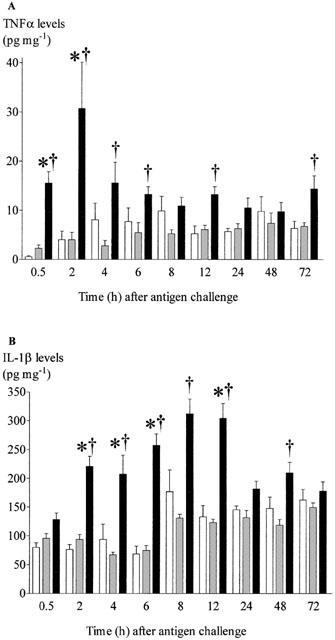
Time-course of changes in concentrations of TNF-α (A) and IL-1β (B) in lung tissue after antigen challenge in the Brown Norway rat. Antigen (ovalbumin)-sensitized Brown Norway rats were either unchallenged (open bars), exposed to inhaled saline (sham challenged, shaded bars) or challenged with inhaled antigen aerosol (solid bars). At a range of times after challenge, chemokine concentrations in tissue were determined by ELISA. Group size was 10–12. Results represent mean±s.e.mean. *P<0.05 compared with unchallenged group; †P<0.05 compared with sham challenged group.
Determination of AHR and cell infiltration into the BAL fluid following single or multiple antigen challenge in sensitized Brown Norway rats
There were no differences in baseline measurements between challenged and control rats prior to spasmogen (data not shown). There were no significant differences in airway reactivity to inhaled acetylcholine or bradykinin in either the single or multiple challenged groups (Figure 7A–C).
Figure 7.
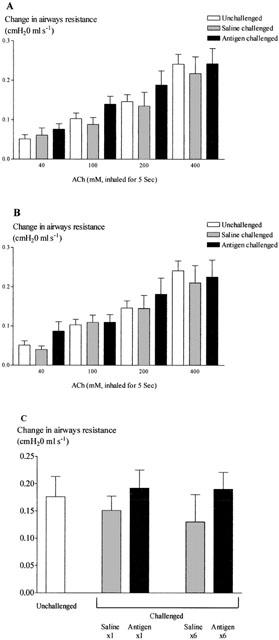
Changes in airway reactivity to inhaled acetylcholine 24 h after single (A) or multiple (B) antigen challenge and to inhaled bradykinin (C) 24 h after both single and multiple challenge in the Brown Norway rat. Antigen (ovalbumin)-sensitized Brown Norway rats were either unchallenged (open bars), exposed to inhaled saline (sham challenged, shaded bars) or challenged with inhaled antigen aerosol (solid bars). Animals were challenged with saline or ovalbumin once or once daily for six consecutive days. Group size was 7–8. Results are mean±s.e.mean.
However, as expected, the number of eosinophils and neutrophils in the BAL following either single or multiple antigen challenge significantly increased. Surprisingly there was no greater number of cells after antigen challenge once each day for six consecutive days compared to a single challenge (Figure 8A,B). The number of mononuclear cells did not increase after single challenge but there was a significant increase in number following multiple antigen challenge (Figure 8C).
Figure 8.
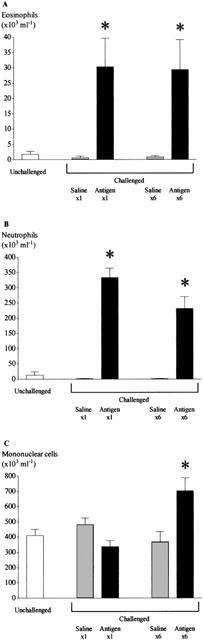
Changes in the number of eosinophils (A), neutrophils (B) and mononuclear cells (C) recovered by bronchoalveolar lavage following single and multiple antigen challenge in the Brown Norway rat. Antigen (ovalbumin)-sensitized Brown Norway rats were either unchallenged (open bars), exposed to inhaled saline (sham challenged, shaded bars) or challenged with inhaled antigen aerosol (solid bars). Animals were challenged with saline or ovalbumin once or once daily for 6 consecutive days. Group size was 7–8. Results are mean±s.e.mean. *P<0.05 compared with relevant sham challenged group.
Discussion
The aim of this study was to characterize the antigen-induced inflammatory response in the Brown Norway rat, a model commonly used to assess the impact of novel compounds on airway eosinophilia. In this study we have undertaken a detailed functional, cellular and molecular characterization of this model, something that has not yet been performed within a single study. This information, together with the temporal changes seen in these phenomenona, will provide invaluable information in order that this model can be used, with confidence, to elucidate the mechanisms of action of novel anti-inflammatory drugs.
Antigen challenge in the sensitized Brown Norway rat elicited accumulations of eosinophils and neutrophils in lung tissue. Eosinophilia was slow in onset, but persisted until at least 72 h after challenge. It is well established that human asthma is characterized by chronic airways eosinophilia (Wardlaw, 1999), and the influx of these cells into the rat lung reflects the recruitment into the bronchial mucosa of asthmatics after an allergen provocation (Bentley et al., 1993). Eosinophils are implicated as key effector cells in asthmatic airways since they secrete cytotoxic proteins and lipid mediators that have the capacity to promote pathological changes believed to contribute to the decline in lung function (Martin et al., 1996). This hypothesis is supported by findings that the degree of asthmatic airways eosinophilia shows a positive correlation with the severity of clinical symptoms (Bentley et al., 1993). In contrast to eosinophilia, neutrophilia in the rat lung was rapid in onset but transient, suggesting recruitment induced by performed mediators but a short survival time in tissue or rapid clearance. However, eosinophil-selective inflammatory mechanisms in asthma normally result in a 50–100 fold increase in the number of eosinophils relative to neutrophils in the bronchial mucosa (Wardlaw, 1999).
Antigen challenge caused an initial, transient fall in the number of T cells (CD2+ or αβ-TCR+ cells) in rat lung tissue. The reason for this is unclear, but may have been due to migration of these cells out of the lung tissue compartment into the lymphatic system and then to draining lymph nodes. Subsequently, there was a progressive accumulation of T cells in the tissue. The accumulation of CD2+ cells appeared to be non-specific in that numbers of both CD4+ and CD8+ sub-populations followed very similar kinetics. However, the population of CD4+ cells outnumbered the CD8+ T cells by approximately 6–7 fold throughout. Our observation of T cell accumulation in the antigen-challenged rat lung is important, since the number of activated CD4+ T cells is increased in bronchial biopsies from asthmatic patients (Bentley et al., 1993). Findings that the number of these cells shows a positive correlation with the number of eosinophils in asthmatic airways have supported the hypothesis that type 2 cytokines secreted by activated CD4+ T cells are key orchestrators of the eosinophilia (Robinson et al., 1993a, b; Corrigan & Kay, 1996). Although a rigid adherence to the concept of Th1- and Th2-type CD4+ cells may be overly simplistic, the increased expression of IL-4, IL-5 and IL-13 genes in bronchial mucosa of human asthmatics (Kay, 1997; Humbert et al., 1997) is indeed consistent with a type 2 profile of cytokine gene expression by activated CD4+ T cells. R73 antibody partially depleted T cell numbers and was able to partially suppress antigen-induced airway eosinophilia providing further evidence that T cells do play a role in orchestrating eosinophilia in this model. This hypothesis is supported by our findings of increased gene expression for IL-5 and other putative T cell-derived cytokines in lung tissue of antigen-challenged rats.
We have previously demonstrated increased expression of the genes for IL-4 and IL-5 in lung tissue 24 h after antigen challenge in the Brown Norway rat (Underwood et al., 1997). Our present study allowed us to examine the time-courses of gene expression and determine whether early expression of genes for type 2 cytokines could have orchestrated the eosinophilia in our model, as hypothesized for human asthma. In our study, antigen challenge caused increased expression of genes for IL-4, IL-5 and IL-13 in rat lung tissue, but not the gene for the type 1 cytokine IFNγ. Levels of IL-4, IL-5 and IL-13 gene expression were first elevated 2 h and IL-13 protein expression 2–12 h after antigen challenge, preceding the onset of eosinophilia. Although changes in gene and protein expression occurred before any accumulation of CD4+ T cells in lung tissue, this does not negate a role for T cells since the genes could have been expressed by activated resident cells. Our data supports the hypothesis of a selective secretion of type 2 cytokines in this model, and provides evidence that early secretion of T cell-derived cytokines might contribute to the initiation of airways eosinophilia.
It should be emphasised that we have not yet confirmed the cellular source of the type 2 cytokine genes in the rat. There is evidence that IL-4 and IL-5 mRNA in human asthmatic airways are expressed predominantly by T cells. These are mainly of the CD4+ phenotype, although smaller numbers of CD8+ cytotoxic T (Tc) cells can also secrete type 2 cytokines (Kay et al., 1997). However, eosinophils and mast cells can also transcribe these genes and both these cell types show immunoreactivity for the corresponding proteins in asthmatic bronchial mucosa (Kay et al., 1997). Strong evidence to support a role for T cell-derived cytokines as promoters of airway eosinophilia also comes from animal models in which adoptive transfer of CD4+ T cells allows antigen-induced airways eosinophilia in otherwise antigen-naïve rats and mice (Haczku et al., 1997; Hogan et al., 1998) while antigen-induced eosinophilia is reduced in mice that are deficient in CD4+ T cells (Brusselle et al., 1994). Studies of IL-5 deficient mice and the effects of neutralising antibodies against IL-5 in rodent models have provided more evidence to support a key role for this cytokine, in particular as a mediator of allergic airways eosinophilia (Egan et al., 1999; Hamelmann & Gelfand, 1999). The effects of a monoclonal antibody to IL-5 in human asthmatics have now confirmed the pro-eosinophilic role of this cytokine in the human disease. A single intravenous dose of the antibody provided long-term suppression of allergen-induced sputum eosinophilia, although interestingly this protocol was not able to protect against the late asthmatic response or airway hyperreactivity (Leckie et al., 2000). Other mediators that promote eosinophil adhesion to the endothelium, chemotaxis and activation undoubtedly interact with IL-5 to promote eosinophil recruitment into human asthmatic airways and in animal models of allergic airway inflammation. Of particular interest are C-C chemokines such as eotaxin and RANTES that act on the CCR3 receptor on eosinophils and exhibit potent chemotactic activity for these cells (Bertrand & Ponath, 2000).
Our finding of rapid eotaxin gene expression in rat lung tissue and an elevated concentration of the secreted protein 6 h after antigen challenge suggests that this chemokine could also have contributed to eosinophilia in our model. In allergen-provoked human asthmatics, eotaxin expression similarly declines before eosinophil accumulation (Brown et al., 1998) while eotaxin secretion is associated with an early (6 h) recruitment of eosinophils in an allergen-induced cutaneous reaction in human atopic subjects (Ying et al., 1999). Together, these findings suggest that in the Brown Norway rat model, as in human asthma, eotaxin may contribute to early eosinophil accumulation, but other factors are implicated in the persistence of eosinophilia. Others have provided evidence that eotaxin might act synergistically with IL-5 to promote tissue eosinophilia in animal models (Collins et al., 1995). Both IL-4 and IL-13 induce eotaxin in mouse lungs (Li et al., 1999), suggesting that secretion of this protein in our study may have occurred as a secondary event to the earlier induction of IL-4 and IL-13 gene expression.
There is no doubt that allergic airway inflammation in both human asthma and animal models are regulated by numerous mutually interacting cytokines and other mediators. Other cytokines implicated in asthma pathogenesis include macrophage-derived TNFα and IL-1β, which both show elevated expression in clinical studies (Kips & Pauwels, 1996). We found that the concentrations of both mediators were similarly increased in rat lung following allergen challenge. TNFα and IL-1β demonstrate a range of activities that could potentially contribute to tissue eosinophilia, including the increased expression of adhesion molecules such as ICAM-1 and VCAM-1 that facilitate the extravasation of eosinophils and other leukocyte (Bjornsdottir & Cypcar, 1999). In addition, they stimulate eotaxin secretion by other inflammatory cell types (Chung et al., 1999). However, there is no consistent evidence for a role for these cytokines in animal models of allergic airways inflammation. For example, the inflammatory response is not impacted in mice deficient in TNF receptors or mice treated with a neutralizing antibody against TNF (Rudmann et al., 2000).
When this model was first described it was suggested that it provided a model of airway inflammation with profound eosinophilia that was associated with AHR (Elwood et al., 1991). However, on reviewing the relevant literature it would appear that the sensitivity to spasmogens (in this case ACh), is often small and variable between studies and not indicative of that in man (Haczku et al., 1995). In contrast, we found no evidence of AHR in response to two inhaled spasmogens in sensitized Brown Norway rats, after a single or multiple challenge, although a significant eosinophilia was observed in the BAL fluid of the same animals. The lack of AHR observed in this model may indicate why many workers are investigating the effects of novel therapeutics in murine models of AHR and may explain the reduced references to models of AHR in the Brown Norway rat found in the literature. Alternatively, methodological issues could have explained the results obtained such as differences in sensitisation protocols (e.g. whether an adjuvant has been used in addition to the ovalbumin solution), variation in the challenge protocol and the method of measurement of hyperresponsiveness (e.g. conscious versus anaesthetized animals). Furthermore, the hyperresponsiveness observed to bradykinin and acetylcholine may not be as great as to other spasmogens such as the leukotrienes. In fact, a recent paper has described a very impressive AHR to LTD4 after ovalbumin challenge (Allakhverdi et al., 2002).
We have demonstrated that antigen-induced eosinophilia in the Brown Norway rat is preceded by expression of genes for the type 2 cytokines IL-4, IL-5 and IL-13, but not the gene for the type 1 cytokine IFNγ. Our data is consistent with rapid expression of type 2 cytokines by resident cells including Th2-type cells and so provides evidence that early secretion of T cell-derived cytokines might contribute to the initiation of airways eosinophilia in this model. The eotaxin gene was also rapidly expressed suggesting that it may act synergistically with cytokines such as IL-5 to promote lung tissue eosinophilia. Gene expression for type 2 cytokines and eotaxin had returned to basal levels by 48 h after challenge, although eosinophil accumulation was maintained until after at least 72 h, suggesting that other mediators may drive the chronic phase of eosinophilia in this model. The lack of AHR demonstrated in this model is consistent with the theory that there is no direct association between the Th2 phenotype dependent eosinophilia and AHR. However, the authors would like to introduce a note of caution in that the absence of AHR may only relate specifically to the model employed in this manuscript and not the BN rat as a whole.
In conclusion, our increasing understanding of the Brown Norway rat model of allergic airways inflammation will allow us to investigate further the roles and interactions of T cells and eosinophils and the mediators that they secrete. Furthermore, if T cells and eosinophils are key players involved in the asthma phenotype this model may be used to evaluate novel approaches to asthma therapy.
Acknowledgments
M.A. Birrell, K. McCluskie and M.G. Belvisi are supported by the Harefield Research Foundation.
Abbreviations
- AHR
airway hyperreactivity
- AMV
avian myeloblastosis virus
- BAL
bronchoalveolar lavage
- ELISA
enzyme linked immuno sorbent assay
- FBS
foetal bovine serum
- FITC
fluorescein isothiocyanate
- GAPDH
glyceraldehyde-3-phosphate dehydrogenase
- ICAM-1
intercellular adhesion molecule-1
- RANTES
regulated-upon-activation normal T-cell expressed and secreted PE-fluorescence, phycoerythrin
- RPMI
Roswell Park Memoral Institute
- RT–PCR
reverse transcription–polymerase chain reaction
- Tc
cytotoxic T-cells
- Th1/2
T helper 1/2 cell
- TNF-α
tumour necrosis factor α
- VCAM-1
vascular cell adhesion molecule-1
References
- ALLAKHVERDI Z., ALLUM M., RENZI P.M. Inhibition of antigen-induced eosinophilia and airway hyperresponsiveness by antisense oligonucleotides directed against the common beta chain of IL-3, IL-5, GM-CSF receptor in a rat model of allergic asthma. Am. J. Respir. Crit. Care Med. 2002;165:1015–1021. doi: 10.1164/ajrccm.165.7.2109095. [DOI] [PubMed] [Google Scholar]
- BROWN J.R., KLEIMBERG J., MARINI M., SUN G., BELLINI A., MATTOLI S. Kinetics of eotaxin expression and its relationship to eosinophil accumulation and activation in bronchial biopsies and bronchoalveolar lavage (BAL) of asthmatic patients after allergen inhalation. Clin. Exp. Immunol. 1998;114:137–146. doi: 10.1046/j.1365-2249.1998.00688.x. [DOI] [PMC free article] [PubMed] [Google Scholar]
- BRUSSELLE G.G., KIPS J.C., TAVERNIER J.H., VAN DER HEYDEN J.G., CUVELIER C.A., PAUWELS R.A., BLUETHMANN H. Attenuation of allergic airway inflammation in IL-4 deficient mice. Clin. Exp. Allergy. 1994;24:73–80. doi: 10.1111/j.1365-2222.1994.tb00920.x. [DOI] [PubMed] [Google Scholar]
- BENTLEY A.M., MENG Q., ROBINSON D.S., HAMID Q., KAY A.B., DURHAM S.R. Increases in activated T lymphocytes, eosinophils, and cytokine mRNA expression for interleukin-5 and granulocyte/macrophage colony-stimulation factor in bronchial biopsies after allergen challenge in atopic asthmatics. Am. J. Respir. Cell Mol. Biol. 1993;8:35–42. doi: 10.1165/ajrcmb/8.1.35. [DOI] [PubMed] [Google Scholar]
- BERTRAND C.P., PONATH P.D. CCR3 blockade as a new therapy for asthma. Expert Opin. Investig. Drugs. 2000;9:43–52. doi: 10.1517/13543784.9.1.43. [DOI] [PubMed] [Google Scholar]
- BJORNSDOTTIR U.S., CYPCAR D.M. Asthma: an inflammatory mediator soup. Allergy. 1999;54:55–61. doi: 10.1111/j.1398-9995.1999.tb04389.x. [DOI] [PubMed] [Google Scholar]
- CHIBA Y., MISAWA M. Antigen-induced airway hyperresponsiveness is associated with airway tissue NEP hypoactivity in rats. Life Sci. 1994;55:1919–1928. doi: 10.1016/0024-3205(94)00524-9. [DOI] [PubMed] [Google Scholar]
- CHUNG K.F., PATEL H.J., FADLON E.J., ROUSSEL J., HADDAD E.B., JOSE P.J., MITCHELL J.A., BELVISI M.G. Induction of eotaxin expression and release from human airway smooth muscle cells by IL-1β and TNFα: effects of IL-10 and corticosteroids. Br. J. Pharmacol. 1999;127:1145–1150. doi: 10.1038/sj.bjp.0702660. [DOI] [PMC free article] [PubMed] [Google Scholar]
- COLLINS P.D., MARLEAU S., GRIFFITHS-JOHNSON D.A., JOSE P.J., WILLIAMS T.J. Cooperation between interleukin-5 and the chemokine eotaxin to induce eosinophil accumulation in vivo. J. Exp. Med. 1995;182:1169–1174. doi: 10.1084/jem.182.4.1169. [DOI] [PMC free article] [PubMed] [Google Scholar]
- CORRIGAN C.J., KAY A.B. T-cell/eosinophil interactions in the induction of asthma. Eur. Respir. J. 1996;22 Suppl:72s–78s. [PubMed] [Google Scholar]
- EGAN R.W., ATHWAL D., BODMER M.W., CARTER J.M., CHAPMAN R.W., CHOU C.C., COX M.A., EMTAGE J.S., FERNANDEZ X., GENATT N., INDELICATO S.R., JENH C.H., KREUTNER W., KUNG T.T., MAUSER P.J., MINNICOZZI M., MURGOLD N.J., NARULA S.K., PETRO M.E., SCHILLING A., SEHRING S., STELTS D., STEPHENS S., TAREMI S.S., ZURCHER J. Effect of Sch 55700, a humanized monoclonal antibody to human interleukin-5, on eosinophilic responses and bronchial hyperreactivity. Arzneimittelforschung. 1999;49:779–790. doi: 10.1055/s-0031-1300502. [DOI] [PubMed] [Google Scholar]
- ELWOOD W., LOTVALL J.O., BARNES P.J., CHUNG K.F. Characterization of allergen-induced bronchial hyperresponsiveness and airway inflammation in actively sensitized Brown Norway rats. J. Allergy Clin. Immunol. 1991;88:951–960. doi: 10.1016/0091-6749(91)90253-k. [DOI] [PubMed] [Google Scholar]
- GARLISI C.G., FALCONE A., HEY J.A., PASTER T.M., FERNANDEZ X., RIZZO C.A., MINNICOZZI M., JONES H., BILLAH M.M., EGAN R.W., UMLAND S.P. Airway eosinophils, T cells, Th2-type cytokine mRNA, and hyperreactivity in response to aerosol challenge of allergic mice with previously established pulmonary inflammation. Am. J. Respir. Cell Mol. Biol. 1997;17:642–651. doi: 10.1165/ajrcmb.17.5.2866. [DOI] [PubMed] [Google Scholar]
- HACZKU A., CHUNG K.F., SUN J., PARNES P.J., KAY A.B., MOQBEL R. Airway hyperresponsiveness, elevation of serum-specific IgE and activation of T cells following allergen exposure in sensitized Brown-Norway rats. Immunology. 1995;85:598–603. [PMC free article] [PubMed] [Google Scholar]
- HACZKU A., MACARY P., HUANG T.J., TSUKAGOSHI H., BARNES P.J., KAY A.B., KEMENY D.M., CHUNG K.F., MOQBEL R. Adoptive transfer of allergen-specific CD4+ T cells induces airway inflammation and hyperresponsiveness in Brown Norway rats. Immunology. 1997;91:176–185. doi: 10.1046/j.1365-2567.1997.d01-2221.x. [DOI] [PMC free article] [PubMed] [Google Scholar]
- HADDAD E.-B., UNDERWOOD S.L., DABROWSKI D., BIRRELL M.A., MCCLUSKIE K., BATTRAM C.H., PECORARO M., FOSTER M.L., BELVISI M.G. Critical role for T cells in Sephadex-induced airway inflammation: pharmacological and immunological characterization and biomarker identification. J. Immunol. 2002;168:3004–3016. doi: 10.4049/jimmunol.168.6.3004. [DOI] [PubMed] [Google Scholar]
- HAMELMANN E., GELFAND E.W. Role of IL-5 in the development of allergen-induced airway hyperresponsiveness. Int. Arch. Allergy Immunol. 1999;120:8–16. doi: 10.1159/000024215. [DOI] [PubMed] [Google Scholar]
- HOGAN S.P., KOSKINEN A., MATTHAEI K.I., YOUNG I.G., FOSTER P.S. Interleukin-5-producing CD4+ T cells play a pivotal role in aeroallergen-induced eosinophilia, bronchial hyperreactivity, and lung damage in mice. Am. J. Respir. Crit. Care Med. 1998;157:210–218. doi: 10.1164/ajrccm.157.6.mar-1. [DOI] [PubMed] [Google Scholar]
- HUANG T.J., HADDAD E.-B., FOX A., SALMON M., JONES C., BURGESS G., CHUNG K.F. Contribution of Bradykinin B1 and B2 receptors in allergen-induced bronchial hyperresponsiveness. Am. J. Respir. Crit. Care Med. 1999;160:1717–1723. doi: 10.1164/ajrccm.160.5.9901029. [DOI] [PubMed] [Google Scholar]
- HUMBERT M., DURHAM S.R., KIMMITT P., POWELL N., ASSOUFI B., PFISTER R., MENZ G., KAY A.B., CORRIGAN C.J. Elevated expression of messenger ribonucleic acid encoding IL-13 in the bronchial mucosa of atopic and nonatopic subjects with asthma. J. Allergy Clin. Immunol. 1997;99:657–665. doi: 10.1016/s0091-6749(97)70028-9. [DOI] [PubMed] [Google Scholar]
- KAY A.B. T cells as orchestrators of the asthmatic response. Ciba Found. Symp. 1997;206:56–67. [PubMed] [Google Scholar]
- KAY A.B., BARATA L., MENG Q., DURHAM S.R., YING S. Eosinophils and eosinophil-associated cytokines in allergic inflammation. Int. Arch. Allergy Immunol. 1997;113:196–199. doi: 10.1159/000237545. [DOI] [PubMed] [Google Scholar]
- KIPS J.C., PAUWELS R.A. Are cytokines responsible for the asthmatic state of the airways. Monaldi Arch. Chest Dis. 1996;51:223–227. [PubMed] [Google Scholar]
- KON O.M., KAY A.B. T cells and chronic asthma. Int. Arch. Allergy Immunol. 1999;118:133–135. doi: 10.1159/000024049. [DOI] [PubMed] [Google Scholar]
- LABERGE S., ROSSI P., YANG X.X., MARTIN J.G. Antigen-induced airway inflammationand hyper-responsiveness does not enhance airway responses to a subsequent antigen challenge in rats. Respir. Med. 2000;94:44–50. doi: 10.1053/rmed.1999.0713. [DOI] [PubMed] [Google Scholar]
- LECKIE M.J., TEN BRINKE A., KHAN J., DIAMANT Z., O'CONNOR B.J., WALLS C.M., MATHUR A.K., COWLEY H.C., CHUNG K.F., DJUKANOVIC R., HANSEL T.T., HOLGATE S.T., STERK P.J., BARNES P.J. Effects of an interleukin-5 blocking monoclonal antibody on eosinophils, airway hyper-responsiveness, and the late asthmatic response. Lancet. 2000;356:2144–2148. doi: 10.1016/s0140-6736(00)03496-6. [DOI] [PubMed] [Google Scholar]
- LI L., XIA Y., NGUYEN A., LAI Y.H., FENG L., MOSMANN T.R., LO D. Effects of Th2 cytokines on chemokine expression in the lung: IL-13 potently induces eotaxin expression by airway epithelial cells. J. Immunol. 1999;162:2477–2487. [PubMed] [Google Scholar]
- MARTIN L.B., KITA H., LEIFERMAN K.M., GLEICH G.J. Eosinophils in allergy: role in disease, degranulation and cytokines. Int. Arch. Allergy Immunol. 1996;109:207–215. doi: 10.1159/000237239. [DOI] [PubMed] [Google Scholar]
- ROBINSON D.S., BENTLEY A.M., HARTNELL A., KAY A.B., DURHAM S.R. Activated memory T helper cells in bronchoalveolar lavage fluid from patients with atopic asthma: relation to asthma symptoms, lung function, and bronchial responsiveness. Thorax. 1993a;48:26–32. doi: 10.1136/thx.48.1.26. [DOI] [PMC free article] [PubMed] [Google Scholar]
- ROBINSON D., HAMID Q., BENTLEY A., YING S., KAY A.B., DURHAM S.R. Activation of CD4+ T cells, increased TH2-type cytokine mRNA expression, and eosinophil recruitment in bronchoalveolar lavage after allergen inhalation challenge in patients with atopic asthma. J. Allergy Clin. Immunol. 1993b;92:313–324. doi: 10.1016/0091-6749(93)90175-f. [DOI] [PubMed] [Google Scholar]
- RUDMANN D.G., MOORE M.W., TEPPER J.S., ALDRICH M.C., PFEIFFER J.W., HOGENESCH H., TUMAS D.B. Modulation of allergic inflammation in mice deficient in TNF receptors. Am. J. Physiol. Lung Cell Mol. Physiol. 2000;279:L1047–L1057. doi: 10.1152/ajplung.2000.279.6.L1047. [DOI] [PubMed] [Google Scholar]
- UNDERWOOD S.L., RAEBURN D., LAWRENCE C., FOSTER M., WEBBER S., KARLSSON J.A. RPR 106541, a novel, airways-selective glucocorticoid: effects against antigen-induced CD4+ T lymphocyte accumulation and cytokine gene expression in the Brown Norway rat lung. Br. J. Pharmacol. 1997;122:439–446. doi: 10.1038/sj.bjp.0701398. [DOI] [PMC free article] [PubMed] [Google Scholar]
- WARDLAW A.J. Molecular basis for selective eosinophil trafficking in asthma: A multistep paradigm. J. Allergy Clin. Immunol. 1999;104:917–926. doi: 10.1016/s0091-6749(99)70069-2. [DOI] [PubMed] [Google Scholar]
- YING S., MENG Q., ZEIBECOGLOU K., ROBINSON D.S., MACFARLANE A., HUMBERT M., KAY A.B. Eosinophil chemotactic chemokines (eotaxin, eotaxin-2, RANTES, monocyte chemoattractant protein-3 (MCP-3), and MCP-4), and C-C chemokine receptor 3 expression in bronchial biopsies from atopic and nonatopic (Intrinsic) asthmatics. J. Immunol. 1999;163:6321–6329. [PubMed] [Google Scholar]
- YOSHINO S., CLELAND L.G., MAYRHOFER G., BROWN R.R., SCHWAB J.H. Prevention of chronic erosive streptococcal cell wall-induced arthritis in rats by treatment with a monoclonal antibody against the T cell antigen receptor alpha beta. J. Immunol. 1991;146:4187–4189. [PubMed] [Google Scholar]