

Abstract
Asthma research is arguably limited by an absence of appropriate animal models to study the pharmacology of inflammatory mediators that affect airway hyperresponsiveness and remodelling. Here we assessed an assay based on mouse tracheal segments cultured for 1–32 days, and investigated contractile responses mediated by muscarinic and 5-hydroxytryptamine (5-HT) receptors following long-term exposure to tumour necrosis factor-alpha (TNFα).
Following culture, in the absence of TNFα, maximum contractile responses to KCl and carbachol were similar, with an increase in response up to day two and a decrease to a stable level after 8 days. Maximal relaxations to isoprenaline were not affected by the culture procedure. The potency of KCl and isoprenaline increased throughout the study. DNA microarray data revealed that global gene expression changes were greater when tissues were introduced to culture than when they were maintained in culture. The morphology of smooth muscle cells was maintained throughout the culture period.
5-HT induced a weak contraction in both fresh and cultured (up to 8 days) segments. Culture with TNFα produced a time- and concentration-dependent increase in the maximal contraction to 5-HT, evidently mediated by 5-HT2A receptors, whereas, the potency for carbachol was reduced.
In conclusion, the phenotype of airway smooth muscle remained largely intact during the culture period, even though minor changes were obtained during the first days of culture. The time-dependent effect of TNFα indicates the importance of studying the long-term effect of cytokines on the smooth muscle cells in relation to airway hyperresponsiveness and remodelling.
Keywords: 5-HT2A receptors, airway hyperresponsiveness, airway remodelling, asthma, contractile phenotype, DNA microarray, organ culture, tracheal segments, tumour necrosis factor-alpha
Introduction
Chronic inflammation is recognized as a primary factor in the development of asthma, and its role in the induction of both the hyperresponsiveness and the remodelling of the airways has recently been emphasised (Bousquet et al., 2000; Schmidt & Rabe, 2000). The inflammatory response is associated with an accumulation of eosinophils, lymphocytes, activated macrophages, mast cells and neutrophils, and all of these inflammatory cells have the capacity to release mediators that can affect the structural cells of the airways.
One of the most important cell types involved in pathology of the airway is the smooth muscle cell. Smooth muscle cells are extremely plastic, and are found in the normal airway as a heterogeneous mixture of different morphological and mechanical phenotypes (Ma et al., 1997). A potentially important feature of smooth muscle cells is their ability to alter their phenotype in response to different stimuli (Hirst et al., 2000). This cell type is implicated in the development of asthma for two reasons. Firstly, it is an effector of contractile stimuli, and secondly, due to hyperplasia and/or hypertrophy, it is responsible for the increase of airway wall mass (Wills-Karp, 1997).
It has recently been reported that tumour necrosis factor-alpha (TNFα) is secreted from inflammatory cells (Gosset et al., 1999), and is found in asthmatic patient lavage fluids (Tonnel et al., 2001). In addition, one common cause of asthmatic exacerbations is respiratory viral infection (Jacoby, 2002), which causes a secretion of TNFα (Terajima et al., 1997). Short-term exposure (not more than 24 h) to TNFα directly affects airway smooth muscle cells by impairing β-adrenoceptor-mediated relaxation of isolated guinea-pig (Wills-Karp et al., 1993) and rabbit (Hakonarson et al., 1996) airways, and increasing calcium release and inositol turn-over in cultured cells in response to thrombin and bradykinin (Amrani et al., 1997). However, since the altered properties of asthma patient smooth muscle are thought to be due to long-term pathological processes, further experiments investigating the long-term influences of cytokines, such as TNFα, seem necessary.
Assays currently used to study airway remodelling are limited (Szelenyi, 2000). Due to the complexity of in-vivo models, it has been difficult to assess the specific long-term effects of inflammatory mediators (Rytila et al., 2000). To simplify studies, in-vitro assays of isolated smooth muscle strips or cells have been utilized, although increases in analytical power are gained at the expense of not being able to study patho/physiologically relevant long-term effects. Therefore, we set out to develop a model that could retain the analytical advantages of the isolated tissue assays but also allow continuous investigation of chronic/long-term events. Specifically, the model should facilitate the study of changes in pharmacological reactivity, gene expression and morphology during sequential and simultaneous exposure to different inflammatory mediators. To this end, a model was developed based on the organ culture of tracheal segments. The mouse was used due to the large amount of genetic and immunological data available for this species. The aim was to develop a method that would allow investigation for 3–4 weeks, the length of time reported to be required for the induction of both airway hyperresponsiveness and remodelling in murine models of antigen-induced inflammation (Szelenyi, 2000).
Following the development of a suitable model, the link between long-term inflammation and phenotypic changes to airway smooth muscle was investigated. This was achieved by culturing mouse tracheal segments for different time periods in the absence and presence of TNFα, and subsequently by investigating the pharmacological responses to the muscarinic receptor agonist, carbachol, and 5-hydroxytryptamine (5-HT).
Methods
Tissue preparation and organ culture
9–10-week-old male BALB/cJ mice were killed by cervical dislocation. Whole tracheae were rapidly removed and placed into Dulbecco's Modified Eagle's Medium (DMEM; 4500 mg l−1 D-glucose, 110 mg l−1 sodium pyruvate, 584 mg l−1 L-glutamine), supplemented with 100 U ml−1 penicillin and 100 μg ml−1 streptomycin. Individual trachea were thereafter dissected free from adherent tissue under sterile conditions and either divided into three or four segments, each with three cartilage rings for pharmacological investigations, or were used for total RNA preparation. The tracheal tissues were used directly after dissection (fresh) or placed individually in DMEM for organ culture (1 ml and 10 ml for functional investigations and total RNA preparation, respectively). To control for variation in the pharmacological behaviour or gene expression associated with any regional differences along the length of the trachea, segments were allocated randomly to each procedure and treatment group. Under culture conditions the tracheal tissues were incubated at 37°C in humidified 5% CO2 in air for 1, 2, 4, 8, 16 and 32 days (1, 4, and 16 days for total RNA and histological preparation). Fresh DMEM was added to tissues every fourth day. Culture with TNFα (1, 10 or 100 ng ml−1) was performed in 96-well plates (Ultra-low attachment; Sigma, St. Louis, MO, U.S.A.) with 300 μl DMEM for 1, 4 and 8 days. Segments were moved into a new well containing fresh media every day. For microarray analysis, epithelial cells were removed from each trachea. This was achieved by cutting open the trachea and scraping the lumenal surface with a scalpel. Preparations were then immediately frozen in liquid nitrogen and stored at −70°C until RNA preparation.
Isometric force measurement
Tracheal smooth muscle reactivity was analysed in temperature-controlled (37°C) myographs (Organ Bath Model 700MO, J.P. Trading, Aarhus, Denmark) containing Krebs-Henseleit buffer solution composed of (mM) Na+ 143, K+ 5.9, Ca2+ 1.5, Mg2+ 2.5, Cl− 128, H2PO42− 1.2, SO42− 1.2, HCO3− 25 and D-glucose 10. The solution was continuously equilibrated with 5% CO2 and 95% O2 resulting in a pH of 7.4. The tracheal segments were mounted on two L-shaped metal prongs. One prong was connected to a force-displacement transducer for continuous recording of isometric tension by the Chart software (AD Instruments Ltd, Hastings, U.K.). The other prong was connected to a displacement device, allowing adjustment of the distance between the two parallel prongs.
Estimation of optimal tension load
In order to estimate the optimal tension load for the tracheal segments, experiments were conducted to measure the contraction to 60 mM KCl at increasing levels of basal tension. Initially, fresh or cultured tracheal segments were allowed to equilibrate for one hour without tension. Segments were mounted and loaded with an initial tension of ∼0.2 mN. After a further 15 min period of equilibration, 60 mM KCl was applied to induce contraction. When this contraction had reached a maximal level (after ∼15 min), segments were washed twice with buffer solution and subsequently left to rest for a further 15 min. This procedure was repeated until the increase in basal tension did not cause an increase in contraction. No further experiments were conducted on these segments.
In vitro pharmacology
After 1 h equilibration at the optimal tension (see Results), the contractile capacity of each tissue segment was tested by exposure to 60 mM KCl. Following a 30 min resting period, agonist concentration-effect curves were obtained on each segment by cumulative dosing. To provide a second measure of receptor-mediated contractility, 1 μM endothelin-1 was administrated following completion of the carbachol concentration-effect curve. The relaxatory effect of isoprenaline was studied in separate experiments. Segments were pre-contracted using a concentration of carbachol that induced a stable (75% of the maximum) contraction. Subsequently, concentration-effect curves to isoprenaline were obtained also by cumulative dosing. To ensure that tissues had the capacity to relax to baseline levels in response to cAMP, 30 μM forskolin was added after completion of the isoprenaline concentration-effect curves.
Pharmacological characterization of the 5-HT receptor responses was performed using three agonists with different receptor subtype selectivity (Hoyer et al., 1994): 5-carboxamidotryptamine (5-CT), 8-hydroxy-2-2(di-n-propylamino)-tetralin (8-OH-DPAT) and α-methyl-5-hydroxytryptamine (α-methyl-5-HT). In experiments using the different receptor antagonists ketanserin and atropine, antagonists were present 30 min before the cumulative application of agonists. In addition, the contractile effect of TNFα was tested in fresh segments.
Analysis
All data were expressed as mean values±s.e.mean. Contractile responses to carbachol were expressed in mN, and since this agonist induces contraction close to the maximal capacity of the tissue irrespective of organ culture duration, responses to 5-HT were expressed both as a percentage of the maximal contraction to carbachol and in mN. Agonist concentration-effect curve data from individual tissues were fitted to the Hill equation using an iterative, least square method (GraphPad Prism, San Diego, U.S.A.), to provide estimates of maximal contraction (α), midpoint location (p[A]50) and Hill coefficient (nH). In some cases, concentration-effect curves were not fully defined and could not be fitted to the Hill equation. In those cases, the maximum contraction was estimated as the mean value that induced the highest response, and the p[A]50 value was estimated by linear regression analysis of the data obtained at agonist concentrations on the pseudo-linear region of the concentration-effect curve. Statistical analysis was performed using one-way analysis of variance (ANOVA), and if the null hypothesis was rejected (P<0.05), Dunnett's post-test was performed and, for the initial experiments, the linear trend test was used.
The pKB value for ketanserin was estimated by fitting the individual log[A]50 values obtained in the absence (log[A]50) and presence (log[A]50B) of antagonist concentrations [B] to the following derivation of the Schild equation, as described previously (Black et al., 1985).
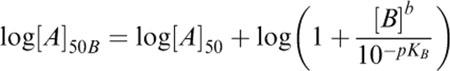 |
In the first fit, the Schild slope parameter (b) was allowed to vary. If the value of b was found not to be significantly different from unity, a second fit was performed with b constrained to unity.
RNA preparation and DNA microarray analysis
The total RNA from mouse tracheae (fresh or after culture for 1, 4 or 16 days) was isolated using TRIzol reagent (Life Technologies, Gaithersburg, MD, U.S.A.) as recommended by the supplier. Frozen tissue samples were homogenized in TRIzol, and RNA was precipitated with isopropanol, washed with 75% ethanol and finally re-suspended in 20 μl water. The quality and quantity of the RNA was evaluated using UV-spectrophotometry. Total RNA samples were prepared in duplicate for each time point with pooled tissue from six mice (∼10 μg total RNA for each pool) being used to generate RNA for each sample. Microarray analysis was performed essentially as described previously (Simmen et al., 2001). In brief, RNA was reverse transcribed with a T7 promoter oligo (dT) primer, and then linearly amplified using T7 RNA polymerase. Cy3-dCTP-labelled fluorescent cDNA probes were synthesized from the amplified RNA, and RNA templates then degraded using RNaseA. The cDNAs printed on the three different microarrays used in the study were obtained from Research Genetics (Huntsville, AL, U.S.A.), Incyte Genomics (Santa Clara, CA, U.S.A.), ATCC (Manassas, VA, U.S.A.), or were cloned by Johnson and Johnson PRD. A total of 11309 cDNAs were printed on the three microarrays, >95% of which were sequence verified.
Purified cDNA probes were hybridized to two microarrays, each containing two spots for each cDNA. The spot intensities of each microarray were normalized so that the 75th percentile of expression levels was equal across microarrays. The level of gene expression was taken as the mean of the four spots. For the microarrays used in this study, the mean coefficient of variance (CV) of the four spots was 11.8%. The background intensity of microarrays was defined as the median plant gene hybridization intensity. This minimum intensity was assigned to any gene with gene expression below this level. To limit the large range of gene expression levels, data were transformed to logarithmic base 10 values. Scatter plot analysis was used to compare normalized gene expression levels in different samples, and the correlation coefficient (R2) was calculated to assess the correlation between samples. To compare the change in expression levels between the different days in culture, the mean gene expression level of replicate samples was calculated (replicate values were excluded from this calculation if replicate CV was >50%). The change in expression level of a particular gene was calculated by subtracting the level measured at one time period from the level detected at another time period. This value was expressed in absolute terms (i.e. both negative and positive values were made positive), and compared statistically using the Wilcoxon signed-rank test. This test was used because data were not normally distributed (i.e. non-Gaussian), as determined using the Chi-squared test (data not shown).
Light microscopy
Fresh segments and segments cultured for 1, 4 and 16 days were fixed in formalin and paraffin embedded. Sections were prepared, haematoxylin-eosin stained and examined by light microscopy. Analysis assessed cellular and structural changes in the smooth muscle cell layer of the tissue. Trypan blue staining (0.4%) was used after culture to assess cell viability.
Materials
Dulbecco's Modified Eagle's Medium, carbachol, isoprenaline, forskolin, 5-hydroxytryptamin, 5-carboxamidotryptamine, 8-hydroxy-2-2(di-n-propylamino)-tetralin and α-methyl-5-hydroxytryptamine, ketanserin and atropine were obtained from Sigma (St. Louis, MO, U.S.A.), penicillin and streptomycin were obtained from Life Technologies (Gathisburg, MD, U.S.A.), endothelin-1 was obtained from Neosystem (Strasbourg, France) and recombinant murine tumour necrosis factor α was obtained from R&D Systems (Abingdon, U.K.).
Results
Estimation of optimal basal tension level
In order to estimate the optimal basal tension level for contractile studies on mouse tracheal segments following organ culture, segments were initially loaded with a tension of approximately 0.2 mN. Tension was increased in a step-wise fashion until a clear decrease in contraction was obtained (at ∼3 mN). At each level of tension, the segments were exposed to 60 mM KCl to induce a contraction. Maximal contraction occurred within 15 min. The basal tension that gave the strongest KCl contraction was not significantly different between fresh and cultured segments (Figure 1; mean range 0.69–0.93 mN; ANOVA P=0.69). Subsequent experiments were performed with a basal tension of approximately 0.8 mN. At this tension the strength of the contraction to 60 mM KCl was significantly greater in segments cultured for 1 day than in fresh segments (Figure 1). The strength of the KCl contraction decreased in segments cultured for more than 1 day, to reach a stable level after 16 days of culture.
Figure 1.
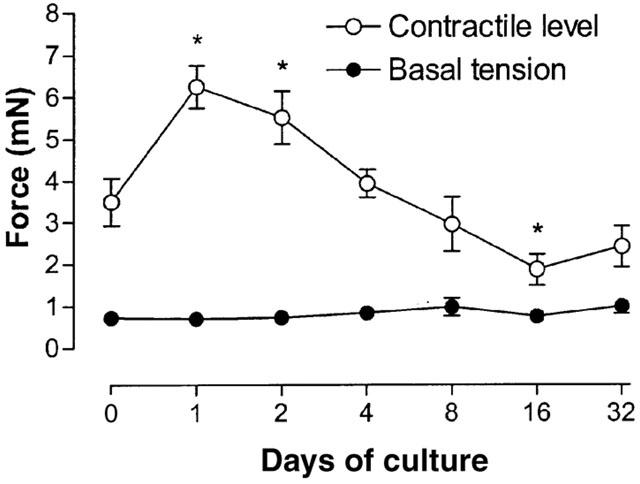
Estimation of optimal basal tension level by exposure to 60 mM KCl for mouse tracheal segments, fresh and cultured for 1, 2, 4, 8, 16 and 32 days. The basal tension represents the tension applied to segments at which the strongest KCl-induced contraction occurred. Each point represents the mean of all segments tested with error bars representing s.e.mean (n=8).
KCl induced contraction
KCl induced a concentration-dependent contraction in all mouse tracheal segments (Table 1; Figure 2). The upper asymptote of the concentration-effect increased with time for the first 2 days of culture. In segments cultured for more than 2 days, the upper asymptote decreased to reach a stable level at approximately 2 mN after 8 days of culture (∼40% of the contraction in fresh segments). The pattern of change of the KCl induced contraction with respect to culture time was similar to the pattern observed in the tension experiments described above. The potency of KCl increased gradually during the culture period by a small amount (1.3 fold).
Table 1.
Analysis of KCl and carbachol induced contractions and isoprenaline induced relaxations in isolated mouse trachea, fresh and cultured for 1, 2, 4, 16 and 32 days
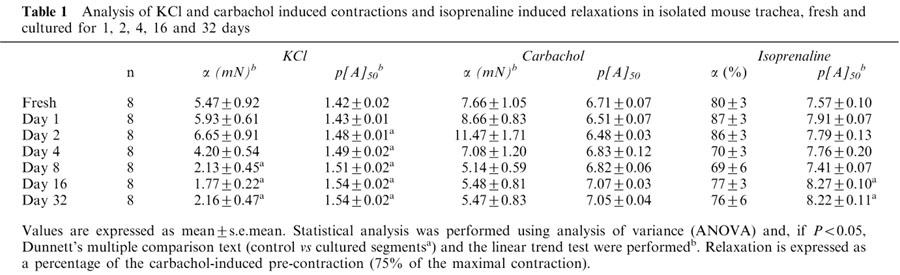
Figure 2.
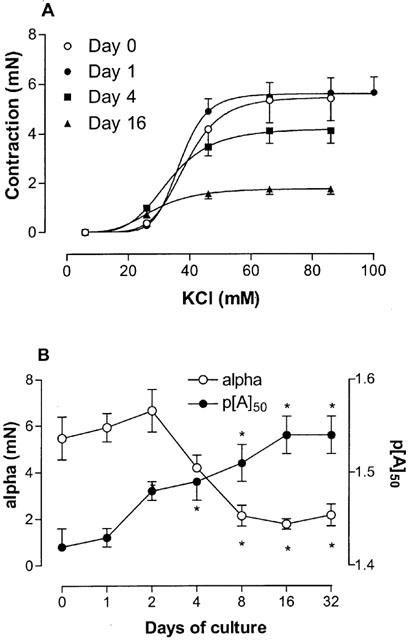
KCl induced contraction. (A) Concentration-effect curves of KCl obtained on fresh and cultured mouse tracheal segments. Tissues were cultured for 1, 2, 4, 8, 16 and 32 days, although data only relating to segments cultured for 0, 1, 4, and 16 days are shown for clarity. (B) Compiled data for the maximum effect (alpha) and the potency (p[A]50) for all the different days of culture. *P<0.05 between cultured and fresh segments. Each point represents the mean of all segments tested with error bars representing s.e.mean (n=6–8).
Carbachol induced contraction
The muscarinic receptor agonist carbachol induced a concentration-dependent contraction in all segments (Table 1; Figure 3). Contractions were sometimes biphasic with an initial transient peak followed by a response that developed slowly to reach a stable plateau. Biphasic responses were independent of the culture period. Analysis was performed using the maximum contraction level regardless of whether this was obtained at the initial peak or at the subsequent plateau response. The level of the upper asymptote followed a similar pattern to the KCl-induced contraction data. It gradually increased for the first two days of culture, and then decreased to a stable level (∼5 mN; ∼67% of the contraction in fresh segments) in segments cultured for 8 or more days. The potency for carbachol was not significantly altered following the culture procedure.
Figure 3.
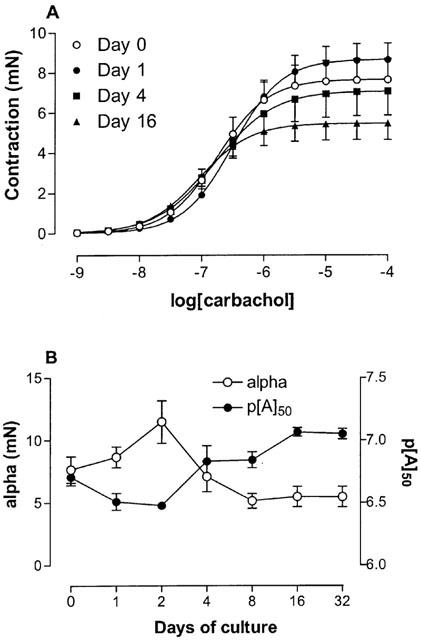
Carbachol induced contraction. (A) Concentration-effect curves to carbachol obtained on fresh and cultured mouse tracheal segments. Tissues were cultured for 1, 2, 4, 8, 16 and 32 days, although data only relating to segments cultured for 0, 1, 4, and 16 days are shown for clarity. (B) Compiled data for the maximum effect (alpha) and the potency (p[A]50) for all the different days of culture. *P<0.05 between cultured and fresh segments. Each point represents the mean of all segments tested with error bars representing s.e.mean (n=6–8).
Administration of 1 μM endothelin-1 following the carbachol contraction did not cause further contraction in any of the experiments (data not shown).
Isoprenaline induced relaxation
A sustained contraction was obtained using the concentration of carbachol that was estimated to induce 75% of the maximal contraction. Subsequently, the β-adrenoceptor agonist isoprenaline induced a concentration-dependent relaxation in all segments of the mouse trachea (Table 1; Figure 4). No significant alterations to the isoprenaline-induced curve asymptote were observed as a result of culturing segments. However, the potency of isoprenaline was increased ∼5 fold after segments were cultured for 16 days. Following the isoprenaline concentration-effect curve, 30 μM forskolin was added to segments. It was found that increasing levels of cAMP in this way could relax tissues to baseline levels regardless of the culture period.
Figure 4.
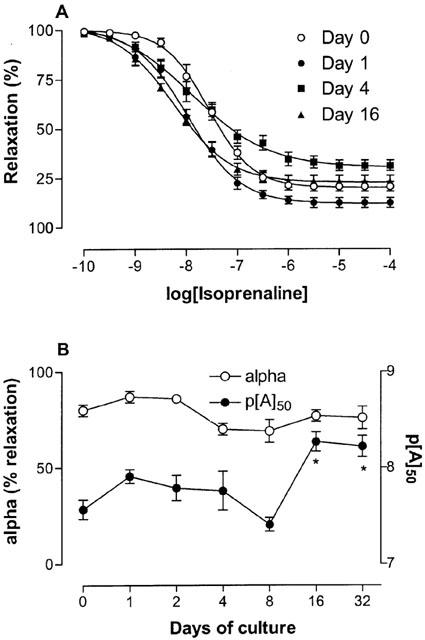
Isoprenaline induced relaxation. (A) Concentration-effect curves to isoprenaline obtained on fresh and cultured mouse tracheal segments, following pre-contraction with carbachol (75% of maximal contraction). Tissues were cultured for 1, 2, 4, 8, 16 and 32 days, although data only relating to segments cultured for 0, 1, 4, and 16 days are shown for clarity. (B) Compiled data for the maximum effect (alpha) and the potency (p[A]50) for all the different days of culture. *P<0.05 between cultured and fresh segments. Each point represents the mean of all segments tested with error bars representing s.e.mean (n=7–8).
DNA microarray analysis
To investigate global changes in gene expression upon placing tracheal segments in culture, RNA was extracted from tissues, amplified, labelled and hybridized to three different microarrays printed with mouse cDNAs. Scatter plot analysis indicated that the normalized gene expression level for replicate samples was highly correlated (Figure 5). This illustrates the reproducibility of the DNA microarrays used in this study. The mean correlation coefficient (R2) for the four replicate samples hybridized to the three microarrays was >0.98. A higher degree of correlation was obtained when data from the different culture periods (D1, D4 and D16; Figure 1) were compared, than when data from any of the culture periods were compared to fresh tissue data (D0). This suggests that the differences in expression levels were greater between the fresh and cultured replicates than between any of the cultured replicates.
Figure 5.
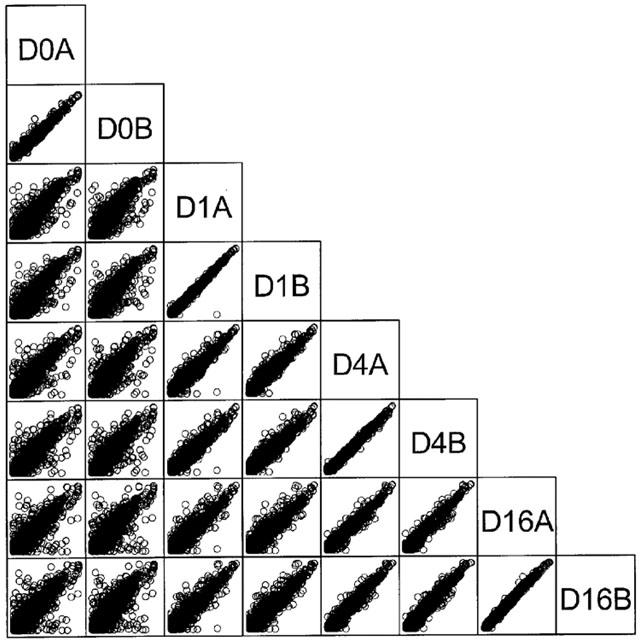
Microarray analysis. Representative scatter plots showing all data from one of the three DNA microarrays used in this study. Fresh tissue (D0) and tissue cultured for 1 (D1), 4 (D4) and 16 (D16) days, replicates A and B are plotted (each replicate contained RNA pooled from six mice). Logarithmically (base 10) transformed data illustrate the correlation between normalized gene expression levels for replicate samples. The mean R2 for the gene expression level of the four replicate samples was 0.99 for this microarray.
To compare the relative change in global gene expression levels between the different days in culture, the absolute change in normalized expression levels were calculated. Statistical analysis using the Wilcoxon signed-rank test confirmed the trends observed in Figure 5. The absolute change in global expression between fresh tissue and tissue cultured for 1 day (D0–D1) was significantly greater than the change observed between tissue cultured for 1 day and 4 (D1–D4) or 16 (D1–D16) days (P<0.0001 for both comparisons). These results indicate that global gene expression levels change more when tracheal segments are placed in culture than when they are maintained in culture. The change in expression between tissue cultured for 1 day and 4 days (D1–D4) was also significantly greater than the change observed between tissue cultured for 4 and 16 days (D4–D16; P<0.0001). This result indicates that global gene expression levels change more during the first few days of culture than over later time periods. The data presented above were also supported by the observation that 5.8% of the genes changed ⩾2 fold between day 0 and day 1, in comparison to 1.6% between day 1 and day 4, and 0.8% between day 4 and day 16.
Light microscopy
In all tracheal segments (fresh or cultured for 1, 4 or 16 days), the smooth muscle layer was intact and distinct from adjacent cell layers (Figure 6). Smooth muscle cells were longitudinally oriented in all sections, and the size of the smooth muscle cells and their nuclei did not differ between the groups. Vacuoles were not visible in any of the preparations, and absence of trypan blue staining after culture indicated that no cell death had occurred. The epithelial cell layer was intact in sections, although occasionally, due to the fixation/cutting process, it had become separated from the smooth muscle and cartilage layers. Following culture for 4 and 16 days, there appeared to be a metaplasia of the epithelium with the appearance of cuboidal squamous epithelial cells.
Figure 6.
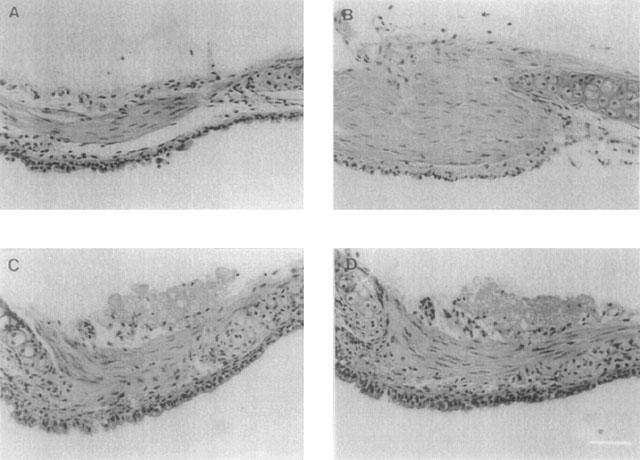
Light microscopy. Fresh segments (A) and segments cultured for 1 (B), 4 (C) and 16 (D) days were fixed in formalin and paraffin embedded. Sections were prepared, haematoxylin-eosin stained and examined by light microscopy. Bar=40 μm.
The data presented above indicated that the phenotype of tracheal segments remained intact during extended periods of culture, albeit with minor changes observed during the first days of culture. Thus, the assay could be used to evaluate the long-term effects of inflammatory mediators on smooth muscle, providing a useful tool in the exploration of the pathogenesis of asthma. As TNFα has been implicated in the development of asthma, we decided to evaluate this inflammatory mediator using the assay.
Contractile effect of 5-HT, carbachol and TNFα in fresh tracheal segments
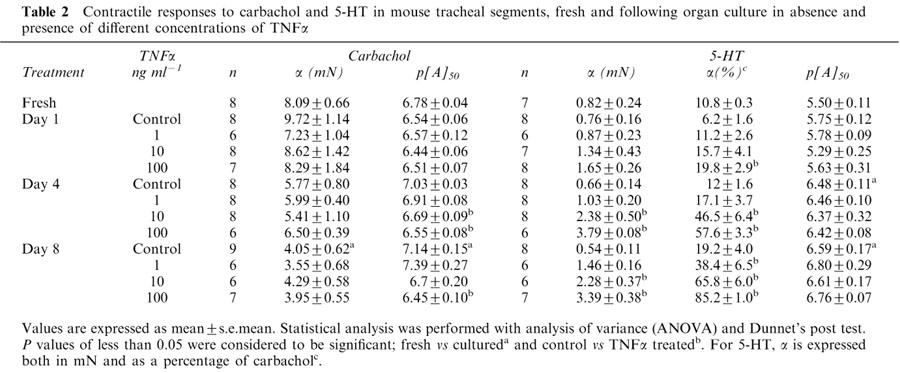
Prior to evaluating cultured tissue, the contractile activity of fresh isolated mouse tracheal segments (day 0) in response to the different agonists, 5-HT and carbachol, and TNFα was assessed. 5-HT produced a small maximal contraction compared to carbachol with a 13 fold lower potency (Table 2). As obtained in earlier investigations in airway smooth muscle (Nakatani et al., 2000), no contraction was elicited by TNFα (1–100 ng ml−1; data not shown).
Table 2.
Contractile responses to carbachol and 5-HT in mouse tracheal segments, fresh and following organ culture in absence and presence of different concentrations of TNFα
Contractile effects of carbachol following organ culture in the absence and presence of TNFα
Fully-defined concentration-effect curves were obtained using the agonist carbachol for all treatment groups, with segments cultured for 1, 4 and 8 days (Figure 7). In the absence of TNFα treatment, the maximal contraction to carbachol followed the same pattern as described above, with a small increase at day 1 followed by a gradual decrease to day 8 (Table 2). The potency of carbachol was not altered after 1 day of culture, but thereafter a gradual increase to 5 fold higher potency at day 8 was observed.
Figure 7.
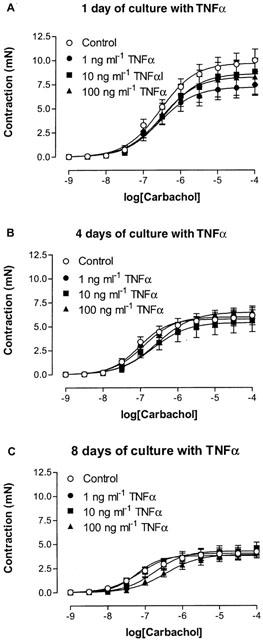
Concentration-effect curves to carbachol obtained on mouse tracheal segments, cultured for (A) 1, (B) 4 and (C) 8 days in absence and presence of 1, 10 or 100 ng ml−1 TNFα. Each point represents the mean of all segments tested with error bars representing s.e.mean from 6–8 animals.
After treatment of the segments for 1, 4 and 8 days with 1, 10 or 100 ng ml−1 TNFα, the maximum contractile response was not altered compared to control segments. However, after 4 and 8 days of culture a significant increase in the potency (3 and 5 fold differences, respectively) was obtained following treatment with the highest concentration of TNFα.
Contractile effects of 5-HT following organ culture in the absence and presence of TNFα
Fully-defined concentration-effect curves were obtained using 5-HT for all treatment groups (Figure 8). In control segments, cultured for 1, 4 and 8 days, the 5-HT responses were weak compared to carbachol contractions, and maximal contractile forces were not significantly different from those obtained with fresh segments (Table 2). As observed for carbachol, potency increased gradually. However, the increase in potency was more accentuated with 5-HT treatment (10 and 12 fold higher potency at day 4 and 8, respectively, compared to day 0).
Figure 8.
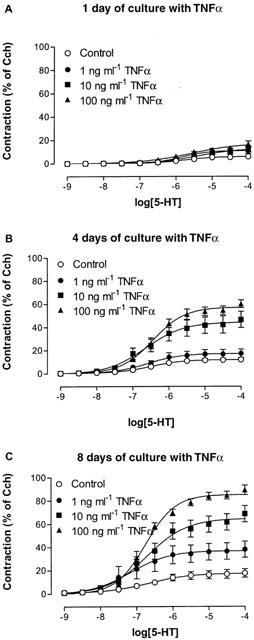
Concentration-effect curves to 5-HT obtained on mouse tracheal segments, cultured for (A) 1, (B) 4 and (C) 8 days in absence and presence of 1, 10 or 100 ng ml−1 TNFα. Each point represents the mean of all segments tested with error bars representing s.e.mean from 6–8 animals.
Following treatment with TNFα, there was a significant time- and concentration-dependent increase in the maximal responses to 5-HT (Figure 8). At day 1, only the treatment with the highest concentration of TNFα induced a significantly stronger contraction to 5-HT, whereas at day 4 both 10 and 100 ng ml−1 TNFα increased the contraction to 5-HT. By day 8, all concentrations induced a significantly stronger contraction to 5-HT. The effect of TNFα presumably reached maximum at 100 ng ml−1 since no further increase could be detected after culture with 200 ng ml−1 (α=5.7±3.3, 41.4±6.2 and 82.0±17.2% after 1, 4 and 8 days treatment, respectively; n=2). In contrast to carbachol, the potency for 5-HT in segments treated with TNFα was similar to the untreated control segments.
To estimate the potency of TNFα when acting to increase the maximal contraction to 5-HT, concentration-response curves for the different days were obtained (Figure 9). Notably, the potency of TNFα for the different culture periods was almost identical ([A]50=3.39, 4.27 and 3.82 ng ml−1, representing p[A]50 values of 9.70, 9.60 and 9.65, after 1, 4 and 8 days culture, respectively).
Figure 9.
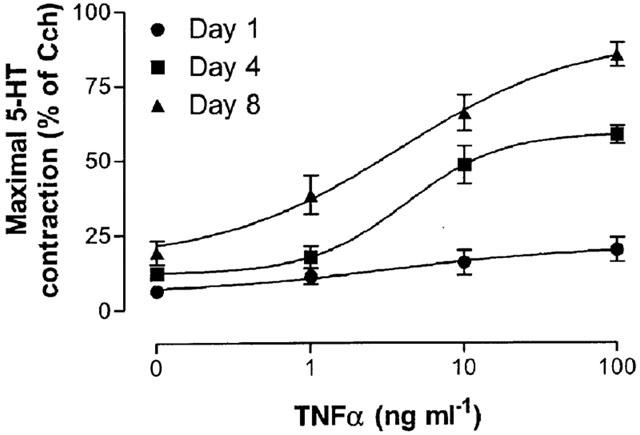
Concentration-effect curves of the maximal contraction to 5-HT induced by TNFα on mouse tracheal segments cultured for 1, 4 and 8 days. Each point represents the mean of all segments tested with error bars representing s.e.mean from 6–8 animals.
Pharmacological characterisation
In order to define the receptor or receptors that were responsible for the contractile effect of 5-HT, tracheal segments cultured for 4 days with 100 ng ml−1 TNFα were pharmacologically characterized. Initially, three agonists, 5-CT, 8-OH-DPAT and α-methyl-5-HT, in addition to 5-HT, were selected due to their different potency for the 5-HT receptors subtypes (Hoyer et al., 1994). The 5-HT2 receptor selective agonist, α-methyl-5-HT, displayed both similar maximal effect and potency as 5-HT (α=60.2±4.6% and 58.2±6.0%, and p[A]50=6.69±0.22 and 6.69±0.14, for 5-HT and α-methyl-5-HT, respectively) whereas the 5-HT1 receptor agonists 5-CT and 8-OH-DPAT were less potent and could not, over the concentration range used, reach the upper asymptote (Figure 10a). Linear regression analysis was used to obtain p[A]50 estimates of 4.96±0.22 and 4.42±0.01 for 5-CT and 8-OH-DPAT, respectively. Since maximal contraction was not obtained, these values are probably overestimated, but the values suggest that the potencies of the agonists are at least a 53 and 239 fold lower, respectively, than 5-HT and α-methyl-5-HT.
Figure 10.
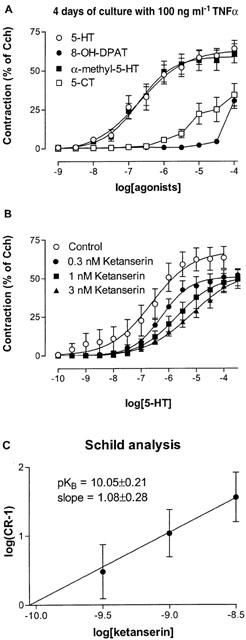
Concentration-effect curves (A) to the different 5-HT receptor agonists 5-HT, 5-CT, α-methyl-5-HT and 8-OH-DPAT obtained on mouse tracheal segments and (B) to 5-HT in absence and presence of 0.3, 1 and 3 nM of ketanserin, cultured for 4 days presence of 100 ng ml−1 TNFα. (C) Schild analysis of ketanserin. Each point represents the mean of all segments tested with error bars representing s.e.mean from six animals.
Since the potent action of α-methyl-5-HT indicated the presence of 5-HT2 receptors, further characterization with the selective 5-HT2A receptor antagonist ketanserin (pKB=9.3 and 6.5 for 5-HT2A and 5-HT2C, respectively; Hoyer et al., 1994) was performed. Ketanserin caused concentration-dependent, parallel rightward shift of 5-HT concentration-effect curves without significantly altering the maximal level of the contraction (Figure 10b). Schild analysis gave a slope coefficient not different from unity (1.08±0.28) and a pKB value of 10.05±0.21 was obtained when the slope was constrained to unity (Figure 10C).
In addition, 5-HT responses in fresh segments were characterized. Due to the low signal-to-noise ratio, only a single concentration of ketanserin (1 nM) was investigated. The rightward shift obtained produced an estimated pKB value of 10.18±0.04, which was not significantly different from the experiments performed after 4 days of culture with TNFα.
Investigation of possible 5-HT neural activation
Since it has been shown that 5-HT can cause neural release of acetylcholine in ovalbumin-challenged mice (Eum et al., 1999), experiments with a muscarinic receptor antagonist, atropine, were performed. For this experiment, segments were cultured for 4 days with 100 ng ml−1 TNFα. Whereas, 1 μM atropine caused ∼1000 fold shift of the location of the carbachol curve, no effect on the maximal contraction or the potency was obtained with 5-HT (data not shown).
Discussion
The current study presents an evaluation of the long-term effects of culturing mouse tracheal segments. Tissues were shown to maintain their contractile phenotype and morphological organization during culture. Although there was some contractile variability in tissues that were cultured for up to 4 days, tissues cultured for 8 or more days contracted and relaxed uniformly in response to pharmacological agents. Changes in contractility were paralleled by global gene expression level change, which was altered upon placing tracheal segments into culture, but was relatively stable when tissues were maintained in culture for up to 16 days.
Initial function experiments revealed that the same basal isometric tension could be used to study tracheal segments regardless of duration of organ culture. This confirmed that contractile mechanisms remain intact during the culture procedure. The level of basal isometric tension was about 5–10 times lower than the tension suggested for organ bath studies of mouse trachea (Garssen et al., 1990; Hooker et al., 1977). One effect of using the lower basal tension was that contractions induced by both KCl and carbachol were considerably higher than reported in these previous studies.
The effect of culture period on KCl and carbachol contractile responses was similar. Thus, maximal contraction of segments was increased for the first two days of culture relative to fresh tissue. After which, the maximal contraction decreased to a stable level by day 8 (approximately 40 and 70% of initial contraction for KCl and carbachol, respectively). These agents activate different intracellular pathways (KCl causes membrane depolarization and activates voltage-gated L-type calcium channels, and carbachol activates Gq-protein coupled muscarinic M3 receptors (Garssen et al., 1993; Li et al., 1998; Zaagsma et al., 1997). Therefore, the reduction in contractile response is likely to be due to changes in a common part of the contractile pathway, such as the activation of contractile proteins. This assumption is supported by data from recent experiments demonstrating that 4 days of culture reduced the actin (∼85%) and myosin (50%) content in isolated segments of rat tail artery (Lindqvist et al., 1999). Furthermore, endothelin-1, a strong contractile agent of mouse tracheae (Henry et al., 1990), induced no additional response in segments maximally contracted with carbachol. These data are consistent with the carbachol-induced contraction reflecting the maximal contractile state of the smooth muscle, in agreement with the notion that a large muscarinic receptor reserve exists in airway smooth muscle (Henry et al., 1990).
There was a small, but significant, increase in the potency of KCl with increasing time of culture. This effect was also seen in cultured rat renal arteries (de mey et al., 1989), and may be explained by a decreased membrane potential, as observed in cultured or denervated smooth muscle cells (Rogers et al., 1993). The magnitude of isoprenaline induced relaxation was unaffected by the culture procedure. Relatively small alterations in isoprenaline potency could be attributed to minor changes in the adrenoceptor pathways (Henry & Goldie, 1990). Forskolin induced activation of cAMP induced a relaxation to baseline levels in all groups. Thus, despite the minor changes to isoprenaline-induced relaxation, relaxatory mechanisms were maintained following organ culture.
One of the aims of developing this assay was to provide a method for the long-term assessment of changes in pharmacological responsiveness in concert with underlying changes in gene expression. To determine the suitability of the assay for detecting changes in the levels of individual genes or discrete gene networks, first, we used a DNA microarray approach to determine the extent of global changes in gene expression over the culture period. Global gene expression levels changed more when tracheae were placed in culture than when they were maintained in culture for 16 days. This result paralleled changes in the contractile phenotype of the smooth muscle, although perhaps as expected, gene expression changes appeared to stabilize before functional changes. One potential caveat was that tracheal segments consisted of both smooth muscle and cartilage, and so the total RNA may have included material from chondrocytes. In future, we plan to limit gene expression change analysis to the muscle by adopting laser micro-dissection technology.
The present study clearly demonstrates that mouse tracheal segments maintain their morphology and contractile and relaxatory functions for a culture period of 32 days. Previously, it has been demonstrated that rat foetal lung explants can be maintained in organ culture for up to 12 days (Funkhouser et al., 1976). However, when these explants exceeded 1–2 mm in any dimension, necrosis appeared in the centre of the tissue, which was suggested to be due to the limited availability of nutrients and oxygen. In the present study, no necrosis or cell death was detected in tissues, indicating that nutrients could pass through the thin tracheal wall (not exceeding 0.2 mm in width). No change in the spatial arrangement of cells was observed in the present study following culture in accordance with data obtained from cultured blood vessel segments (de mey et al., 1989), which may be due to the absence serum in the culture medium.
Cultured isolated airway segments have previously been used to study the effects of inflammatory mediators, but culture periods have typically not exceeded 1 day (Hakonarson et al., 1996; Wills-Karp et al., 1993). In this study, the data obtained show that culture with the pro-inflammatory cytokine TNFα for 1, 4 and 8 days induced a small decrease in the potency of the muscarinic agonist carbachol, whereas it induced a marked increase in the contractile response to 5-HT in mouse tracheal segments. The increased contractile response to 5-HT was dependent on both the concentration and duration of TNFα treatment, and was not secondary to altered neural release of acetylcholine. Pharmacological characterization with different 5-HT receptor agonists indicated that the response was induced by activation of 5-HT2A receptors. Selective up-regulation of the 5-HT response system may be taken to indicate that long-term exposure to inflammatory mediators regulates the phenotype of the airway smooth muscle cells in a manner predisposing for hyperreactivity.
The maximal contraction elicited by carbachol was similar in control and TNFα-treated segments cultured for the same time period, indicating that TNFα does not alter the functional capacity of the contractile proteins. In agreement with earlier studies using isolated rabbit and guinea-pig tracheas cultured for 18 h (Hakonarson et al., 1996; Wills-Karp et al., 1993), no differences in potency were obtained after 1 day of culture. However, a significant decrease in the potency of carbachol was seen after culture for 4 and 8 days with the highest concentrations of TNFα. The decrease in potency, concomitant with a maintained maximal contraction, suggests that there is either a reserve of receptors or redundancy in the contractile pathways, in agreement with the hypothesis that muscarinic full agonists, such as carbachol, induce contraction close to the capacity of the segments. Interestingly, the decrease in potency observed in the present study is contradictory to the increase in sensitivity to methacholine upon TNFα inhalation in humans (Thomas et al., 1995). However, it is conceivable that inhaled TNFα triggers responses in several other cell types, orchestrating secondary secretion of other inflammatory mediators. It has been shown that TNFα can induce both inducible nitric oxide synthase (iNOS) (Hess et al., 1998) and phospholipase A2/cyclo-oxygenase-2 expression (Vadas et al., 1996) in the airways. Thus it is possible that constitutively expressed nitric oxide or prostaglandins could decrease the efficacy of carbachol. An alternative/additional explanation for the reduced potency of carbachol could be a decrease in the number of muscarinic receptors, as demonstrated after TNFα treatment of dispersed airway muscle cells (Hotta et al., 1999).
The responses to 5-HT, following the culture of segments in the absence of TNFα, showed an analogous pattern to carbachol, with a stable maximal response and an increase in potency. However, the increase in 5-HT potency was much more accentuated than the carbachol potency increase. The activity of 5-HT2A receptors (for receptor characterization, see below) is highly dependent on the influx of extracellular calcium (McKune & Watts, 2001), and increased sensitivity to 5-HT could therefore be due to increased membrane depolarization (Rogers et al., 1993). It is possible that the magnitude of the carbachol response did not increase like the 5-HT response because muscarinic M3 receptor activation does not depend on the activation of voltage gated L-type calcium channels (Li et al., 1998).
TNFα induced a marked concentration- and time-dependent increase in 5-HT-mediated contractions without altering potency with respect to untreated time controls. Recent studies in mice have suggested that 5-HT induces contraction by potentiating the neuronal release of acetylcholine (Eum et al., 1999). However, in the present study a high concentration of atropine did not alter the concentration-effect curves of 5-HT in the TNFα-treated segments, excluding this possibility. A decreased maximum effect without changes in potency has been obtained when 5-HT2A and 5-HT2C receptors are irreversibly inactivated by phenoxybenzamine, a response that is thought to be due to the ‘absence of receptor reserve' (Berg et al., 1998). Thus, it is possible that TNFα induces an increase in the number of functionally coupled 5-HT receptors in the smooth muscle cells. In-vivo, it has been demonstrated that rats exposed to aerosolized TNFα also have an increased responsiveness to 5-HT (Kips et al., 1992). This increase, observed in vivo, may be governed by the same mechanism that is operating in organ culture. Thus, TNFα may be an important modulator of hyperresponsiveness, and the mechanisms behind this effect will be investigated in future studies.
In this study, pharmacological characterization of the receptors mediating the 5-HT response was initially performed with other 5-HT agonists that express different selectivity for the possible receptor subtypes. The potency order obtained 5-HT=α-methyl-5-HT>5-CT>8-OH-DPAT was almost identical to those observed in contractile assays of the mouse aorta (5-HT>α-methyl-5-HT>5-CT>8-OH-DPAT; McKune & Watts, 2001), indicating that the responses were mediated by the 5-HT2A receptors. Complementary experiments were performed with a selective 5-HT2A receptor antagonist, ketanserin, and the calculated pKB value (10.05) was similar to that obtained in mouse aorta (9.72; McKune & Watts, 2001), confirming the 5-HT2A receptor classification. The pKB value for ketanserin in fresh segments was not significantly different from that observed after 4 days of TNFα treatment, which suggests that the same receptor is expressed under normal conditions in the mouse trachea. Interestingly, ketanserin has also been reported to act as a mild bronchodilator in patients with chronic airway obstruction (Cazzola et al., 1992).
In conclusion, this study demonstrated that, although small phenotypic changes were observed in the initial period of culture, mouse tracheal segments maintain their contractile and relaxatory capacities for culture periods of at least 32 days. Therefore, the assay allows for the evaluation of the long-term effects of inflammatory mediators on airway smooth muscle reactivity in a system that retains the analytical advantage of classical, operator-controlled, in-vitro pharmacological assays. Furthermore, the value of the model has been illustrated by the investigation of the alterations to the contractile phenotype arising from long-term exposure to the inflammatory mediator TNFα. Thus, the present study not only indicates that TNFα up-regulates 5-HT2A receptor mediated contractions, but also that this assay can be used to evaluate how different inflammatory mediators act to alter the contractile phenotype of airway smooth muscle.
Acknowledgments
The authors would like to thank D. Amaratunga for statistical analysis and J. Wan, B. Tian, A. Bittner, M. Morton, J. Kinong and K. Borchardt for microarray analysis. The present work was supported by the Wellcome-Swedish Travelling Research Fellowship, the Swedish Medical Research Council, the Swedish Heart Lung Foundation, the Swedish Association for Allergology, the Swedish Foundation for Health Care Science and Allergic Research and the Royal Physiographic Society.
Abbreviations
- 5-CT
5-carboxamidotryptamine
- 5-HT
5-hydroxytryptamine
- 8-OH-DPAT
8-hydroxy-2-2(di-n-propylamino)-tetralin
- DMEM
Dulbecco's Modified Eagle's Medium
- TNFα
tumour necrosis factor-alpha
References
- AMRANI Y., KRYMSKAYA V., MAKI C., PANETTIERI R.A., JR Mechanisms underlying TNF-alpha effects on agonist-mediated calcium homeostasis in human airway smooth muscle cells. Am. J. Physiol. 1997;273:L1020–L1028. doi: 10.1152/ajplung.1997.273.5.L1020. [DOI] [PubMed] [Google Scholar]
- BERG K.A., MAAYANI S., GOLDFARB J., SCARAMELLINI C., LEFF P., CLARKE W.P. Effector pathway-dependent relative efficacy at serotonin type 2A and 2C receptors: evidence for agonist-directed trafficking of receptor stimulus. Mol. Pharmacol. 1998;54:94–104. [PubMed] [Google Scholar]
- BLACK J.W., LEFF P., SHANKLEY N.P. Further analysis of anomalous pKB values for histamine H2-receptor antagonists on the mouse isolated stomach assay. Br. J. Pharmacol. 1985;86:581–587. doi: 10.1111/j.1476-5381.1985.tb08934.x. [DOI] [PMC free article] [PubMed] [Google Scholar]
- BOUSQUET J., JEFFERY P.K., BUSSE W.W., JOHNSON M., VIGNOLA A.M. Asthma. From bronchoconstriction to airways inflammation and remodeling. Am. J. Respir. Crit. Care Med. 2000;161:1720–1745. doi: 10.1164/ajrccm.161.5.9903102. [DOI] [PubMed] [Google Scholar]
- CAZZOLA M., MATERA M.G., SANTANGELO G., ASSOGNA G., D'AMATO G., ROSSI F., GIRBINO G. Effect of the selective 5-HT2 antagonist ketanserin on adenosine-induced bronchoconstriction in asthmatic subjects. Immunopharmacology. 1992;23:21–28. doi: 10.1016/0162-3109(92)90005-w. [DOI] [PubMed] [Google Scholar]
- DE MEY J.G., UITENDAAL M.P., BOONEN H.C., VRIJDAG M.J., DAEMEN M.J., STRUYKER-BOUDIER H.A. Acute and long-term effects of tissue culture on contractile reactivity in renal arteries of the rat. Circ. Res. 1989;65:1125–1135. doi: 10.1161/01.res.65.4.1125. [DOI] [PubMed] [Google Scholar]
- EUM S.Y., NOREL X., LEFORT J., LABAT C., VARGAFTIG B.B., BRINK C. Anaphylactic bronchoconstriction in BP2 mice: interactions between serotonin and acetylcholine. Br. J. Pharmacol. 1999;126:312–316. doi: 10.1038/sj.bjp.0702304. [DOI] [PMC free article] [PubMed] [Google Scholar]
- FUNKHOUSER J.D., HUGHES E.R., PETERSON R.D. An organ culture system for study of fetal lung development. Biochem. Biophys. Res. Commun. 1976;70:630–637. doi: 10.1016/0006-291x(76)91094-9. [DOI] [PubMed] [Google Scholar]
- GARSSEN J., VAN LOVEREN H., GIERVELD C.M., VAN DER VLIET H., NIJKAMP F.P. Functional characterization of muscarinic receptors in murine airways. Br. J. Pharmacol. 1993;109:53–60. doi: 10.1111/j.1476-5381.1993.tb13530.x. [DOI] [PMC free article] [PubMed] [Google Scholar]
- GARSSEN J., VAN LOVEREN H., VAN DER VLIET H., NIJKAMP F.P. An isometric method to study respiratory smooth muscle responses in mice. J. Pharmacol. Methods. 1990;24:209–217. doi: 10.1016/0160-5402(90)90031-f. [DOI] [PubMed] [Google Scholar]
- GOSSET P., TILLIE-LEBLOND I., OUDIN S., PARMENTIER O., WALLAERT B., JOSEPH M., TONNEL A.B. Production of chemokines and proinflammatory and antiinflammatory cytokines by human alveolar macrophages activated by IgE receptors. J. Allergy Clin. Immunol. 1999;103:289–297. doi: 10.1016/s0091-6749(99)70504-x. [DOI] [PubMed] [Google Scholar]
- HAKONARSON H., HERRICK D.J., SERRANO P.G., GRUNSTEIN M.M. Mechanism of cytokine-induced modulation of beta-adrenoceptor responsiveness in airway smooth muscle. J. Clin. Invest. 1996;97:2593–2600. doi: 10.1172/JCI118708. [DOI] [PMC free article] [PubMed] [Google Scholar]
- HENRY P.J., GOLDIE R.G. Beta 1-adrenoceptors mediate smooth muscle relaxation in mouse isolated trachea. Br. J. Pharmacol. 1990;99:131–135. doi: 10.1111/j.1476-5381.1990.tb14666.x. [DOI] [PMC free article] [PubMed] [Google Scholar]
- HENRY P.J., RIGBY P.J., SELF G.J., PREUSS J.M., GOLDIE R.G. Relationship between endothelin-1 binding site densities and constrictor activities in human and animal airway smooth muscle. Br. J. Pharmacol. 1990;100:786–792. doi: 10.1111/j.1476-5381.1990.tb14093.x. [DOI] [PMC free article] [PubMed] [Google Scholar]
- HESS A., BLOCH W., ROCKER J., ADDICKS K., STENNERT E., MICHEL O. In vitro expression of inducible nitric oxide synthase in the nasal mucosa of guinea pigs after incubation with lipopolysaccharides or cytokines. Eur. Arch. Otorhinolaryngol. 1998;255:448–453. doi: 10.1007/s004050050097. [DOI] [PubMed] [Google Scholar]
- HIRST S.J., TWORT C.H., LEE T.H. Differential effects of extracellular matrix proteins on human airway smooth muscle cell proliferation and phenotype. Am. J. Respir. Cell. Mol. Biol. 2000;23:335–344. doi: 10.1165/ajrcmb.23.3.3990. [DOI] [PubMed] [Google Scholar]
- HOOKER C.S., CALKINS P.J., FLEISCH J.H. On the measurement of vascular and respiratory smooth muscle responses in vitro. Blood Vessels. 1977;14:1–11. doi: 10.1159/000158110. [DOI] [PubMed] [Google Scholar]
- HOTTA K., EMALA C.W., HIRSHMAN C.A. TNF-alpha upregulates Gialpha and Gqalpha protein expression and function in human airway smooth muscle cells. Am. J. Physiol. 1999;276:L405–L411. doi: 10.1152/ajplung.1999.276.3.L405. [DOI] [PubMed] [Google Scholar]
- HOYER D., CLARKE D.E., FOZARD J.R., HARTIG P.R., MARTIN G.R., MYLECHARANE E.J., SAXENA P.R., HUMPHREY P.P. International Union of Pharmacology classification of receptors for 5-hydroxytryptamine (Serotonin) Pharmacol. Rev. 1994;46:157–203. [PubMed] [Google Scholar]
- JACOBY D.B. Virus-induced asthma attacks. Jama. 2002;287:755–761. doi: 10.1001/jama.287.6.755. [DOI] [PubMed] [Google Scholar]
- KIPS J.C., TAVERNIER J., PAUWELS R.A. Tumor necrosis factor causes bronchial hyperresponsiveness in rats. Am. Rev. Respir. Dis. 1992;145:332–336. doi: 10.1164/ajrccm/145.2_Pt_1.332. [DOI] [PubMed] [Google Scholar]
- LI L., PAAKKARI I., VAPAATALO H. Effects of K+ channel inhibitors on the basal tone and KCl- or methacholine-induced contraction of mouse trachea. Eur. J. Pharmacol. 1998;346:255–260. doi: 10.1016/s0014-2999(98)00074-0. [DOI] [PubMed] [Google Scholar]
- LINDQVIST A., NORDSTROM I., MALMQVIST U., NORDENFELT P., HELLSTRAND P. Long-term effects of Ca(2+) on structure and contractility of vascular smooth muscle. Am. J. Physiol. 1999;277:C64–73. doi: 10.1152/ajpcell.1999.277.1.C64. [DOI] [PubMed] [Google Scholar]
- MA X., LI W., STEPHENS N.L. Heterogeneity of airway smooth muscle at tissue and cellular levels. Can. J. Physiol. Pharmacol. 1997;75:930–935. [PubMed] [Google Scholar]
- MCKUNE C.M., WATTS S.W. Characterization of the serotonin receptor mediating contraction in the mouse thoracic aorta and signal pathway coupling. J. Pharmacol. Exp. Ther. 2001;297:88–95. [PubMed] [Google Scholar]
- NAKATANI Y., NISHIMURA Y., NISHIUMA T., MAEDA H., YOKOYAMA M. Tumor necrosis factor-alpha augments contraction and cytosolic Ca2+ sensitivity through phospholipase A(2) in bovine tracheal smooth muscle. Eur. J. Pharmacol. 2000;392:175–182. doi: 10.1016/s0014-2999(00)00087-x. [DOI] [PubMed] [Google Scholar]
- ROGERS M.J., WARD S.M., HORNER M.A., SANDERS K.M., HOROWITZ B. Characterization of the properties of canine colonic smooth muscle in culture. Am. J. Physiol. 1993;265:C1433–C1442. doi: 10.1152/ajpcell.1993.265.5.C1433. [DOI] [PubMed] [Google Scholar]
- RYTILA P., METSO T., HEIKKINEN K., SAARELAINEN P., HELENIUS I.J., HAAHTELA T. Airway inflammation in patients with symptoms suggesting asthma but with normal lung function. Eur. Respir. J. 2000;16:824–830. doi: 10.1183/09031936.00.16582400. [DOI] [PubMed] [Google Scholar]
- SCHMIDT D., RABE K.F. Immune mechanisms of smooth muscle hyperreactivity in asthma. J. Allergy Clin. Immunol. 2000;105:673–682. doi: 10.1067/mai.2000.105705. [DOI] [PubMed] [Google Scholar]
- SIMMEN K.A., SINGH J., LUUKKONEN B.G., LOPPER M., BITTNER A., MILLER N.E., JACKSON M.R., COMPTON T., FRUH K. Global modulation of cellular transcription by human cytomegalovirus is initiated by viral glycoprotein B. Proc. Natl. Acad. Sci. U.S.A. 2001;98:7140–7145. doi: 10.1073/pnas.121177598. [DOI] [PMC free article] [PubMed] [Google Scholar]
- SZELENYI I. Animal models of bronchial asthma. Inflamm. Res. 2000;49:639–654. doi: 10.1007/s000110050642. [DOI] [PubMed] [Google Scholar]
- TERAJIMA M., YAMAYA M., SEKIZAWA K., OKINAGA S., SUZUKI T., YAMADA N., NAKAYAMA K., OHRUI T., OSHIMA T., NUMAZAKI Y., SASAKI H. Rhinovirus infection of primary cultures of human tracheal epithelium: role of ICAM-1 and IL-1beta. Am. J. Physiol. 1997;273:L749–759. doi: 10.1152/ajplung.1997.273.4.L749. [DOI] [PubMed] [Google Scholar]
- THOMAS P.S., YATES D.H., BARNES P.J. Tumor necrosis factor-alpha increases airway responsiveness and sputum neutrophilia in normal human subjects. Am. J. Respir. Crit. Care Med. 1995;152:76–80. doi: 10.1164/ajrccm.152.1.7599866. [DOI] [PubMed] [Google Scholar]
- TONNEL A.B., GOSSET P., TILLIE-LEBLOND I. Characteristics of the inflammatory response in bronchial lavage fluids from patients with status asthmaticus. Int. Arch. Allergy Immunol. 2001;124:267–271. doi: 10.1159/000053729. [DOI] [PubMed] [Google Scholar]
- VADAS P., STEFANSKI E., WLOCH M., GROUIX B., VAN DEN BOSCH H., KENNEDY B. Secretory non-pancreatic phospholipase A2 and cyclooxygenase-2 expression by tracheobronchial smooth muscle cells. Eur. J. Biochem. 1996;235:557–563. doi: 10.1111/j.1432-1033.1996.t01-1-00557.x. [DOI] [PubMed] [Google Scholar]
- WILLS-KARP M. Smooth muscle as a direct or indirect target accounting for bronchopulmonary hyperresponsiveness. Res. Immunol. 1997;148:59–72. doi: 10.1016/s0923-2494(97)86275-x. [DOI] [PubMed] [Google Scholar]
- WILLS-KARP M., UCHIDA Y., LEE J.Y., JINOT J., HIRATA A., HIRATA F. Organ culture with proinflammatory cytokines reproduces impairment of the beta-adrenoceptor-mediated relaxation in tracheas of a guinea pig antigen model. Am. J. Respir. Cell. Mol. Biol. 1993;8:153–159. doi: 10.1165/ajrcmb/8.2.153. [DOI] [PubMed] [Google Scholar]
- ZAAGSMA J., ROFFEL A.F., MEURS H. Muscarinic control of airway function. Life Sci. 1997;60:1061–1068. doi: 10.1016/s0024-3205(97)00048-9. [DOI] [PubMed] [Google Scholar]