

Abstract
Chronic renal failure (CRF) is associated with a decrease in liver cytochrome P450 (P450). The mechanism remains poorly understood. The present study aimed to investigate the effects of the serum of rats with CRF on liver P450.
Normal rat hepatocytes were incubated for 24 h with serum (concentration of 10%) from rats with CRF and from control animals in order to measure (1) total P450 level, (2) protein expression and mRNA levels of major P450 isoforms, and (3) some of their specific metabolic activities (N-demethylation of erythromycin). Time-course experiments (incubation time from 12 to 48 h) and dose-response curves (concentration of serum ranging from 1 to 30%) have been conducted.
In normal hepatocytes incubated for 24 h with serum (concentration of 10%) from rats with CRF, total P450 level, protein expression and mRNA levels of several P450 isoforms (CYP2C6, 2C11, 3A1 and 3A2) were decreased by more than 35% (P<0.001) compared to serum from control animals. The protein expression as well as the mRNA levels of CYP2D were similar in hepatocytes incubated with serum from either control or CRF rats. The N-demethylation of erythromycin was decreased by more than 35% (P<0.001) in hepatocytes incubated with serum from rats with CRF. The inhibitory effect of serum from rats with CRF tended to peak at 48 h of incubation and was maximum at a concentration of 20%.
In conclusion, uremic serum contains mediator(s) that down-regulate the cytochrome P450 of normal hepatocytes secondary to reduced gene expression.
Keywords: Chronic renal failure, cytochrome P450, gene expression, drug metabolism, hepatocytes, serum mediator(s)
Introduction
Several studies have shown that the metabolic clearance of various substrates is reduced in patients with CRF (Matzke & Frye, 1997; Talbert, 1994; Touchette & Slaughter, 1991). The decrease in drug biotransformation is mainly secondary to alteration in drug metabolism by the liver (Touchette & Slaughter, 1991). Indeed, in rats with experimental renal failure, CRF inhibits liver cytochrome P450 (P450) as well as cytosolic enzymes (Leber et al., 1978; Leber & Schutterle, 1972; Patterson & Cohn, 1984; Uchida et al., 1995; van peer & Belpaire, 1977). Recently, we have confirmed that in the rat, CRF induces a marked decrease in liver total P450 activity secondary to reduced protein expression of selective P450 isoforms, namely CYP2C11, 3A1 and 3A2 (Leblond et al., 2001). This down-regulation is produced by a reduction in gene expression (Leblond et al., 2001). The repercussions on the in vitro metabolism of drugs by the liver is important, since we observed a 50% reduction of erythromycin biotransformation mediated by the CYP3A family. Furthermore, we also demonstrated that the in vivo metabolism of some drugs (namely aminopyrine and erythromycin) was markedly reduced in CRF rats (Leblond et al., 2000).
The mechanism underlying the down regulation of liver P450 in CRF remains poorly understood. Leber & Schutterle (1972) have shown that in CRF, the reduction of liver P450 induced by CRF could be reversed in part by l-aminolevulinic acid but these results have not been confirmed. It appears excluded that chronic protein malnutrition, as seen in CRF, could be responsible for reduced P450 synthesis in the liver (Leblond et al., 2001). On the other hand, an attractive hypothesis for the liver P450 down-regulation is the presence of endogenous inhibitors in the uremic blood. In fact some studies have shown that the extraction of propranolol by perfused rat liver was reduced in the presence of uremic blood (Terao & Shen, 1985). Supporting the presence of inhibitors, it has been shown that serum of patients with CRF could down-regulate the in vitro hepatic metabolism of midazolam and tolbutamide (Taburet et al., 1996). However, no study has directly evaluated the effects of CRF serum on liver P450 activity and expression.
The objectives of this study were to determine the effects of CRF serum on liver P450 and to define the mechanisms leading to its down-regulation. For this purpose, we incubated normal rat hepatocytes with serum from CRF and control rats in order to measure (1) cytochrome P450 total level, (2) some of the P450 isoforms involved in drug metabolism (e.g. CYP2C6, 2C11, 2D, 3A1 and 3A2) as well as some of their specific metabolic activities, and (3) the mRNA encoding for these specific isoforms. Finally, experiments have been done to evaluate the molecular weight of the potential inhibitory factors present in uremic serum.
Methods
Experimental model
Male Sprague-Dawley rats (Charles River, Saint-Charles, PQ), weighing 200–300 g were housed in the Research Centre animal care facility and maintained on Purina rat pellets and water ad libitum. An acclimatization period of at least 3 days was allowed to the animals before any experimental work was undertaken. All the experiments were conducted according to the Canadian Council on Animal Care guidelines for care and use of laboratory animals.
Studies were performed using three groups of rats: normal (n=30), CRF (n=70) and control (n=60). Hepatocytes were isolated from normal rat and the sera used for incubation experiments were obtained from either CRF or control rats.
Chronic renal failure was induced by two-stage five-sixth nephrectomy as previously published (Leblond et al., 2001; Leblond et al., 2000). After surgery, CRF animals were fed Purina rat chow and water ad libitum. Rats from control group also underwent two sham laparotomies (day 1 and 8). Control rats were paired-fed the same amount of rat chow that was ingested by the CRF rats on the previous day. At day 41 after the nephrectomy, the rats were housed in metabolic cages and urine was collected for 24 h to determine the clearance of creatinine. Rats were sacrificed by decapitation at 42 days. Blood was collected and rapidly stored on ice. After coagulation, serum was recovered by centrifugation (600 g for 10 min) and samples were kept for the measurement of serum creatinine and urea. The remaining sera were stored at −80°C.
Hepatocyte isolation and culture
Hepatocytes were isolated according to the two-step liver perfusion method of Seglen (Seglen, 1976). Laparotomy was done on anaesthetized normal rats and the portal vein and inferior vena cava were cannulated. The liver was perfused in situ with a Hank's solution (mM: NaCl 120, KCl 5, 1% glucose, KH2PO4 0.4, Na2HPO4 0.2, NaHCO3 25, pH 7.4), in a two-stage period. During the first period, the liver was perfused with Hank's supplemented with 0.1 u ml−1 heparin and 0.5 mM EGTA to remove blood. Thereafter, Hank's containing 1.2 mM MgSO4, 1.8 mM CaCl2, 7.5 μg ml−1 trypsin inhibitor and 5 mg ml−1 collagenase D was perfused to digest hepatic tissue. After in situ perfusion, the liver was removed and placed on ice in Williams E medium. The capsule was stripped away from one side of the liver, and the cells were detached by brushing the liver with a plastic comb and filtered through nylon filter (80 μm). Living cells were purified on a 40% Percoll gradient. Viability was ⩾90% as assessed by trypan blue exclusion. The cell concentration was adjusted to 0.5×10⁶ cells ml−1 with Williams E medium, supplemented with 10% foetal calf serum, and 1 mM insulin. Aliquots of 3 ml of hepatocytes suspensions were transferred into each well of a 6-well plastic culture plate coated with type I rat tail collagen. A pre-incubation of 4 h was done at 37°C in an atmosphere of 95% O2 and 5% CO2.
After pre-incubation, the medium was changed for 2 ml of William E medium containing 10% of serum from rats with CRF or from control animals. The serum of one rat was used for one experiment. Thereafter, the hepatocytes were incubated for another 24 h. Hepatocytes were then harvested by scraping in phosphate-buffered saline. For mRNA analysis, cells were harvested in RLT buffer. Samples were stored at −80°C up to analysis.
Time-course experiment
After pre-incubation, normal hepatocytes were incubated with William E medium containing 10% of serum from rats with CRF or from control animals (as described above). Various incubation times were studied: 12, 24 and 48 h. Culture medium was changed after 24 h. Since the volume of serum used for this experiment exceeded the one obtained from one rat, the serum of 3–5 different rats of the same group (CRF or control) were pooled to perform one time-course experiment. Hepatocytes were then harvested as described above, and stored at −80°C up to analysis.
Dose-response experiment
To assess whether the down-regulation of P450 produced by serum mediator(s) was dose-dependent, dose-response curves were obtained by measuring the ability of a wide range of serum concentration (1–30%) to depress the P450 of normal hepatocytes. Incubation time was 24 h. Similar to the time-course experiment, we pooled the serum of 3–5 CRF or control rats to perform one dose-response curve. Hepatocytes were then harvested as described above, and stored at −80°C up to analysis.
Serum fractionation experiment
In order to evaluate the molecular weight of serum mediator(s), serum proteins from rats with CRF were separated by ultrafiltration using two different molecular weight cut-off: 10 kDa and 30 kDa. Briefly, a pool of CRF serum (10 ml) was sequentially filtered in Centricon 10 and Centricon 30 (Millipore, Nepean, Ontario, Canada) to obtain three fractions: <10 kDa, between 10–30 kDa and >30 kDa. Since the ultrafuiltrate was used to test the fraction <10 kDa, we assume that some proteins over 8 kDa were still retained by the membrane. Normal hepatocytes were then incubated with these serum sub-fractions at a concentration of 10% for 24 h. Control serum was treated the same way. Hepatocytes were then harvested as described before, and stored at −80°C up to analysis.
Microsome preparation from hepatocytes
Microsomes were isolated by differential centrifugation (Tindberg et al., 1996). Pelleted hepatocytes were homogenized (using a Potter-Elvehjem tissue grinder, Wheaton) in 0.5 ml of homogenization buffer (10 mM Tris-HCl pH 7.4, 0.153 M KCl, 0.2 mM EDTA, 0.1 mM DTT, 20% Glycerol, 0.1 mM PMSF) and sonicated for 10 s on ice, and then centrifuged at 12,000×g for 5 min at 4°C. The supernatant was further centrifuged at 100,000 g for 60 min at 4°C. The pellet containing the microsomes was resuspended in 0.154 M NaCl and stored at −80°C up to the analysis.
Determination of total cytochrome P450 activity
Protein content was determined by the method of Lowry et al. (1951) using bovine serum albumin as standard protein. Total cytochrome P450 activity was measured from the difference spectrum of the reduced protein according to previously published method (Omura & Sato, 1964).
Western blot analysis
Some of the major cytochrome P450 isoforms implicated in the metabolism of drugs were assessed by Western blot analysis: CYP2C6, CYP2C11, CYP2D, CYP3A1 and CYP3A2, as described elsewhere (Leblond et al., 2001). Briefly, 25 μg of protein were electrophoresed in a 7.5% polyacrylamide gel containing 0.1% SDS (Laemmli, 1970). CYP2C6, 2C11, 3A2 were detected using polyclonal goat anti-rat 2C6, 2C11 and 3A2, respectively. CYP2D was detected using a rabbit anti-human 2D6. CYP3A1 was detected using a monoclonal mouse anti-rat 3A1. Immune complexes were revealed by secondary antibody, swine anti-goat IgG and goat anti-rabbit IgG as well as goat anti-mouse IgG coupled to peroxidase and the Luminol derivative of Lumi-Light Western blotting substrate. Immune reaction intensity was determined by computer-assisted densitometry on exposed Biomax MR film (Eastman Kodak, Rochester, NY, U.S.A.). In order to test linearity between densitometric signal and protein, we used three different protein loadings: 5, 12.5 and 25 μg. In this experiment we assessed CYP3A1 and 3A2 protein expressions.
RNA isolation and quantitative RT–PCR analysis
At the end of the culture period, cells were harvested directly in RLT buffer with scraper. Samples were kept a −80°C until RNA extraction. Total RNA was extracted from frozen samples with RNeasy kit (Qiagen, Mississauga, Ontario, Canada). RNA concentrations were determined by measuring absorbance at 260 nm.
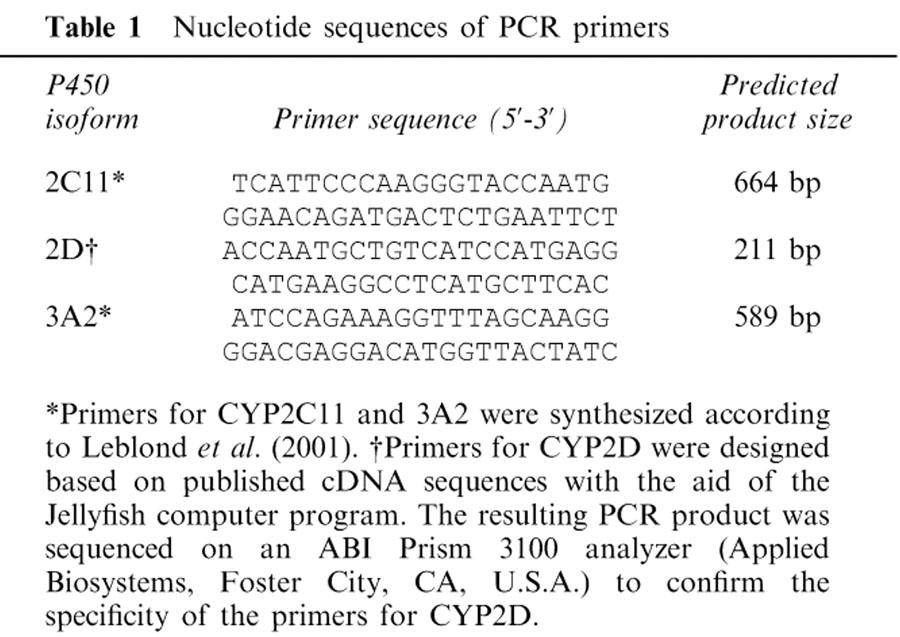
One microgram of total RNA was used to prepare cDNA by reverse transcription using Omniscipt RT kit from Qiagen and random primer from Invitrogen (Burlington, Ontario, Canada). Quantitative PCR was performed using Taq DNA polymerase from Qiagen and the QuantumRNA Classic 18S kit from Ambion (Austin, TX, U.S.A.). This enabled the comparison of control and CRF samples by normalization with the 18S ribosomal RNA content. Specific primer sets were designed for each of the three tested isoforms and are reported in Table 1. The PCR reactions were performed in a GeneAmp PCR system 2400 (Perkin-Elmer) with a 15-s incubation at 94°C, a 15-s incubation at 55°C and a 30-s incubation at 72°C. PCR products were fractionated on 1.5% agarose gel and visualized by ethidium bromide staining.
Table 1.
Nucleotide sequences of PCR primers
In vitro metabolism of erythromycin
In order to evaluate the metabolic activity of CYP3A in microsome of treated hepatocytes, erythromycin N-demethylation was determined as described previously (Leblond et al., 2001). Erythromycin was incubated with 1.5 mg of rat hepatocyte microsomal protein at 37°C for 15 min, in the presence of a NADPH-generating system consisting of: 10 mM glucose 6-phosphate, 1 mM NADP and 0.35 units of glucose-6-phosphate dehydrogenase in a total volume of 0.5 ml. Reactions were quenched with 0.05 ml of 0.87 M ZnSO4 and 0.05 ml of 0.3 N Ba(OH)2. The samples were then centrifuged at 14,000×g for 10 min, and 0.35 ml of the supernatant was transferred and mixed with 0.15 ml of Nash reagent. The mixture was incubated at 56°C for 30 min and samples were analysed by spectrophotometry (absorbance 405 nm) to determine the formation of formaldehyde.
Blood and urine chemistries
Blood (urea, creatinine) and urine (creatinine) chemistries were determined with a Hitachi 717 autoanalyser (Boehringer Mannheim Canada, Laval, Québec, Canada).
Drugs and chemicals
Heparin, glucose, EGTA, trypsin inhibitor, William E medium, Percoll, Insuline, erythromycin were purchased from Sigma chemicals (Sigma, St-Louis, MO, U.S.A.). Collagenase D was provided by Roche Diagnostics (Laval, Québec, Canada). Foetal calf serum was acquired from Biosources International (Camarillo, CA, U.S.A.). Culture plates coated with type I rat tail collagen were purchased from BD (Oakville, Ontario, Canada). RLT buffer was provided by Qiagen (Mississauga, Ontario, Canada). Primers used for PCR quantification were obtained from Sigma.
Polyclonal goat anti-rat 2C6, 2C11 and 3A2 as well as rabbit anti-human 2D6 were acquired from Gentest Corporation (Woburn, MA, U.S.A.). Monoclonal mouse anti-rat 3A1 was obtained from Oxford Biochemical Research (Oxford, MI, U.S.A.). Secondary antibodies (swine anti-goat IgG and goat anti-rabbit IgG) as well as goat anti-mouse IgG were provided by Biosources International (Camarillo, CA, U.S.A.) and by Sigma Chemicals, respectively. Lumi-Light Western blotting substrate was purchased from Roche Diagnostics.
Statistical analysis
The results are expressed as mean±s.e.mean. Differences between groups were assessed by using an unpaired Student's t-test or an ANOVA test. Significant ANOVA was followed by Fisher LSD multiple comparisons procedure. The threshold of significance was P<0.05.
Results
Biochemistry parameters and body weight in control and CRF rats
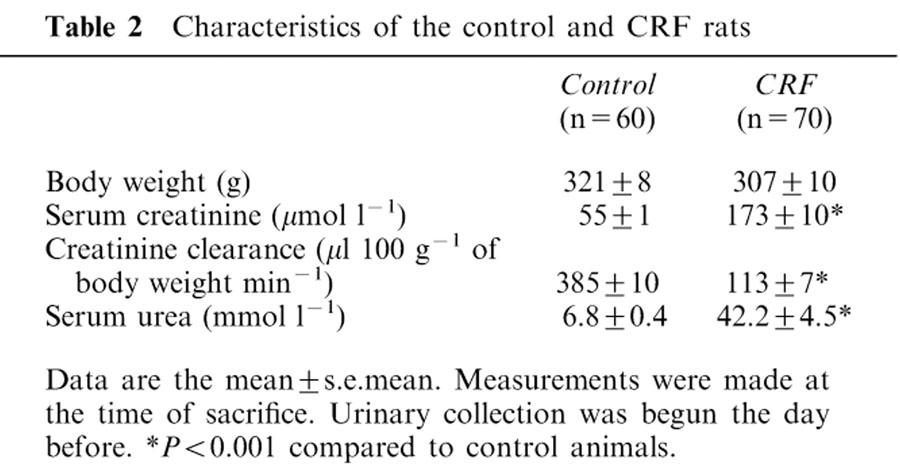
Table 2 presents the biochemicals and body weights of the two groups of animals from whom sera were obtained. Compared to control animals, CRF rats had higher levels of plasma creatine and urea and lower values of creatine clearance (reduced by 71% (P<0.001)). There was no difference in body weight between control and CRF rats.
Table 2.
Characteristics of the control and CRF rats
Total cytochrome P450 level in hepatocytes incubated with serum from CRF or control rats
Total P450 level in hepatocytes incubated for 24 h with 10% of control rat serum was 0.17±0.11 nmol mg−1 of proteins. Following 24 h of incubation of normal hepatocytes with serum (10%) from rats with CRF, total P450 level decreased by 35% (P<0.01).
Protein expression of liver cytochrome P450 isoforms in hepatocytes incubated with serum from CRF or control rats
Following 24 h of incubation of normal hepatocytes with serum (10%) from rats with CRF, several P450 isoforms decreased, compared to hepatocytes incubated with serum from control animals (Figure 1). The levels of CYP2C6, 2C11, 3A1 and 3A2 were reduced by 38, 43, 37 and 57% (P<0.01) respectively, whereas the levels of CYP2D were similar in the two groups of hepatocytes. The same difference in CYP3A1 and 3A2 protein expressions was observed between control and CRF groups when the protein loading is reduced as shown in Figure 2. A correlation of more than 0.7 (P<0.05) was observed between protein loading and signal intensity for both tested isoforms. Similar decrease in CYP2C11, 3A1 and 3A2 protein expressions were obtained with hepatocytes cultured for 7 days and then incubated for 24 h with serum from control or CRF rats (data not shown).
Figure 1.
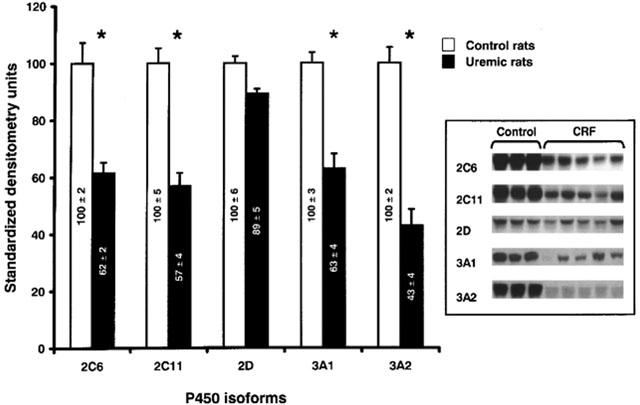
Protein expression of hepatic cytochrome P450 isoforms in hepatocytes incubated with serum from control and CRF rats. Protein bands are expressed in densitometry units (%). The densitometry units of control rats were arbitrarily defined as 100%. Data are the mean±s.e.mean of eight experiments in each group. *P<0.01 as compared to serum from control. Representative blots are also shown.
Figure 2.
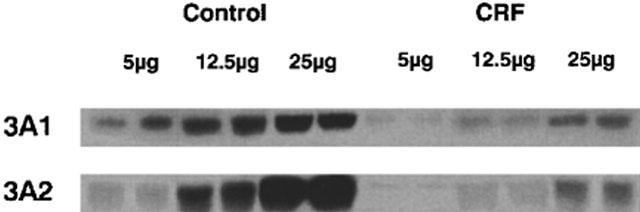
Protein expression of hepatic cytochrome P450 3A1 and 3A2 in hepatocytes incubated with serum from control and CRF rats. Three protein loadings have been used: 5, 12.5 and 25 μg. The difference in protein expression of CYP3A1 and 3A2 between control and CRF was the same for each protein loading.
mRNA encoding liver cytochrome P450 isoforms in hepatocytes incubated with serum from CRF or control rats
In order to determine whether the down-regulation in the protein expression of hepatic cytochrome P450 isoforms was secondary to a decrease in their synthesis or an increase in their degradation, mRNA encoding some of these isoforms (CYP2C11, 2D and 3A2) were measured by quantitative RT–PCR analysis. Following 24 h of incubation of normal hepatocytes with serum (10%) from rats with CRF, mRNA encoding CYP2C11 and 3A2 isoforms were reduced by 27 and 36% (P<0.005) respectively, compared to serum from control animals (Figure 3). Levels of mRNA encoding for CYP2D were similar in both groups (Figure 3). Thus, the decrease in protein expression of P450 isoforms mediated by serum from rats with CRF is secondary to reduced gene expression.
Figure 3.
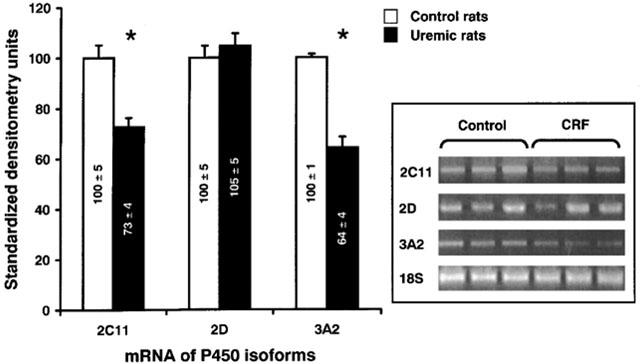
mRNA encoding hepatic cytochrome P450 isoforms (CYP2C11, CYP2D and 3A2) in hepatocytes incubated with serum from control and CRF rats. mRNA bands are expressed in standardized densitometry units (%). The densitometry values for cytochrome P450 isoforms were standardized by dividing these values by the values for 18S ribosomal RNA. The standardized densitometry units of control rats were arbitrarily defined as 100%. Data are the mean±s.e.mean of eight experiments in each group. *P<0.005 as compared to serum from control rats. Representative blots are also shown.
In vitro metabolism of erythromycin in hepatocytes incubated with serum from CRF or control rats
To determine the repercussion of cytochrome P450 reduction on the metabolism of drugs, the in vitro N-demethylation of erythromycin have been assessed in microsomes prepared from hepatocytes previously incubated for 24 h with serum (10%) from CRF or control rats. This enzymatic reaction is mediated primarily by the CYP3A family. The N-demethylation of erythromycin was decreased by 52% in hepatocytes incubated with serum from rats with CRF, compared to serum from control animals (P<0.01) (Figure 4).
Figure 4.
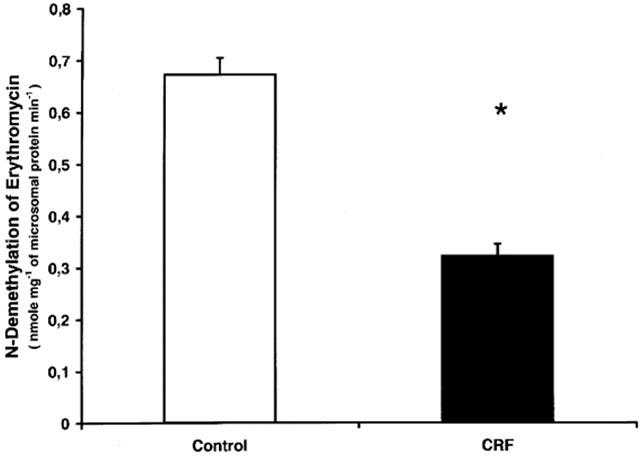
In vitro metabolism of erythromycin in microsomes prepared with hepatocytes incubated with serum from control and CRF rats. Data are the mean±s.e.mean of eight experiments in each group. *P<0.01 as compared to serum from control rats.
Time-course of P450 down-regulation by CRF serum
To study the down-regulation of P450 as a function of time of incubation, normal hepatocytes were incubated for 12, 24 and 48 h in Williams E medium containing 10% of serum from rats with CRF or from control rats. Only protein expression of CYP2D and 3A2 were measured. This experiment showed a progressive decline in CYP3A2 expression in hepatocytes incubated with CRF serum compared to control (Figure 5). There was no change in CYP2D expression between both groups (data not shown).
Figure 5.
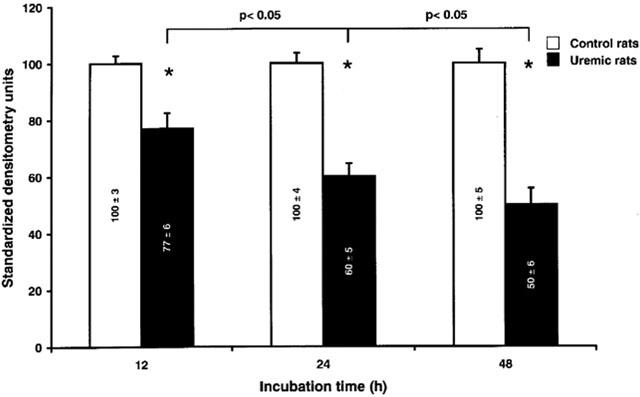
Level of CYP3A2 protein expression in hepatocytes incubated with serum from control and CRF rats, in function of the time of incubation. Hepatocytes were incubated for 12, 24 and 48 h with serum (10%) from control and CRF rats. Protein bands are expressed in densitometry units (%). The densitometry units of control rats were arbitrarily defined as 100%. Data are the mean±s.e.mean of three experiments. *P<0.01 as compared to serum from control.
Dose-response curves of P450 down-regulation by CRF serum
The reduction in P450 induced by CRF serum was closely related to the concentration of serum used (Figure 6). There was a progressive increase in the reduction of CYP3A2 expression when hepatocytes were incubated with increasing concentration of serum from CRF rats (from 2.5 to 30%), compared to serum from control animals. There was no further significant inhibition of CYP3A2 expression beyond a serum concentration of 20%. The difference in the expression of CYP3A2 between serum from control and CRF rats was present in each of the concentration of serum tested except for the concentration of 1%. There was no change in CYP2D expression between both groups (data not shown).
Figure 6.
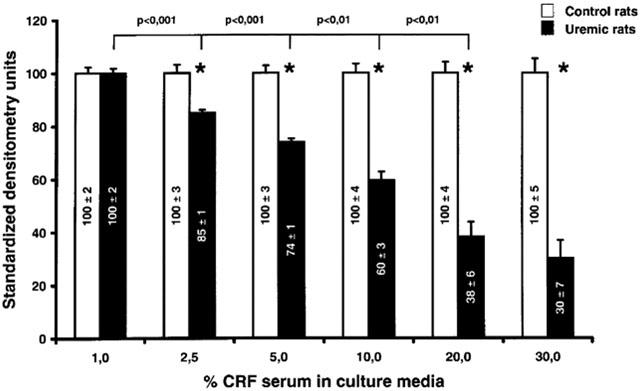
Level of CYP3A2 expression as a function of the concentration of serum used for the incubation of hepatocytes. Hepatocytes were incubated for 24 h with progressive concentration of serum from control and CRF rats. Protein bands are expressed in densitometry units (%). The densitometry units of control rats were arbitrarily defined as 100%. Data are the mean±s.e.mean of six experiments. *P<0.01 as compared to serum from control rats.
Fractionation of serum
In order to characterize the mediator(s) in the serum of CRF rats that down-regulate the P450, sera from rats with CRF were separated in three fractions containing proteins with the following molecular weight: less than 10 kDa, between 10 to 30 kDa and over 30 kDa. The reduction of CYP3A2 expression (40%, P<0.01) was only observed in the fraction of 10–30 kDa, and was similar to that observed in unfractionated CRF serum.
Discussion
This study demonstrates that in the rat, the serum of animals with CRF contains mediator(s) able to induce a marked decrease in hepatic total cytochrome P450 activity secondary to a reduction in the protein expression of several cytochrome P450 isoforms. The mechanism underlying this down-regulation is a reduction in the concentration of mRNA encoding these proteins. The repercussions on the hepatic metabolism of drugs is important, since we observed a reduction in erythromycin biotransformation (mediated by the CYP3A family).
Renal failure has been generally thought to decrease only the renal clearance of drugs (Cantu et al., 1992). However, several studies have demonstrated that animals with CRF also present decreased hepatic drug metabolism (Gibson, 1986). Since the P450 is the major enzymatic system involved in drug metabolism, most studies have focused on liver P450. The results of these studies show that in CRF rats there is a 19–47% decrease in liver total P450 (Leber et al., 1978; Leber & Schutterle, 1972; Leblond et al., 2001; Patterson & Cohn, 1984; Uchida et al., 1995; van peer & Belpaire, 1977). Several P450 isoforms are decreased in the liver, namely CYP2C6, 2C11, 3A1 and 3A2 (Leblond et al., 2001; Uchida et al., 1995). Furthermore, important reductions in enzymatic reactions normally carried by the liver P450 have been reported: N-demethylation of aminopyrine and ethymorphine, O-demethylation of codeine, hydroxylation of aniline and N-demethylation of erythromycin (Gibson, 1986; Leblond et al., 2001). Recently, we have demonstrated that in rats with CRF, liver mRNA of CYP2C11, CYP3A1 and CYP3A2 were significantly decreased, suggesting that there is reduced gene expression (Leblond et al., 2001).
However, the mechanisms underlying liver P450 down-regulation remain poorly known. Previously, Terao & Shen (1985) reported that when livers from healthy rats were perfused with plasma of uremic rats, the extraction of l-propranolol was reduced. Although this study was done in rats using an acute renal failure model and reported no data on drug metabolizing enzyme, it nevertheless provided the first evidence for the presence of an inhibitory factor in the uremic blood that could modify the biotransformation of drugs. In the present study, we used a standard experimental model of CRF. The results clearly demonstrate that uremic serum contains mediator(s) able to down-regulate hepatic P450. Interestingly, our results also closely mimic what has already been published in vivo in rats with CRF (Leblond et al., 2001). Indeed, we found a decrease of 35% in total hepatic P450 and a marked decrease in several P450 isoforms protein expressions (mainly CYP2C6, 2C11, 3A1 and 3A2).
In humans, there is also some data supporting the presence of hepatic P450 inhibitors in CRF serum. It has been shown that serum of patients with CRF could down-regulate the in vitro hepatic metabolism of midazolam and tolbutamide, which are biotransformed by P450 (mainly CYP3A4 and 2C9) (Taburet et al., 1996). Human CYP3A4 corresponds to CYP3A1/3A2 in rats. Interestingly, in the present study we demonstrated a marked decrease in this isoform. Furthermore, we showed that the in vitro metabolism of erythromycin (a specific substrate for CYP31/3A2) was significantly reduced as reported for midazolam in humans. Knowledge of which isoform is reduced by CRF is critical in order to predict which drugs are at risk for accumulation when used in CRF. Since CYP3A4 is responsible for the metabolism of several drugs commonly used in CRF, patients with CRF could be at risk for drug accumulation and toxicity.
Our results demonstrate that there is an association between lower levels of mRNAs and protein for CYP2C11 and 3A2 isoforms (Figure 3) in hepatocytes incubated with serum from rats with CRF. This suggests that gene expression is reduced by mediator(s) present in uremic serum. These results are similar to those reported in in vivo experiments (Leblond et al., 2001). Although the mechanisms responsible for the diminished hepatic gene expression in CRF are not known, the present study suggests that uremic mediator(s) could affect P450 promoters.
A number of studies indicate that animals with CRF display impaired protein synthesis, by reduced gene expression, in the liver, the skeletal muscle and the cardiomyocytes (Klin et al., 1996; Ding et al., 1996; Qing et al., 1999). For instance, the mRNA of hepatic lipase and insulin-like growth factor 1 receptor are decreased in hepatocytes and skeletal muscle respectively, of rats with CRF (Klin et al., 1996; Ding et al., 1996; Qing et al., 1999). CRF is associated with sustained elevations in calcium in many cell types, including the hepatocytes, and this high intracellular calcium seems to be a major factor underlying cell reduced protein synthesis (Klin et al., 1995; Massry & Fadda, 1993). It has been suggested that the increase in basal [Ca2+]i of hepatocytes was secondary to excess in PTH that accompanies CRF (Klin et al., 1994). The predominant pathway for the PTH-induced increase in [Ca2+]i is the stimulation of a G protein-adenylate cyclase-cAMP system which then leads to stimulation of a calcium transport system (Klin et al., 1994). On the other hand, cAMP has been shown to down-regulate P450 (Sidhu & Omiecinski, 1995). Interestingly, the present study demonstrates that the molecular weight of the mediator(s) is superior to 8 kDa, and since rat PTH molecular weight is around 10 kDa, it could be a potential mediator of hepatic P450 down-regulation in CRF.
Other potential mediators are cytokines, since their molecular weight averages 20 kDa. Several studies have demonstrated that CRF is associated with a chronic activation of inflammatory response (Bistrian, 1998; Stenvinkel et al., 1999). Patients with CRF present an increase in plasma levels of many cytokines, such as interleukin-1 (IL-1), monocyte chemotactic and activating factor, interleukin-6 (IL-6), granulocyte inhibitory protein and transforming growth factor (Akahoshi et al., 1995; Higuchi et al., 1997; Oettinger et al., 1994; Sunder-Plassmann et al., 1994; Ziesche et al., 1994). On the other hand, cytokines are able to down-regulate hepatic P450 in vitro and in vivo (Abdel-Razzak et al., 1993; 1994; 1995). These observations support the hypothesis that the mediators contained in the plasma of CRF rats which down-regulate the hepatic P450 could be some specific cytokines which are increased in CRF.
There seems to be a correlation between the decrease in the metabolism of drugs and the severity of renal failure in human (Konishi, 1986). In the rat, we recently reported in vivo a significant correlation between the decrease in renal function and the reduction in liver cytochrome P450 but also with the reduction in the in vitro N-demethylation of erythromycin (Leblond et al., 2000; 2001). These results suggest that as CRF worsens, patients are at risk of drug accumulation and toxicity secondary to reduction in their metabolism. Interestingly, in the present study we found a strong correlation between the dose as well as the incubation time of mediator(s) and the inhibition of P450.
In conclusion, the serum of rats with CRF contains mediator(s) that down-regulate the cytochrome P450 of normal hepatocytes. The serum mediator(s) decrease the protein expression of several P450 isoforms (mainly CYP2C6, 2C11, 3A1 and 3A2), secondary to reducing mRNA levels. Drug metabolism, assessed by the biotransformation of erythromycin, was greatly reduced by serum mediator(s). The depression of P450 induced by CRF rat serum was similar to that produced by CRF in in vivo model, suggesting that uremic mediator(s) are responsible for the reduction in drug metabolism in vivo.
Acknowledgments
This work was supported by the Canadian Institute of Health Research (CIHR), the Kidney Foundation of Canada and Fonds de la Recherche en Santé du Québec. Vincent Pichette is a scholar of the Fonds de la Recherche en Santé du Québec. Part of this work has been presented at the 34th annual meeting of the American Society of Nephrology in San Francisco.
Abbreviations
- CRF
chronic renal failure
- P450
cytochrome P450
- PTH
parathyroid hormone
- SDS
sodium dodecyl sulphate
References
- ABDEL-RAZZAK Z., CORCOS L., FAUTREL A., CAMPION J.P., GUILLOUZO A. Transforming growth factor-beta 1 down-regulates basal and polycyclic aromatic hydrocarbon-induced cytochromes P-450 1A1 and 1A2 in adult human hepatocytes in primary culture. Mol. Pharmacol. 1994;46:1100–1110. [PubMed] [Google Scholar]
- ABDEL-RAZZAK Z., CORCOS L., FAUTREL A., GUILLOUZO A. Interleukin-1 beta antagonizes phenobarbital induction of several major cytochromes P450 in adult rat hepatocytes in primary culture. FEBS Lett. 1995;366:159–164. doi: 10.1016/0014-5793(95)00513-9. [DOI] [PubMed] [Google Scholar]
- ABDEL-RAZZAK Z., LOYER P., FAUTREL A., GAUTIER J.C., CORCOS L., TURLIN B., BEAUNE P., GUILLOUZO A. Cytokines down-regulate expression of major cytochrome P-450 enzymes in adult human hepatocytes in primary culture. Mol. Pharmacol. 1993;44:707–715. [PubMed] [Google Scholar]
- AKAHOSHI T., KOBAYASHI N., HOSAKA S., SEKIYAMA N., WADA C., KONDO H. In-vivo induction of monocyte chemotactic and activating factor in patients with chronic renal failure. Nephrol. Dial. Transplant. 1995;10:2244–2249. doi: 10.1093/ndt/10.12.2244. [DOI] [PubMed] [Google Scholar]
- BISTRIAN B.R. Role of the systemic inflammatory response syndrome in the development of protein-calorie malnutrition in ESRD. Am. J. Kidney Dis. 1998;32:S113–S117. doi: 10.1016/s0272-6386(98)70173-8. [DOI] [PubMed] [Google Scholar]
- CANTU T.G., ELLERBECK E.F., YUN S.W., CASTINE S.D., KORNHAUSER D.M. Drug prescribing for patients with changing renal function. Am. J. Hosp. Pharm. 1992;49:2944–2948. [PubMed] [Google Scholar]
- DING H., GAO X.L., HIRSCHBERG R., VADGAMA J.V., KOPPLE J.D. Impaired actions of insuline-like growth factor 1 on protein synthesis and degradation in skeletal muscle of rats with chronic renal failure. Evidence for a post receptor defect. J. Clin. Invest. 1996;97:1064–1075. doi: 10.1172/JCI118499. [DOI] [PMC free article] [PubMed] [Google Scholar]
- GIBSON T.P. Renal disease and drug metabolism: an overview. Am. J. Kidney Dis. 1986;8:7–17. doi: 10.1016/s0272-6386(86)80148-2. [DOI] [PubMed] [Google Scholar]
- HIGUCHI T., YAMAMOTO C., KUNO T., MIZUNO M., TAKAHASHI S., KANMATSUSE K. Increased production of interleukin-1beta and interleukin-1 receptor antagonist by peripheral blood mononuclear cells in undialyzed chronic renal failure. Nephron. 1997;76:26–31. doi: 10.1159/000190136. [DOI] [PubMed] [Google Scholar]
- KLIN M., SMOGORZEWSKI M., KHILNANI H., MICHNOWSKA M., MASSRY S.G. Mechanisms of PTH-induced rise in cytosolic calcium in adult rat hepatocytes. Am. J. Physiol. 1994;267:G754–G763. doi: 10.1152/ajpgi.1994.267.5.G754. [DOI] [PubMed] [Google Scholar]
- KLIN M., SMOGORZEWSKI M., MASSRY S.G. Chronic renal failure increases cytosolic Ca2+ of hepatocytes. Am. J. Physiol. 1995;269:G103–G109. doi: 10.1152/ajpgi.1995.269.1.G103. [DOI] [PubMed] [Google Scholar]
- KLIN M., SMOGORZEWSKI M., NI Z., ZHANG G., MASSRY S.G. Abnormalities in hepatic lipase in chronic renal failure: role of excess parathyroid hormone. J. Clin. Invest. 1996;97:2167–2173. doi: 10.1172/JCI118657. [DOI] [PMC free article] [PubMed] [Google Scholar]
- KONISHI K. Pharmacokinetics of cefmenoxime in patients with impaired renal function and in those undergoing hemodialysis. Antimicrob. Agents Chemother. 1986;30:901–905. doi: 10.1128/aac.30.6.901. [DOI] [PMC free article] [PubMed] [Google Scholar]
- LAEMMLI U.K. Cleavage of structural proteins during the assembly of the head of bactgeriophage T4. Nature. 1970;227:680–685. doi: 10.1038/227680a0. [DOI] [PubMed] [Google Scholar]
- LEBER H.W., GLEUMES L., SCHUTTERLE G. Enzyme induction in the uremic liver. Kidney Int., Suppl. 1978. pp. S43–S48. [PubMed]
- LEBER H.W., SCHUTTERLE G. Oxidative drug metabolism in liver microsomes from uremic rats. Kidney Int. 1972;2:152–158. doi: 10.1038/ki.1972.85. [DOI] [PubMed] [Google Scholar]
- LEBLOND F.A., GIROUX L., VILLENEUVE J.P., PICHETTE V. Decreased in vivo metabolism of drugs in chronic renal failure [In Process Citation] Drug Metab. Dispos. 2000;28:1317–1320. [PubMed] [Google Scholar]
- LEBLOND F., GUEVIN C., DEMERS C., PELLERIN I., GASCON-BARRE M., PICHETE V. Downregulation of hepatic cytochrome P450 in chronic renal failure. J. Am. Soc. Nephrol. 2001;12:326–332. doi: 10.1681/ASN.V122326. [DOI] [PubMed] [Google Scholar]
- LOWRY O.H., ROSEBROUGH N.J., FARR A.L., RANDALL R.J. Protein measurement with the folin phenol reagent. J. Biol. Chem. 1951;193:265–275. [PubMed] [Google Scholar]
- MASSRY S.G., FADDA G.Z. Chronic renal failure is a state of cellular calcium toxicity. Am. J. Kidney Dis. 1993;21:81–86. doi: 10.1016/s0272-6386(12)80727-x. [DOI] [PubMed] [Google Scholar]
- MATZKE G.R., FRYE R.F. Drug administration in patients with renal insufficiency. Minimising renal and extrarenal toxicity. Drug Saf. 1997;16:205–231. doi: 10.2165/00002018-199716030-00005. [DOI] [PubMed] [Google Scholar]
- OETTINGER C.W., BLAND L.A., OLIVER J.C., ARDUINO M.J., MCALLISTER S.K., FAVERO M.S. The effect of uremia on tumor necrosis factor-alpha release after an in vitro whole-blood endotoxin challenge. J. Am. Soc. Nephrol. 1994;4:1890–1895. doi: 10.1681/ASN.V4111890. [DOI] [PubMed] [Google Scholar]
- OMURA T., SATO R. The carbon monoxide-binding pigment of liver microsomes. J. Biol. Chem. 1964;239:2370–2378. [PubMed] [Google Scholar]
- PATTERSON S.E., COHN V.H. Hepatic drug metabolism in rats with experimental chronic renal failure. Biochem. Pharmacol. 1984;33:711–716. doi: 10.1016/0006-2952(84)90451-9. [DOI] [PubMed] [Google Scholar]
- QING D.P., DING H., VADGAMA J., WU Y.Y., KOPPLE J.D. Elevated myocardial cytosolic calcium impairs insulin-like growth factor-1-stimulated protein synthesis in chronic renal failure. J. Am. Soc. Nephrol. 1999;10:84–92. doi: 10.1681/ASN.V10184. [DOI] [PubMed] [Google Scholar]
- SEGLEN P.O. Preparation of isolated rat liver cells. Methods Cell. Biol. 1976;13:29–83. doi: 10.1016/s0091-679x(08)61797-5. [DOI] [PubMed] [Google Scholar]
- SIDHU J.S., OMIECINSKI C.J. cAmp-associated inhibition of phenobarbital-inducible cytochrome P450 gene expression in primary rat hepatocyte cultures. J. Biol. Chem. 1995;270:12762–12773. doi: 10.1074/jbc.270.21.12762. [DOI] [PubMed] [Google Scholar]
- STENVINKEL P., HEIMBURGER O., PAULTRE F., DIXZFALUSY U., WANG T., BERGLUND L., JOGESTRAND T. Strong association between malnutrition, inflammation, and atherosclerosis in chronic renal failure. Kidney Int. 1999;55:1899–1911. doi: 10.1046/j.1523-1755.1999.00422.x. [DOI] [PubMed] [Google Scholar]
- SUNDER-PLASSMANN G., KAPIOTIS S., GASCHE C., KLAAR U. Functional characterization of cytokine autoantibodies in chronic renal failure patients. Kidney Int. 1994;45:1484–1488. doi: 10.1038/ki.1994.193. [DOI] [PubMed] [Google Scholar]
- TABURET A.M., VINCENT I., PERELLO L., CORET B., BAUNE B.Impairment of drug biotransformation in renal disease: an in vitro model Clin. Pharmacol. Ther. 199659136abstract [Google Scholar]
- TALBERT R.L. Drug dosing in renal insufficiency. J. Clin. Pharmacol. 1994;34:99–110. doi: 10.1002/j.1552-4604.1994.tb03973.x. [DOI] [PubMed] [Google Scholar]
- TERAO N., SHEN D.D. Reduced extraction of I-propranolol by perfused rat liver in the presence of uremic blood. J. Pharmacol. Exp. Ther. 1985;233:277–284. [PubMed] [Google Scholar]
- TINDBERG N., BALDWIN H.A., CROSS A.J., INGELMAN-SUNDBERG M. Induction of cytochrome P450 2E1 expression in rat and gerbil astrocytes by inflammatory factors and ischemic injury. Mol. Pharmacol. 1996;50:1065–1072. [PubMed] [Google Scholar]
- TOUCHETTE M.A., SLAUGHTER R.L. The effect of renal failure on hepatic drug clearance. DICP. 1991;25:1214–1224. doi: 10.1177/106002809102501111. [DOI] [PubMed] [Google Scholar]
- UCHIDA N., KURATA N., SHIMADA K., NISHIMURA Y., YASUDA K., HASHIMOTO M., UCHIDA E., YASUHARA H. Changes of hepatic microsomal oxidative drug metabolizing enzymes in chronic renal failure (CRF) rats by partial nephrectomy. Jpn. J. Pharmacol. 1995;68:431–439. doi: 10.1254/jjp.68.431. [DOI] [PubMed] [Google Scholar]
- VAN PEER A.P., BELPAIRE F.M. Hepatic oxidative drug metabolism in rats with experimental renal failure. Arch. Int. Pharmacodyn. Ther. 1977;228:180–183. [PubMed] [Google Scholar]
- ZIESCHE R., ROTH M., PAPAKONSTANTINOU E., NAUCK M., HORL W.H., KASHGARIAN M., BLOCK L.H. A granulocyte inhibitory protein overexpressed in chronic renal disease regulates expression of interleukin 6 and interleukin 8. Proc. Natl. Acad. Sci. U.S.A. 1994;91:301–305. doi: 10.1073/pnas.91.1.301. [DOI] [PMC free article] [PubMed] [Google Scholar]