

Abstract
We have investigated the effects of α1-adrenoceptor stimulation upon contractility, Ca2+ influx, inositol phosphate production, and protein kinase C (PKC) translocation in human cultured prostatic stromal cells (HCPSC).
The α1-adrenoceptor selective agonist phenylephrine elicited contractile responses of HCPSC, i.e. a maximal cell shortening of 45±6% of initial cell length, with an EC50 of 1.6±0.1 μM. The α1-adrenoceptor selective antagonists prazosin (1 μM) and terazosin (1 μM) both blocked contractions to phenylephrine (10 μM). The L-type calcium channel blocker nifedipine (10 μM), and the PKC inhibitors Gö 6976 (1 μM) and bisindolylmaleimide (1 μM) also inhibited phenylephrine-induced contractions.
Phenylephrine caused a concentration dependent increase in inositol phosphate production (EC50 119±67 nM). This response was blocked by terazosin (1 μM).
Phenylephrine caused the translocation of the PKC α isoform, but not the β, δ, γ, ε or λ isoforms, from the cytosolic to the particulate fraction of HCPSC, with an EC50 of 5.7±0.5 μM.
In FURA-2AM (5 μM) loaded cells, phenylephrine elicited concentration dependent increases in [Ca2+]i, with an EC50 of 3.9±0.4 μM. The response to phenylephrine (10 μM) was blocked by prazosin (1 μM), bisindolymaleimide (1 μM), and nifedipine (10 μM).
In conclusion, this study has shown that HCPSC express functional α1-adrenoceptors, and that the intracellular pathways responsible for contractility may be largely dependent upon protein kinase C activation and subsequent opening of L-type calcium channels.
Keywords: Human cultured prostatic stromal cells, α1-adrenoceptors, protein kinase C
Introduction
The human prostatic stroma consists of smooth muscle cells, myofibroblasts and fibroblasts (Janssen et al., 2000). Immunohistochemical and molecular studies of human prostatic tissue have demonstrated the presence of three α1-adrenoceptor subtypes, α1A, α1B and α1D (Walden et al., 1999), which are largely responsible for the control of smooth muscle tone (Hieble & Ruffolo, 1996). In many preparations, activation of α1-adrenoceptors will commonly, but not exclusively, stimulate phospholipase C to produce the second messengers diacylglycerol (DAG) and inositol trisphosphate (IP3) (Zhong & Minneman, 1999), leading to the activation of protein kinase C (PKC) and the release of IP3 sensitive calcium stores, respectively. In prostate tissue α1-adrenoceptor-mediated contractions are sensitive to intracellular Ca2+ release inhibitors and L-type calcium channel blockers (Eckert et al., 1995; Marshall et al., 1999), and have been anecdotally reported to be insensitive to the effects of PKC inhibitors (Marshall et al., 1999).
Several studies have shown that freshly dissociated prostatic myocytes and cultured prostatic stromal cells exhibit some of the same characteristics as preparations of intact prostate. Specifically, they respond to phenylephrine with contractions that are blocked by α1-adrenoceptor antagonists (Boesch et al., 2000; Corvin et al., 1998; Eckert et al., 1995), and also with an increase in [Ca2+]i (Eckert et al., 1995). Previous work from our laboratory has implicated PKC activation in the phorbol ester-mediated contractility of HCPSC (Haynes et al., 2002), however the role of PKC in the α1-adrenoceptor-mediated contractility of HCPSC remains equivocal (Eckert et al., 1995; Marshall et al., 1999).
This study investigated the role of PKC in the second messenger pathways utilized by α1-adrenoceptors in eliciting contractile responses of HCPSC.
Methods
Human prostatic tissue
Human prostatic tissue was obtained from patients (mean age 68 years) undergoing transurethral resection of the prostate to treat benign prostatic hyperplasia (BPH). Immediately following surgery, tissue was immersed in Dulbecco's modified Eagle's medium (DMEM) supplemented with foetal calf serum (FCS) (10% v v−1), penicillin (50 IU ml−1) and streptomycin (50 μg ml−1). The tissue was then chopped into 1–2 mm2 pieces in preparation for explant culture.
Primary explant cell culture
Cells were cultured from explants according to the method of Marsh & Hill, 1993. Briefly, cells were grown on tissue culture flasks in DMEM supplemented with FCS (10 v v−1), penicillin (50 IU ml−1) and streptomycin (50 μg ml−1) at 37°C (under 5% CO2). When confluent, cells were detached from the flask with 10% trypsin in versene solution. The resultant cell suspension was centrifuged at 150×g for 5 min. The pellet was then re-suspended in DMEM and split. Initially, both epithelial and stromal cells grew from the primary explant cultures. Following the first passage, however, the epithelial cells failed to re-attach to the culture flask, and were thus discarded. Prior to use, confluent cells were detached from the tissue culture vessel (using trypsin 10% in versene). Cells were plated into appropriate vessels and incubated in DMEM containing bovine serum albumin (0.1% w v−1) (SF) for 48–96 h. To minimize the effect of phenotypic change during long-term culture, cells were not used after passage 6.
Using monoclonal antibodies to smooth muscle myosin and prolyl-4-hydroxylase, our primary cell cultures have been shown to contain a mixed population of mainly smooth muscle cells, but also some fibroblasts and myofibroblasts (Haynes et al., 2001).
Contractility studies
Confluent cells were trypsinized (as above) and plated into 6–7 wells of a 24-well plate, coated with cell-tak® (5 μg cm−1, Becton Dickinson Inc., U.S.A., at a density of approximately 15 cells mm−1) as reported by Corvin et al. (1998), and incubated in SF media for 48 h. On the day of use, cells were washed with HEPES buffer (mM): NaCl 145; KCl 5; MgSO4 1; HEPES 10; D-glucose 10; CaCl2 2, at 37°C, pH 7.4, containing BSA (0.1% w v−1), and were then kept in 1 ml of this buffer for the duration of the experiment. Cells were viewed on an Olympus IX70 microscope, and video images were obtained with a Sony CCD-IRIS monochrome video camera attached to the microscope. Recording and analysis of images was via Metamorph® (Universal Imaging, U.S.A.). A new well of the same patient's cells was used for each observation, i.e. one well for the control observation, one well for phenylephrine 10 nM, one well for phenylephrine 100 nM, one well for phenylephrine 1 μM, etc. Fields of view were selected such that a minimum of five cells were clearly distinguishable in each well at 60×magnification. Once selected, a series of images were taken at 2 min intervals and a single concentration of agonist or vehicle was added after 10 min, with images acquired for a further 30 min. Antagonists and blockers were added to the cells 45–60 min prior to the equilibration period. Contractions were measured from the single cell providing the greatest response. Initial cell length was measured before agonist addition, and final cell length measured after 30 min exposure to the agonist. These results were then expressed as percentage reduction in initial cell length, or percentage contraction. Concentration–response curves were then constructed using the single point vehicle or drug addition recordings for each patient.
Inositol phosphate assays
This method is essentially a modification of that of Hall & Hill (1988). Confluent cells were trypsinized (as above), plated onto 12-well culture plates, and when 50–75% confluent, incubated in SF media for 48 h. On the day of use, cells were rinsed thrice with Earle's Balanced Salt Solution (EBSS) (mM): CaCl2 1.3; KCl 5.4; MgSO4 0.4; NaCl 116; NaHCO3 26; NaH2PO4 1; D-glucose 5.6, at 37°C, pH 7.4, before incubation for 75 min in EBSS containing [3H]-myo-inositol (0.5 μCi well−1) at 37°C, 5% CO2. This solution was removed and replaced with 2 ml of EBSS containing 20 mM LiCl. Antagonist drugs were added at this point, before a further 45–60 min incubation. Agonist drugs were added, and the cells incubated for a further 30 min. The reaction was terminated by the addition of 2 ml of an ice-cold 1 : 1 solution of methanol and HCl (1 M). Cells were frozen overnight at −70°C. Once thawed, samples were neutralized by addition of 1 ml of NaOH (1 M) and the [3H]-inositol phosphates separated out of the samples using columns packed with Dowex resin (X8 200–400 mesh, formate form). Free [3H]-inositol was removed by washing with 20–30 ml of distilled H2O, and total [3H]-inositol phosphates eluted with 3 ml of HCl (1 M). Tritium content was quantified by liquid scintillation counting.
Western blotting
Confluent cells were trypsinized (as above), plated onto 80 cm2 dishes, and incubated in SF media for 48 h. Cells were washed thrice with ice-cold phosphate buffered saline (PBS), drained and 100 μl of lysis buffer (mM): Tris pH 7.4, 10; EDTA 1; phenylmethylsulfonyl fluoride 0.5, containing glycerol 1%, and 50 μl protease inhibitor cocktail (Sigma, U.S.A.) was added. Cells were harvested by scraping from the dish surface and disrupted by passing through a 26 gauge needle 8–10 times. Samples for translocation studies were centrifuged at 95,000×g for 60 min at 4°C. The supernatant (cytosolic fraction) was collected, whilst the pellet was re-suspended in 50 μl PBS (particulate fraction). All samples were then assayed for protein content with the Coomassie blue protein assay. Samples were electrophoresed in a 7% SDS-polyacrylamide gel, before transfer to nitrocellulose membranes. Membranes were incubated in blocking solution (BSA 5% w v−1) for 60 min. Monoclonal primary antibodies were diluted in the blocking solution and incubated with the membranes overnight. Subsequently the membranes were washed repeatedly with Tris buffered saline solution (mM): Tris 20; NaCl 137, containing 3.8 ml HCl (1 M) and Tween-20 (0.1% v v−1), and then incubated for 60 min with a 1 : 5000 dilution of polyclonal goat anti-mouse IgG conjugated to horseradish peroxidase. Proteins were visualized by enhanced chemiluminescence, and developed onto Kodak Biomax ML film. The optical density of the protein bands, as visualized onto the film, was measured using Scion Image v3b (Scion Corp, MA, U.S.A.), and the area of each band multiplied the average density. The ratio of particulate : cytosolic fraction for each agonist concentration was calculated to give the translocation ratio.
Calcium imaging studies
Confluent cells were trypsinized (as above), plated onto glass coverslips and incubated in SF media for 48 h. The fluorophore, FURA-2AM (ICN Biochemicals, Australia) was diluted in HEPES buffer to a final concentration of 5 μM. Cells were incubated with the FURA 2AM solution for 40 min at room temperature and washed twice before a final incubation for 50–60 min in HEPES buffer at 37°C (to hydrolyze the acetoxymethylester). Cells were viewed with an Olympus IX70 microscope equipped witha Sensicam (PCO, GmbH) low-light camera. A monochromator (TILL Photonics, GmbH) was used to illuminate cells with light at 340 and 380 nm. Cell temperature was maintained at 37°C with a heated microscope stage. Axon Imaging Workbench v4.0 software was used to analyse the video images. Cell fluoresence emission at 510 nm was recorded over 1 s exposure every 15 s for the duration of the experiment. Background emission was subtracted from each image, and a ratio of the subsequent intensity values was recorded. A single concentration of agonist was added after a 10 min equilibration period, and remained in the well for 30 min. Antagonists and blockers were added to the well 50–60 min prior to drug addition. Average emission ratios were calculated over a 2 min period at 5, 10, 15, 20, 25 and 30 min after agonist addition. This data was standardized as a fraction of the average emission ratio during the 2 min period immediately preceding drug addition. Intracellular calcium concentration was calculated using the (Grynkiewicz et al., 1985) equation:
where β is the emission ratio (Rmin/Rmax at 380 nm. The dissocation constant (KD) value of 285 nM was taken from (Groden et al., 1991). The Rmin value was obtained in the absence of Ca2+ and in the presence of both 4-Br-A23187 (20 μM) and EGTA (10 mM). The Rmax was obtained in the presence of both 4-Br-A23187 (20 μM) and Ca2+ (10 mM). Using these Rmin and Rmax values, the resting [Ca2+]i concentration of HCPSC was approximately 108±15 nM (n=7).
Statistics
All results are presented as mean±s.e.mean from the cells of 4–8 individuals (unless otherwise stated). Statistical analysis was performed upon the raw data using Prism v3.0 (GraphPad Software, U.S.A.). Regression curves were fitted to concentration–response data with a P<0.05, tested by one-way ANOVA. EC50 values were calculated from the regression curve fitted to concentration–response data, using Prism v3.0 (GraphPad Software, U.S.A.). For some experiments data were analysed by One-way ANOVA with a post-hoc Dunnett's or Bonferroni's test as appropriate. In all cases, P<0.05 was considered significant.
Drugs and chemicals
Drugs and chemicals used were: phenylephrine, prazosin, terazosin, nifedipine, Tween-20 and Dulbecco's modified Eagle's medium (Sigma, St. Louis, U.S.A.). Bisindolymaleimide, FURA 2-AM and 4-Br-A23187 (ICM Biochemicals, Australia). Mouse anti-PKC antibodies (Transduction Laboratories, Kentucky, U.S.A.). Goat anti-mouse secondary-HRP antibody (DAKO, CA, U.S.A.). Nitrocellulose membrane, enhanced chemiluminescence reagents (Amersham, Buckinghamshire, U.K.). Western blot reagents (BioRad, CA, U.S.A.). All other chemicals were of analytical grade.
Results
Contractility studies
HCPSC exhibited very little spontaneous contractile activity. In the absence of any stimulus, cells spontaneously reduced by 9±3% of initial cell length (n=11). The α1-adrenoceptor selective agonist phenylephrine (10 nM–100 μM) elicited concentration dependent contractile responses of HCPSC, observed as reductions in initial cell length (a typical response shown in Figure 1a), with an EC50 approximately 1.6±0.1 μM (P<0.045, one-way ANOVA, n=8; Figure 1b).
Figure 1.
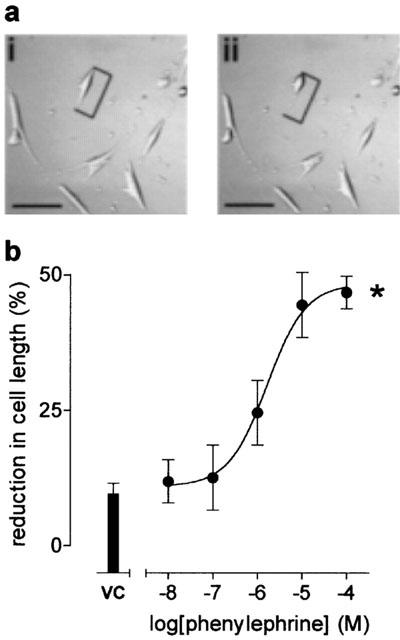
The effects of phenylephrine upon human cultured prostatic stromal cell contractility. Results are expressed as percentage reduction in initial cell length. (a) Shows a typical response to phenylephrine 10 μM, scale bar represents 200 μm and calipers indicate where cell length measurements were taken from, (i) immediately before agonist addition, and (ii) 30 min after agonist addition. (b) Shows the concentration–response curve to phenylephrine, (n=8). *Significant when compared to vehicle control, P<0.05; one-way ANOVA.
The α1-adrenoceptor selective antagonists prazosin (1 μM) and terazosin (1 μM) significantly blocked the response to phenylephrine (10 μM) (P<0.05, Bonferroni's test for both, n=6; Figure 2). In addition, these responses were blocked by the PKC inhibitors Gö 6976 (1 μM), and bisindolymaleimide (1 μM) (P<0.05, Bonferroni's test for both, n=6) and the L-type calcium channel blocker nifedipine (10 μM; P<0.05, Bonferroni's test, n=6) (Figure 3).
Figure 2.

The effects of the α1-adrenoceptor selective antagonists, prazosin and terazosin upon phenylephrine-stimulated contractility in human cultured prostatic stromal cells. Cells were incubated with either prazosin (1 μM), terazosin (1 μM) or vehicle control prior to the addition of phenylephrine (PE, 10 μM). In all cases n=6. †Significant when compared to vehicle control, P<0.05; Dunnett's test. *Significant when compared to phenylephrine (10 μM), P<0.05; Bonferroni's test.
Figure 3.
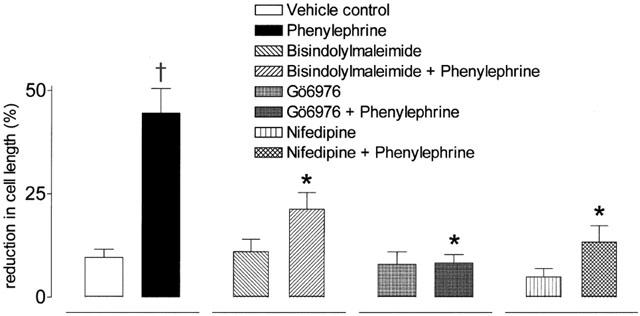
The effects of the protein kinase C inhibitors Gö 6976 and bisindolylmaleimide, and the L-type calcium channel blocker nifedipine upon phenylephrine-stimulated contractility in human cultrued prostatic stromal cells. Cells were incubated with either Gö 6976 (1 μM), bisindolymaleimide (1 μM), nifedipine (NIF, 10 μM) or vehicle control prior to the addition of phenylephrine (10 μM). In all cases n=6. †Significant when compared to vehicle control P<0.05; Dunnett's test. *Significant when compared to PE (10 μM), P<0.05; Bonferroni's test.
Inositol phosphate assays
Phenylephrine (10 nM–100 μM) increased inositol phosphate production in HCPSC, as observed by [3H]-myo-inositol assay, with an EC50 of 119±67 nM (P<0.05, one-way ANOVA, n=5; Figure 4). Terazosin (1 μM) blocked this response (P<0.05, One-way ANOVA, n=5; Figure 4).
Figure 4.

The effects of phenylephrine and terazosin upon [3H]-inositol phosphate accumulation in human cultured prostatic stromal cells. Cells were incubated with [3H]-myo-inositol and either terazosin 1 μM or vehicle control prior to the addition of phenylephrine (PE). In all cases n=5. *Significant when compared to vehicle control P<0.05; one-way ANOVA.
Translocation studies
Phenylephrine (100 nM–100 μM) caused a concentration-dependent translocation of PKCα from the cytosolic fraction to the particulate fraction of HCPSC (a typical response to phenylephrine at 100 μM is shown in Figure 5a), with an EC50 of 5.7±0.5 μM (P<0.05, one-way ANOVA, n=5; Figure 5b). Additionally, these experiments were repeated for PKC subtypes β, δ, γ, ε and λ, reported to be present in HCPSC (Haynes et al., 2002), but no translocation was observed.
Figure 5.
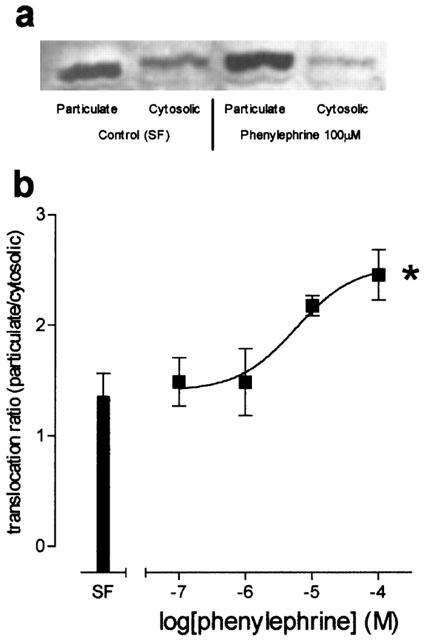
Shows the effects of phenylephrine upon PKC translocation in human cultured prostatic stromal cells. (a) Shows a typical Western blot, demonstrating translocation of protein kinase C α from cytosolic to particulate fractions in response to vehicle control or phenylephrine (100 μM). (b) Shows mean translocation ratio of protein kinase C α in response to PE (100 nM–100 μM). *Significantly different when compared to vehicle control, P<0.05; one-way ANOVA, n=4).
Calcium imaging studies
Basal [Ca2+]i of HCPSC was 108±15 nM (n=8), and in non-stimulated cells this baseline was fairly stable throughout the experiments (Figure 6a). Phenylephrine (up to 100 μM) elicited concentration dependent increases in [Ca2+]i in HCPSC (P<0.05, one-way ANOVA, n=6; Figure 6a,b). At 25 min after phenyleprhine addition, the EC50 of this response was 3.9±0.4 μM (Figure 6b). Prazosin (1 μM) and the PKC inhibitor bisindolymaleimide (1 μM) blocked the response to phenylephrine (10 μM) (P<0.05, one-way ANOVA, n=6; Figure 7a,b). The L-type calcium channel blocker nifedipine did not completely block the response to phenylephrine (10 μM) (P<0.05, one-way ANOVA, n=6; Figure 7c).
Figure 6.
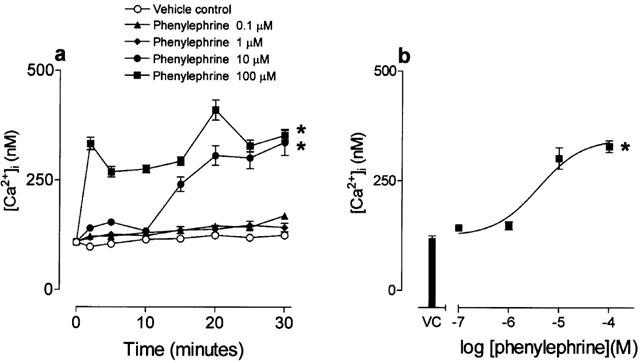
The effects of phenylephrine upon intracellular Ca2+ ([Ca2+]i) in human cultured prostatic stromal cells. Cells were incubated with the FURA-2AM (5 μM) prior to the addition of phenylephrine. (a) Shows mean changes in [Ca2+]i over 30 min, in response to phenylephrine. (b) Shows concentration–response curve showing changes in [Ca2+]i 25 min after the addition of phenylephrine. In all cases n=6. *Significantly different when compared to vehicle control P<0.05; one-way ANOVA.
Figure 7.
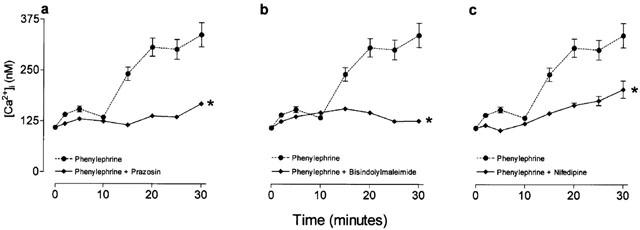
The effects of nifedipine, bisindolymaleimide and prazosin upon phenylephrine-stimulated increases in intracellular Ca2+ ([Ca2+]i) in human cultured prostatic stromal cells. Cells were incubated with the FURA-2AM (5 μM) prior to the addition of phenylephrine. Antagonists and blockers were added 45–60 min prior to the addition of phenylephrine. (a), (b) and (c) Show mean changes in [Ca2+]i over 30 min, in response to phenylephrine (10 μM), in the presence and absence of prazosin (1 μM), bisindolymaleimide (1 μM) and nifedipine (10 μM) respectively. *Significant when compared to phenylephrine (10 μM). P<0.05, Dunnett's test (n=6).
Discussion
The present study has demonstrated that HCPSC express functional α1-adrenoceptors capable of mediating cellular contraction, PKC translocation and increases in both IP3 production and [Ca2+]i. The finding that the contractile responses are dependent upon phenylephrine concentration and inhibited by α1-adrenoceptor antagonists is consistent with previous studies of human acutely dissociated and cultured prostatic stromal cells (Corvin et al., 1998; Eckert et al., 1995), and whole tissue (Hieble et al., 1985; Lepor et al., 1991; Marshall et al., 1995). These studies have reported that contractile responses of human prostate are concentration dependent, and have approximate EC50 values of 1.7 and 3.1 μM in response to noradrenaline (Hieble et al., 1985; Marshall et al., 1995 respectively), and 2.2 and 7.9 μM in response to phenylephrine (Lepor et al., 1994; Marshall et al., 1995 respectively). The EC50 for contractile responses of HCPSC to phenylephrine in this study was approximately 1.6 μM, demonstrating that these cells exhibit contractile responses to α1-adrenoceptor stimulation comparable to those observed in whole tissue studies. In this study we have further investigated the mechanisms underlying the contractility of HCPSC using the PKC inhibitors, bisindolymaleimide and Gö 6976, and the L-type calcium channel blocker, nifedipine. Phenylephrine mediated contractions were completely blocked by both PKC inhibitors and also by nifedipine, indicating that the response to phenylephrine is largely dependent upon the activation of PKC and the influx of Ca2+ through L-type calcium channels. The role of L-type calcium channels in mediating the majority of prostatic contractility is consistent with a previous study of acutely dispersed prostatic stromal cells (Eckert et al., 1995). However, Eckert et al. (1995) reported only anecdotal evidence for the activation of PKC by α1-adrenoceptors, whilst Marshall et al. (1999) suggested that prostatic contractility was insensitive to PKC blockers. The current finding that phenylephrine mediated contractions are almost completely blocked by the PKC inhibitors bisindolymaleimide and Gö 6976 demonstrates that phenylephrine activates PKC in HCPSC, as has been previously reported in other systems (Kwan & Qi, 1997; Lee & Severson, 1994).
Since the stimulation of the phospholipase C pathway commonly causes the release of IP3 (Berridge, 1993), we investigated the possibility that phenylephrine also stimulated inositol phosphate accumulation in HCPSC. In this study, phenylephrine elicited concentration dependent increases in the production of inositiol phosphates. That this effect was blocked by terazosin is consistent with the hypothesis that α1-adrenoceptors couple through PLC to stimulate IP3 and DAG production in these cells. Calcium release from intracellular stores as a result of IP3 production has been shown to occur quite rapidly, often eliciting a sharp spike in calcium concentration before the onset of a sustained plateau (Berridge, 1993; Burt et al., 1998; Eckert et al., 1995). However, our calcium imaging studies were not sensitive enough to show a significant Ca2+ spike associated with IP3 mediated Ca2+ release from intracellular stores. We think that this may be due to a relatively small accumulation of IP3 in HCPSC, since the total inositol phosphate pool only doubled in response to phenylephrine at 100 μM.
In addition to IP3 generation, stimulation of PLC generates DAG which is known to activate PKC, a ubiquitous enzyme with various cellular functions including modulation of neurotransmitter release, cell growth, proliferation, carcinogenesis, apoptosis, cell differentiation and contractility in other systems (Nishimura & van Breemen, 1989; Khalil & Morgan, 1993; Lee & Severson, 1994; Morgan & Leinweber, 1998; Savickiene et al., 1999; Watters & Parsons, 1999). There are 12 isoforms of PKC, classified into three subtypes: conventional PKC isoforms (cPKC), novel PKC isoforms (nPKC), and atypical PKC isoforms (aPKC). These subtypes are based on their varied requirements of DAG and Ca2+ for activation.
The cPKC isoforms, α, β1, β2, and γ, require both DAG and Ca2+ for activation, whilst the nPKC isoforms δ, ε, ζ, θ, and μ, require only DAG, and the aPKC isoforms λ, ι and ζ require neither DAG nor Ca2+ for activation (Webb et al., 2000). Previous studies from our laboratory has shown that the six PKC isoforms present in HCPSC are PKC α, β, δ, γ, ε and λ (Haynes et al., 2002), and translocation of PKC from the cytosolic to the particulate fraction is considered to be a marker of enzyme activation (Goekjian & Jirousek, 1999; Majewski & Iannazzo, 1998; Morgan & Leinweber, 1998; Nishimura & van Breemen, 1989). In this study, phenylephrine caused the translocation of PKC α, but not β, δ, γ, ε or λ, from the cytosolic to the particulate fraction of the cell, indicating that activation of α1-adrenoceptors stimulates only PKC α activity in HCPSC. Given that PKC α is a conventional PKC isoform, requiring both DAG and Ca2+ for activation, this finding provides further evidence to support the activation of the PLC second messenger pathway by prostatic α1-adrenoceptors. This finding is in contrast to that of Haynes et al. (2002), who demonstrated that phorbol esters elicited contractions and elevations of [Ca2+]i without any apparent translocation of PKC from cytosol to particulate fractions. However, the finding of the present study, that PKC translocation occurs in response to phenylephrine, is consistent with reports of agonist-stimulated PKC translocation in other cell types (Haller et al., 1998; Khalil & Morgan, 1993; Maruyama et al., 1999; Morgan & Leinweber, 1998).
The calcium imaging experiments performed in this study support the contractility data, as phenylephrine elicited contraction dependent increases in [Ca2+]i, susceptible to inhibition by prazosin. This is consistent with work by Eckert et al. (1995), who reported a concentration dependent increase in calcium current due to phenylephrine stimulation of acutely dissociated human prostatic smooth muscle cells. This is also observed in other cell models (Utz et al., 1999). Further imaging experiments demonstrated that both bisindolymaleimide and nifedipine blocked the elevation of [Ca2+]i by phenylephrine, findings consistent with the hypothesis that activation of PKC opens L-type calcium channels. This signal transduction pathway has been suggested to be responsible for mediating effects in various other cells systems (Burt et al., 1998; Furukawa et al., 1995; Lin et al., 1998; Obejero-Paz et al., 1998; Thieme et al., 1999). It is however possible that PKC elicits some effects through other mechanisms, such as smooth muscle calponin (Walsh et al., 1996), caldesmon (Throckmorton et al., 1998), or mitogen activated protein kinases (Khalil & Morgan, 1993; Kim et al., 2000). These possibilities warrant further investigation.
This current study has shown that HCPSC respond to phenylephrine with contractions and Ca2+ influx that can be blocked by prazosin, terazosin, bisindolylmaleimide, Gö 6976 and nifedipine. Furthermore, phenylephrine also stimulates IP3 production and the translocation of PKC α from the cytosolic to the particulate fraction of HCPSC. Together these data indicate the activation of HCPSC α1-adrenoceptors stimulates PLC, producing IP3 and DAG, leading to the translocation of PKC α and the subsequent opening of L-type calcium channels. This hypothesis is consistent with the concept of multiple second-messenger pathways controlling contractility in smooth muscle systems (Burt et al., 1998; Lee & Severson, 1994; Nishimura & van Breemen, 1989). This is the first study to demonstrate that α1-adrenoceptor activation leads to the exclusive translocation and subsequent activation of PKC α in HCPSC, and suggests that prostatic contractility may be largely dependent upon protein kinase Cα activation and subsequent opening of L-type calcium channels.
Acknowledgments
We would like to thank the staff of Monash Medical Center, Moorabbin for their co-operation. This work was approved by the Southern Healthcare Network Human Ethics and Experimentation Committee, and supported by the National Health and Medical Research Council (grant ID 118611), the MAWA Trust, and the William Buckland Foundation.
Abbreviations
- BPH
Benign prostatic hyperplasia
- DMEM
Dulbecco's modified Eagle's medium
- FCS
foetal calf serum
- HCPSC
human cultured prostatic stromal cells
- PKC
protein kinase C
References
- BERRIDGE M.J. Cell signalling. A tale of two messengers. Nature. 1993;365:388–389. doi: 10.1038/365388a0. [DOI] [PubMed] [Google Scholar]
- BOESCH S.T., DOBLER G., RAMONER R., CORVIN S., THURNHER M., BARTSCH G., KLOCKER H. Effects of alpha 1-adrenoceptor antagonists on cultured prostatic smooth muscle cells. Prostate Suppl. 2000;9:34–41. doi: 10.1002/1097-0045(2000)45:9+<34::aid-pros8>3.0.co;2-y. [DOI] [PubMed] [Google Scholar]
- BURT R.P., CHAPPLE C.R., MARSHALL I. Alpha1A-adrenoceptor mediated contraction of rat prostatic vas deferens and the involvement of ryanodine stores and Ca2+ influx stimulated by diacylglycerol and PKC. Br. J. Pharmacol. 1998;123:317–325. doi: 10.1038/sj.bjp.0701588. [DOI] [PMC free article] [PubMed] [Google Scholar]
- CORVIN S., BOSCH S.T., EDER I., THURNHER M., BARTSCH G., KLOCKER H. Videoimaging of prostatic stromal-cell contraction: an in vitro model for studying drug effects. Prostate. 1998;37:209–214. doi: 10.1002/(sici)1097-0045(19981201)37:4<209::aid-pros1>3.0.co;2-u. [DOI] [PubMed] [Google Scholar]
- ECKERT R.E., SCHREIER U., DRESCHER P., MADSEN P.O., DEROUET H., BECHT E., STEFFENS J., ZIEGLER M. Regulation of prostatic smooth muscle contractility by intracellular second messengers: implications for the conservative treatment of benign prostatic hyperplasia. Urol Int. 1995;54:6–21. doi: 10.1159/000282685. [DOI] [PubMed] [Google Scholar]
- FURUKAWA K., ROSARIO D.J., SMITH D.J., CHAPPLE C.R., UCHIYAMA T., CHESS-WILLIAMS R. Alpha 1A-adrenoceptor-medited contractile responses of the human vas deferens. Br. J. Pharmacol. 1995;116:1605–1610. doi: 10.1111/j.1476-5381.1995.tb16380.x. [DOI] [PMC free article] [PubMed] [Google Scholar]
- GOEKJIAN P.G., JIROUSEK M.R. Protein kinase C in the treatment of disease: signal transduction pathways, inhibitors, and agents in development. Curr. Med. Chem. 1999;6:877–903. [PubMed] [Google Scholar]
- GRODEN D.L., GUAN Z., STOKES B.T. Determination of Fura-2 dissociation constants following adjustment of the apparent Ca-EGTA association constant for temperature and ionic strength. Cell Calcium. 1991;12:279–287. doi: 10.1016/0143-4160(91)90002-v. [DOI] [PubMed] [Google Scholar]
- GRYNKIEWICZ G., POENIE M., TSIEN R.Y. A new generation of Ca2+ indicators with greatly improved fluoresence properties. J. Biol. Chem. 1985;260:3440–3450. [PubMed] [Google Scholar]
- HALL I.P., HILL S.J. Beta-adrenoceptor stimulation inhibits histamine-stimulated inositol phospholipid hydrolysis in bovine tracheal smooth muscle. Br. J. Pharmacol. 1988;95:1204–1212. doi: 10.1111/j.1476-5381.1988.tb11757.x. [DOI] [PMC free article] [PubMed] [Google Scholar]
- HALLER H., LINDSHAU C., MAASCH C., OLTHOFF H., KURSCHEID D., LUFT F.C. Integrin-induced protein kinase Calpha and Cepsilon translocation to focal adhesions mediates vascular smooth muscle cell spreading. Circ. Res. 1998;82:157–165. doi: 10.1161/01.res.82.2.157. [DOI] [PubMed] [Google Scholar]
- HAYNES J.M., FRYDENBERG M., MAJEWSKI H. Testosterone- and phorbol ester-stimulated proliferation in human cultured prostatic stromal cells. Cell Signal. 2001;13:703–709. doi: 10.1016/s0898-6568(01)00205-4. [DOI] [PubMed] [Google Scholar]
- HAYNES J.M., IANNAZZO L., MAJEWSKI H. Phorbol ester-induced contractility and Ca2+ influx in human cultured prostatic stromal cells. Biochem. Pharmacol. 2002;64:385–392. doi: 10.1016/s0006-2952(02)01211-x. [DOI] [PubMed] [Google Scholar]
- HIEBLE J.P., CAINE M., ZALAZNIK E. In vitro characterization of the alpha-adrenoceptors in human prostate. Eur. J. Pharmacol. 1985;107:111–117. doi: 10.1016/0014-2999(85)90048-2. [DOI] [PubMed] [Google Scholar]
- HIEBLE J.P., RUFFOLO R.R., JR The use of alpha-adrenoceptor antagonists in the pharmacological management of benign prostatic hypertrophy: an overview. Pharmacol. Res. 1996;33:145–160. doi: 10.1006/phrs.1996.0022. [DOI] [PubMed] [Google Scholar]
- JANSSEN M., ALBRECHT M., MOSCHLER O., RENNEBERG H., FRITZ B., AUMULLER G., KONRAD L. Cell lineage characteristics of human prostatic stromal cells cultured in vitro. Prostate. 2000;43:20–30. doi: 10.1002/(sici)1097-0045(20000401)43:1<20::aid-pros4>3.0.co;2-6. [DOI] [PubMed] [Google Scholar]
- KHALIL R.A., MORGAN K.G. PKC-mediated redistribution of mitogen-activated protein kinase during smooth muscle cell activation. Am. J. Physiol. 1993;265:C406–C411. doi: 10.1152/ajpcell.1993.265.2.C406. [DOI] [PubMed] [Google Scholar]
- KIM I., JE H.D., GALLANT C., ZHAN Q., RIPER D.V., BADWEY J.A., SINGER H.A., MORGAN K.G. Ca2+ calmodulin-dependent protein kinase II-dependent activation of contractility in ferret aorta. J. Physiol. 2000;526 Pt 2:367–374. doi: 10.1111/j.1469-7793.2000.00367.x. [DOI] [PMC free article] [PubMed] [Google Scholar]
- KWAN Y.W., QI A.D. Inhibition by extracellular ATP of L-type calcium channel currents in guinea-pig single sinoatrial nodal cells: involvement of protein kinase C. Can. J. Cardiol. 1997;13:1202–1211. [PubMed] [Google Scholar]
- LEE M.W., SEVERSON D.L. Signal transduction in vascular smooth muscle: diacylglycerol second messengers and PKC action. Am. J. Physiol. 1994;267:C659–C678. doi: 10.1152/ajpcell.1994.267.3.C659. [DOI] [PubMed] [Google Scholar]
- LEPOR H., GUP D.I., BAUMANN M., SHAPIRO E. Comparison of alpha 1 adrenoceptors in the prostate capsule of men with symptomatic and asymptomatic benign prostatic hyperplasia. Br. J. Urol. 1991;67:493–498. doi: 10.1111/j.1464-410x.1991.tb15193.x. [DOI] [PubMed] [Google Scholar]
- LEPOR H., ZHANG W., KOBAYASHI S., TANG R., WANG B., SHAPIRO E. A comparison of the binding and functional properties of alpha-1 adrenoceptors and area density of smooth muscle in the human, canine and rat prostates. J. Pharmacol. Exp. Ther. 1994;270:722–772. [PubMed] [Google Scholar]
- LIN J.J., LIU S.H., LIN-SHIAU S.Y. Phorbol ester-induced contractions of mouse detrusor muscle are inhibited by nifedipine. Naunyn Schmiedebergs Arch. Pharmacol. 1998;357:553–557. doi: 10.1007/pl00005207. [DOI] [PubMed] [Google Scholar]
- MAJEWSKI H., IANNAZZO L. Protein kinase C: a physiologial mediator of enhanced transmitter output. Prog. Neurobiol. 1998;55:463–475. doi: 10.1016/s0301-0082(98)00017-3. [DOI] [PubMed] [Google Scholar]
- MARSH K.A., HILL S.J. Characteristics of the bradykinin-induced changes in intracellular calcium ion concentration of single bovine tracheal smooth muscle cells. Br. J. Pharmacol. 1993;110:29–35. doi: 10.1111/j.1476-5381.1993.tb13767.x. [DOI] [PMC free article] [PubMed] [Google Scholar]
- MARSHALL I., BURT R.P., CHAPPLE C.R. Noradrenaline contractions of human prostate mediated by alpha 1A-(alpha1c-) adrenoceptor subtype. Br. J. Pharmacol. 1995;115:781–786. doi: 10.1111/j.1476-5381.1995.tb15001.x. [DOI] [PMC free article] [PubMed] [Google Scholar]
- MARSHALL I., BURT R.P., CHAPPLE C.R.Signal transduction pathways associated with alpha1-adrenoceptor subtypes in cells and tissues including human prostate Eur. Urol. 19993642–47.discussion 65 [DOI] [PubMed] [Google Scholar]
- MARUYAMA Y., SAKAI Y., NOBE K., MOMOSE K. Subcellular distribution of protein kinase C isoforms in gastric antrum smooth muscle of STZ-induced diabetic rats. Life Sci. 1999;64:1933–1940. doi: 10.1016/s0024-3205(99)00138-1. [DOI] [PubMed] [Google Scholar]
- MORGAN K.G., LEINWEBER B.D. PKC-dependent signalling mechanisms in differentiated smooth muscle. Acta Physiol. Scand. 1998;164:495–505. doi: 10.1046/j.1365-201X.1998.00445.x. [DOI] [PubMed] [Google Scholar]
- NISHIMURA J., VAN BREEMEN C. Direct regulation of smooth muscle contractile elements by second messengers. Biochem. Biophys Res. Commun. 1989;163:929–935. doi: 10.1016/0006-291x(89)92311-5. [DOI] [PubMed] [Google Scholar]
- OBEJERO-PAZ C.A., AUSLENDER M., SCARPA A. PKC activity modulates availability and long openings of L-type Ca2+ channels in A7r5 cells. Am. J. Phsyiol. 1998;275:C535–C543. doi: 10.1152/ajpcell.1998.275.2.C535. [DOI] [PubMed] [Google Scholar]
- SAVICKIENE J., GINEITIS A., STIGBRAND T. Modulation of apoptosis of proliferating and differentiating HL-60 cells by protein kinase inhibitors: suppression of PKC or PKA differently affects cell differentiation and apoptosis. Cell Death Differ. 1999;6:698–709. doi: 10.1038/sj.cdd.4400541. [DOI] [PubMed] [Google Scholar]
- THIEME H., NASS J.U., NUSKOVSKI M., BECHRAKIS N.E., STUMPFF F., STRAUSS O., WIEDERHOLT M. The effects of protein kinase C on trabecular meshwork and ciliary muscle contractility. Invest. Ophthalmol. Vis. Sci. 1999;40:3254–3261. [PubMed] [Google Scholar]
- THROCKMORTON D.C., PACKER C.S., BROPHY C.M. Protein kinase C activation during Ca2+-independent vascular smooth muscle contraction. J. Surg. Res. 1998;78:48–53. doi: 10.1006/jsre.1998.5368. [DOI] [PubMed] [Google Scholar]
- UTZ J., ECKERT R., TRAUTWEIN W. Changes of intracellular calcium concentrations by phenylephrine in renal arterial smooth muscle cells. Pflugers Arch. 1999;438:725–731. doi: 10.1007/s004249900091. [DOI] [PubMed] [Google Scholar]
- WALDEN P.D., GERARDI C., LEPOR H. Localization and expression of the alpha1A-1, alpha1B and alpha1D-adrenoceptors in hyperplastic and non-hyperplastic human prostate. J. Urol. 1999;161:635–640. [PubMed] [Google Scholar]
- WALSH M.P., HOROWITZ A., CLEMENT-CHOMIENNE O., ANDREA J.E., ALLEN B.G., MORGAN K.G. Protein kinase C mediation of Ca(2+)-independent contractions of vascular smooth muscle. Biochem. Cell Biol. 1996;74:485–502. doi: 10.1139/o96-053. [DOI] [PubMed] [Google Scholar]
- WATTERS D.J., PARSONS P.G. Critical targets of protein kinase C in differentiation of tumour cells. Biochem. Pharmacol. 1999;58:383–388. doi: 10.1016/s0006-2952(99)00063-5. [DOI] [PubMed] [Google Scholar]
- WEBB B.L., HIRST S.J., GIEMBYCZ M.A.Protein kinse C isoenzymes: a review of their structure, regulation and role in regulating airways smooth muscle tone and mitogenesis Br. J. Pharmacol. 20001301433–1452.[In Process Citation] [DOI] [PMC free article] [PubMed] [Google Scholar]
- ZHONG H., MINNEMAN K.P. Alpha1-adrenoceptor subtypes. Eur. J. Pharmacol. 1999;375:261–276. doi: 10.1016/s0014-2999(99)00222-8. [DOI] [PubMed] [Google Scholar]