Abstract
Factors influencing agonist affinity and relative efficacy have been studied for the 5-HT1A serotonin receptor using membranes of CHO cells expressing the human form of the receptor and a series of R-and S-2-(dipropylamino)tetralins (nonhydroxylated and monohydroxylated (5-OH, 6-OH, 7-OH, 8-OH) species).
- Ligand binding studies were used to determine dissociation constants for agonist binding to the 5-HT1A receptor:
- Ki values for agonists were determined in competition versus the binding of the agonist [3H]-8-OH DPAT. Competition data were all fitted best by a one-binding site model.
- Ki values for agonists were also determined in competition versus the binding of the antagonist [3H]-NAD-199. Competition data were all fitted best by a two-binding site model, and agonist affinities for the higher (Kh) and lower affinity (Kl) sites were determined.
The ability of the agonists to activate the 5-HT1A receptor was determined using stimulation of [35S]-GTPγS binding. Maximal effects of agonists (Emax) and their potencies (EC50) were determined from concentration/response curves for stimulation of [35S]-GTPγS binding.
Kl/Kh determined from ligand binding assays correlated with the relative efficacy (relative Emax) of agonists determined in [35S]-GTPγS binding assays. There was also a correlation between Kl/Kh and Kl/EC50 for agonists determined from ligand binding and [35S]-GTPγS binding assays.
Simulations of agonist binding and effect data were performed using the Ternary Complex Model in order to assess the use of Kl/Kh for predicting the relative efficacy of agonists.
Keywords: 5-HT1A serotonin receptor, ligand binding, [35S]-GTPγS binding, agonists, relative efficacy, models
Introduction
The activation of G-protein-coupled receptors by agonists depends on the binding of the agonist to the receptor and the subsequent stabilisation of a complex of agonist/receptor/G protein (the ternary complex, reviewed in Kenakin, 1993). There is, however, little detailed knowledge as to how the interaction of ligands with receptors leads to their activation. This has been studied for the adrenoreceptors and dopamine receptors by making mutations in residues at the ligand binding site that are thought to contact ligands (see for example Strader et al., 1994, Strange, 1996a,1996b; Ballesteros et al., 2001b). These studies have highlighted important electrostatic interactions between the cationic amino group of ligands and an aspartic acid residue in the third membrane spanning α-helix (TMIII), hydrophobic interactions between aromatic moieties of the ligand and residues in TMVI, and hydrogen bond interactions between hydroxyl groups of ligands and serine residues in TMV.
A complementary method for analysing these interactions is to examine series of ligands with similar structures and defined changes in the functional groups. The affinity with which ligands bind to the receptors may be determined using radioligand binding studies. The relative efficacy and potency of ligands for receptor activation may be determined using a variety of assays, but a very useful method for receptors that couple to Gi/o proteins is to analyse the activation of G proteins by determining agonist stimulation of [35S]-GTPγS binding.
For the D2 dopamine receptor, using these methods it has been possible to probe the interactions made by agonists in binding to the receptor and in its activation (Payne et al., 2002). Using a homologous series of hydroxylated 2-(dipropylamino)tetralin (DPAT) ligands, it was found that hydroxyl groups on these agonists served to determine both potency and efficacy of ligands, and this may reflect important interactions with TMV (Payne et al., 2002). Compounds lacking hydroxyl groups behaved as full agonists so that for these compounds the principal interactions with the receptor are likely to be with residues in TMIII and TMVI (Payne et al., 2002). This is consistent with studies on rhodopsin and the β2 adrenoreceptor, where it has been shown that the principal conformational change that occurred upon activation of these proteins was between TMIII and TMVI (Farrens et al., 1996; Ballesteros et al., 2001a).
The 5-HT1A serotonin receptor is an important site of action of the neurotransmitter serotonin and may be important for the actions of novel anxiolytics and antipsychotics. The determinants of ligand affinity and efficacy have been less well defined for the 5-HT1A serotonin receptor. Mutagenesis studies have been performed on some of the residues that might interact with ligands such as Asp 82 in TMIII and Ser 198 and Thr 199 in TMV (Ho et al., 1992; Chanda et al., 1993). Although the results suggest that these residues may be important for ligand interaction, the characterisation was performed using radiolabelled agonists; hence it is difficult to distinguish effects of the mutations on the binding of ligands and on the conformational changes involved in agonist binding and coupling to G proteins.
Agonist binding studies have, for several G-protein-coupled receptors, also provided valuable information on models of receptor activation. For many G-protein-coupled receptors, agonist binding curves may be resolved into two classes of sites (higher and lower affinity, see for example De Lean et al., 1980; Wreggett & De Lean, 1984). The occurrence of the higher affinity site depends on receptor/G protein coupling, and it has been proposed that the ratio of dissociation constants of the agonist for the lower and higher affinity sites (Kl/Kh ratio) may provide a measure of the ability of an agonist to stabilise the ternary complex and hence its relative efficacy. In principle, this enables the relative efficacy of the agonist to be predicted from ligand binding experiments. This has been tested for several G-protein-coupled receptors including the 5-HT1A serotonin receptor. In some cases correlations are seen between the Kl/Kh ratio and relative efficacy values of agonists (see for example De Lean et al., 1980; Evans et al., 1985; Fitzgerald et al., 1999), but not in other studies (Sibley & Creese, 1983; Fisher et al., 1984; Gardner et al., 1997; Gardner & Strange, 1998).
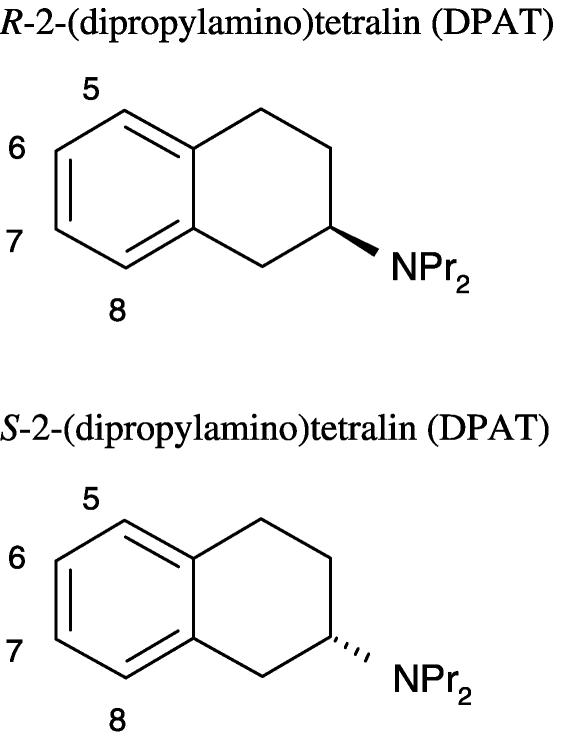
In the present report, therefore, we have tested a series of homologous hydroxylated 2-(dipropylamino)tetralins (Figure 1) for their ability to bind to the human 5-HT1A serotonin receptor expressed in CHO cells (CHO-5-HT1A cells) and to activate it as assessed using [35S]-GTPγS binding. The binding of these ligands has been determined in competition versus [3H]-8-OH DPAT and [3H]-NAD-199. [3H]-8-OH DPAT is an agonist radioligand that has been shown to label the 5-HT1A receptor coupled to G proteins (Newman-Tancredi et al., 1992). [3H]-NAD-199 is an antagonist radioligand that has been shown to label the free and G-protein-coupled forms of the 5-HT1A receptor (Jerning et al., 1998; Malmberg & Strange, 2000). The use of the two radioligands enables estimates of agonist affinity to be made at the higher and lower affinity sites. These ligand binding data have been used in the present report together with functional studies using [35S]-GTPγS binding to assess the nature of agonist interactions with the receptor and to assess the use of the Kl/Kh ratio as a predictor of the relative efficacy of agonists.
Figure 1.
Structures of compounds used. The unhydroxylated and the 5-OH, 6-OH, 7-OH, 8-OH DPAT molecules are used in both the R- and S-series.
Methods
Chemicals
[3H]-8-OH-DPAT (7.4–8.9 TBq mmol−1) and [35S]-GTPγS (37–55 TBq mmol−1) were from Amersham Pharmacia (Amersham, U.K.) and [3H]-NAD-199 (0.81 TBq mmol−1) was a generous gift from AstraZeneca (Sodertalje, Sweden). The 2-(dipropylamino)tetralins were synthesised in Uppsala, Sweden. Dithiothreitol, GDP, L-glutamine, HEPES, RPMI 1640 medium and serotonin were obtained from Sigma Chemical Company (Poole, Dorset, U.K.). Foetal bovine serum was from Life Technologies Ltd. (Paisley, U.K.). Phosphate buffers and salts (NaCl, KCl, MgSO4) were obtained from Merck Ltd (Lutterworth, Leicestershire, U.K.).
Cell culture and membrane preparation
CHO-5-HT1A cells (derived as described in Newman-Tancredi et al., 1992) were grown in RPMI 1640 medium supplemented with 2 mM L-glutamine and 10% foetal bovine serum (v/v) in a humidified atmosphere of 5% CO2 at 37°C. Cell membranes were prepared when cells reached confluency in 175 cm2 flasks, essentially as described by Castro & Strange (1993). Briefly, cells were washed with 5 ml ice-cold HEPES buffer (20 mM HEPES, 5 mM MgSO4, pH 7.4). Cells were removed from the flask surface by gentle agitation with glass beads (2 mm diameter) and 5 ml HEPES buffer and homogenised using 30 up–down strokes of a Dounce homogeniser. The homogenate was centrifuged at 1700 × g for 10 min at 4°C, and the resulting supernatant was centrifuged at 48000 × g for 1 h at 4°C. The pellet was resuspended in HEPES buffer at a protein concentration of approximately 4 mg ml−1 (determined by the method of Lowry et al., 1951) and stored in aliquots at −70°C.
[3H]-8-OH-DPAT binding assays
For saturation analyses, cell membranes (25 μg) were incubated in triplicate with [3H]-8-OH-DPAT (0.025–10 nM) in a final volume of 1 ml HEPES buffer (20mM HEPES, 5mM MgSO4, pH 7.4 containing 0.1 mM dithiothreitol) for 2.5 h at 25°C. Nonspecific binding was determined in the presence of 10 μM serotonin for each [3H]-8-OH-DPAT concentration. For competition binding assays, cell membranes (25 μg) were incubated with 0.25 nM [3H]-8-OH-DPAT and competing ligand in a final volume of 1 ml HEPES buffer (as above) and nonspecific binding was determined in the presence of 10 μM serotonin. The assays were terminated by rapid filtration (through Whatman GF/C filters, Whatman International Ltd, Maidstone, Kent, U.K.) using a Brandel cell harvester followed by four washes with 4 ml of ice-cold phosphate-buffered saline (0.14 M NaCl, 3 mM KCl, 1.5 mM KH2PO4, 5 mM Na2HPO4, pH 7.4). Filters were soaked in 2 ml scintillation fluid (Optiphase Hisafe 3, Wallac UK Ltd, Milton Keynes, Bucks, U.K.) for at least 6 h and radioactivity was determined by liquid scintillation spectrometry.
[3H]-NAD-199 binding assays
[3H]-NAD-199 binding was carried out in an identical HEPES buffer to that for [3H]-8-OH-DPAT binding. For saturation analyses, cell membranes (15 μg) were incubated in triplicate with [3H]-NAD-199 (0.025–10 nM) in a final volume of 1 ml for 2.5 h at 25°C. Nonspecific binding was determined in triplicate for each concentration of [3H]-NAD-199 by the inclusion of 10 μM serotonin. For competition assays, cell membranes (7–15 μg, depending on Bmax to maintain bound radioligand at less than 10% of the total) were incubated with 0.5 nM [3H]-NAD-199 and competing ligand in triplicate as described above. Assays were terminated and radioactivity was determined as for [3H]-8-OH-DPAT-binding assays.
[35S]-GTPγS binding assays
[35S]-GTPγS binding assays were carried out essentially as described by Gardner et al. (1996). Cell membranes (12.5–20 μg) were preincubated in triplicate in HEPES buffer (20 mM HEPES, 10 mM MgCl2, 100 mM NaCl, pH 7.4) containing 0.1 mM dithiothreitol, 1 μM GDP and ligands in a volume of 0.9 ml for 30 min at 30°C. Following this preincubation, 100 μl of [35S]-GTPγS was added to give a final concentration of 100 pM [35S]-GTPγS, and the reaction mixture was incubated for a further 30 min at 30°C. The assay was terminated and bound radioactivity was determined as described for [3H]-8-OH-DPAT assays.
Simulations of agonist binding and receptor activation using the Ternary Complex Model
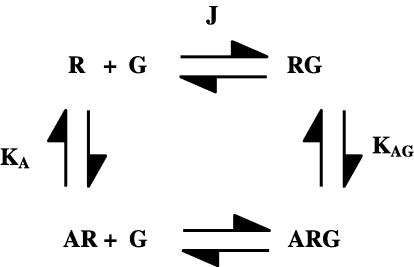
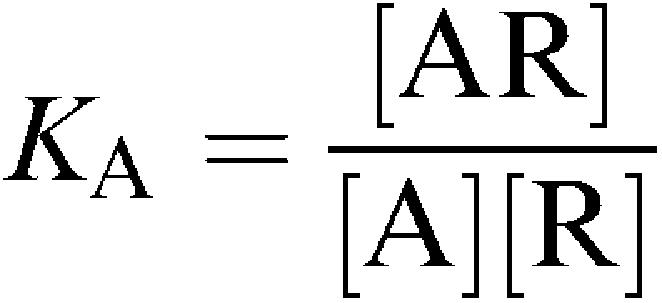
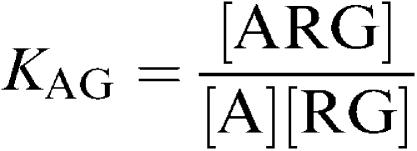
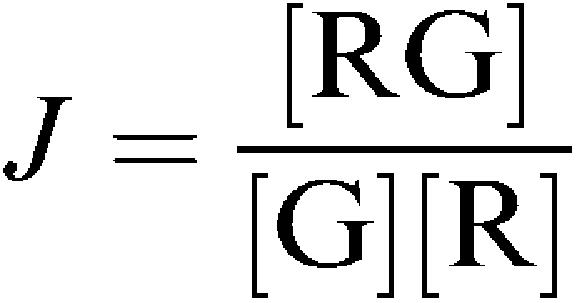
The Ternary Complex Model (Figure 2) was used to simulate agonist binding and agonist activity curves. The model assumes association constants (KA and KAG) for agonist binding to the uncoupled and coupled forms of the receptor and an equilibrium constant (J) for the interaction of R and G. It assumes that receptor activity is determined by the amounts of RG and ARG present.
Figure 2.
Ternary Complex Model for the interaction of a receptor (R) and a G protein (G) and the binding of an agonist (A) to the receptor. The model is described in detail in the Methods section.
For the model in Figure 2, the following equations may be written:
 |
If Rt and Gt are the total concentrations of receptor and G protein, respectively, then we may write
 |
Hence
 |
These equations may be simplified by writing:
 |
Then
 |
solving these equations for [G] and taking the positive root gives
 |
where
 |
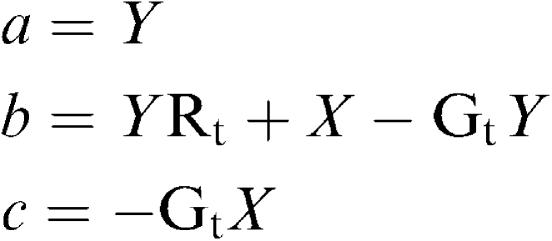
The concentration of bound agonist [Abound] is then given by the equation
 |
Hence
 |
For agonist activation of receptor, it was assumed that the response depended linearly on [RG]+[ARG]. The maximum response in the system will then be given when [RG]+[ARG]=[Rt].
Hence the fractional response (E) in the presence of agonist [A] is
Simulations were performed in Excel with either a fixed value of KA and varying values of KAG or a fixed value of KAG and varying values of KA to simulate agonists with different abilities to stabilise the RG state. The simulated data obtained and the parameters assumed are given in the Results section. Values for Kl and Kh were derived from the simulated agonist binding curves (Abound) by fitting in GraphPad Prism 3.0 (GraphPad Software, San Diego, CA, U.S.A.). Values for EC50 and Emax (as a percentage of the maximum system response) were derived from the simulated agonist activity curves (E) by fitting in Prism. These values are given in Table 5.
Table 5.
Simulations of agonist binding and receptor activation using the Ternary Complex Model
| Simulation 1 | ||||||||
| log KAG | ||||||||
| 8 | 7.522 | 7 | 6.699 | 6.522 | 6.301 | 6 | ||
| %Emax | 99 | 97 | 91 | 85 | 80 | 72 | 58 | |
| EC50 | 682 | 1985 | 6014 | 10,780 | 14,800 | 21,340 | 33,050 | |
| Kl/Kh | 152.9 | 54.8 | 19.0 | 10.9 | 7.9 | 5.5 | 3.5 | |
| Kl | 89,580 | 88,190 | 86,650 | 86,980 | 88,080 | 89,330 | 91,360 | |
| Kl/EC50 | 131.3 | 44.4 | 14.4 | 8.1 | 6.0 | 4.2 | 2.8 | |
| Simulation 2 | ||||||||
| log KA | ||||||||
| 3.903 | 4.477 | 4.903 | 5.176 | 5.398 | 5.602 | 5.903 | 6.301 | |
| %Emax | 99 | 97 | 93 | 88 | 82 | 75 | 63 | 43 |
| EC50 | 684 | 661 | 616 | 566 | 514 | 456 | 361 | 237 |
| Kl/Kh | 189 | 54.7 | 23.1 | 13.6 | 9.1 | 6.4 | 3.9 | 2.4 |
| Kl | 113,100 | 29,200 | 108,20 | 5841 | 3530 | 2214 | 1161 | 467 |
| Kl/EC50 | 165 | 44.2 | 17.6 | 10.3 | 6.9 | 4.9 | 3.2 | 2.0 |
Simulations were performed for the Ternary Complex Model as described in the Methods section and in the legend to Figure 6. Values for Kl and Kh were determined from simulated ligand binding data, and values for EC50 and Emax were determined from simulated response data. Kl and EC50 are given in nM.
Data analysis
Radioligand binding data were analysed by nonlinear regression analysis using Prism. The equilibrium dissociation constants (Kd) of [3H]-8-OH-DPAT and [3H]-NAD-199 were derived from standard saturation isotherm analysis. The free concentration of radioligand was determined by subtracting the total bound concentration from the added concentration. Competition binding experiments were assumed to fit best to a one-site model unless a two-site model provided a statistically better fit; statistical significance was determined using an F test. The inhibition constants (Ki, Kh, Kl) were calculated from IC50 values as described by Cheng & Prusoff (1973). Concentration/response curves for agonist stimulation of [35S]-GTPγS binding were analysed using equations for a sigmoidal concentration/response relation with a Hill coefficient of 1 providing values for the EC50 and maximal stimulation (Emax) expressed as a percentage of the maximal response given by serotonin. Statistical significance was determined using an unpaired Student's t-test. Correlations were analysed and statistical significance was determined using the Pearson correlation coefficient.
Results
Saturation analyses with [3H]-8-OH DPAT and [3H]-NAD-199
The two radioligands [3H]-8-OH DPAT and [3H]-NAD-199 bound with high affinity and in a saturable manner to membranes of the CHO-5-HT1A cells. In all cases, the data fitted best to a one-binding site model (P<0.05). The ligand binding parameters were as follows: [3H]-8-OH DPAT–Bmax 1.85±0.24 pmol mg−1, pKd 9.10±0.09 (Kd 0.8 nM); [3H]-NAD-199–Bmax 5.22±1.26 pmol mg−1, pKd 9.91±0.09 (Kd 0.12 nM) (mean±s.e.m., n=3).
Competition ligand binding studies with [3H]-8-OH DPAT
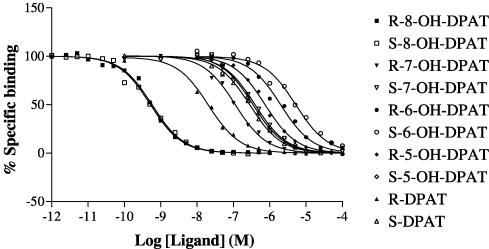
The R- and S-enantiomers of DPAT and 5-OH, 6-OH, 7-OH and 8-OH DPAT (Figure 1) were analysed in competition versus the binding of [3H]-8-OH DPAT to membranes of CHO-5-HT1A cells. Competition curves were fitted best by one-binding site models in all cases (P<0.05) and the different ligands competed with different potencies (Figure 3). Ki values were derived and these are given in Table 1.
Figure 3.
Inhibition of [3H]-8-OH DPAT binding to human 5-HT1A serotonin receptors expressed in CHO cells by agonists. [3H]-8-OH DPAT binding was determined as described in the Methods section. The data are from representative experiments replicated as in Table 1. Data were fitted to one and two-binding site models using Prism, and the curves shown are for one-binding site models that provided the best fit to the data in all cases (P<0.05).
Table 1.
Competition of agonists versus [3H]-8-OH DPAT binding to membranes of CHO cells expressing the human 5-HT1A receptor
| Ligand | DPAT | 5-OH DPAT | 6-OH DPAT | 7-OH DPAT | 8-OH DPAT | |||||
|---|---|---|---|---|---|---|---|---|---|---|
| enantiomer | R | S | R | S | R | S | R | S | R | S |
| pKi±s.e.m. | 7.94±0.12 | 6.97±0.23 | 6.31±0.10 | 6.65±0.15 | 5.86±0.07 | 5.54±0.06 | 7.21±0.08 | 6.50±0.05 | 9.41±0.07 | 9.27±0.09 |
| (Ki (nM)) | (11.5) | (108) | (492) | (223) | (1371) | (2865) | (62) | (316) | (0.39) | (0.53) |
| n | 3 | 3 | 4 | 4 | 4 | 4 | 4 | 4 | 5 | 5 |
The binding of a series of agonists was determined in competition versus [3H]-8-OH DPAT as described in the Methods section. Competition curves were fitted well by one-binding site models in all cases (P<0.05) and Ki values (pKi mean±s.e.m., n experiments) are recorded.
Competition ligand binding studies with [3H]-NAD-199
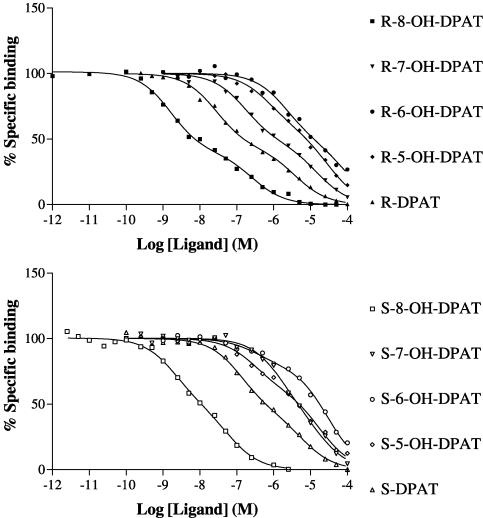
The R- and S-enantiomers of DPAT and 5-OH, 6-OH, 7-OH and 8-OH DPAT were analysed in competition versus the binding of [3H]-NAD-199 to membranes of CHO-5-HT1A cells (Figure 4). Competition curves were characterised by Hill coefficients less than 1 and a two-binding site model provided the best fit to the data (P<0.05) in all cases. Values for the dissociation constants for the higher and lower affinity sites (Kh, Kl) and the percentage of higher affinity sites are given in Table 2. In most cases, there was good agreement between Kh derived in these assays and Ki derived versus [3H]-8-OH DPAT. Exceptions were for S-5-OH, R-6-OH and S-6-OH DPAT, where these values were statistically different (comparisons of pKi and pKh values, P<0.05).
Figure 4.
Inhibition of [3H]-NAD-199 binding to human 5-HT1A serotonin receptors expressed in CHO cells by agonists. [3H]-NAD-199 binding was determined as described in the Methods section. The data are from representative experiments replicated as in Table 2. Data were fitted to one and two-binding site models using Prism, and the curves shown are for two-binding site models that provided the best fit to the data in all cases (P<0.05).
Table 2.
Competition of agonists versus [3H]-NAD-199 binding to membranes of CHO cells expressing the human 5-HT1A receptor
| Ligand | DPAT | 5-OH DPAT | 6-OH DPAT | 7-OH DPAT | 8-OH DPAT | |||||
|---|---|---|---|---|---|---|---|---|---|---|
| enantiomer | R | S | R | S | R | S | R | S | R | S |
| pKh±s.e.m. | 8.22±0.05 | 7.74±0.19 | 6.53±0.23 | 7.48±0.18 | 6.32±0.09 | 7.04±0.36 | 7.45±0.13 | 6.84±0.20 | 9.26±0.12 | 9.76±0.33 |
| (Kl(nM)) | (6.0) | (18) | (280) | (33) | (480) | (92) | (35) | (145) | (0.55) | (0.18) |
| pKl±s.e.m | 6.09±0.01 | 5.96±0.03 | 5.07±0.13 | 5.54±0.13 | 4.61±0.12 | 5.22±0.06 | 5.57±0.04 | 5.42±0.09 | 7.24±0.05 | 7.81±0.10 |
| (Kl(nM)) | (813) | (1109) | (8433) | (2884) | (24320) | (5984) | (2685) | (3784) | (58) | (15) |
| Rh±s.e.m % | 51.0±4.0 | 49.1±4.5 | 51.4±12.1 | 38.6±7.9 | 40.6±3.5 | 21.6±5.2 | 53.3±0.8 | 47.5±5.8 | 44.7±7.4 | 38.4±4.6 |
| n | 3 | 3 | 3 | 4 | 8 | 3 | 4 | 4 | 6 | 4 |
The binding of a series of agonists was determined in competition versus [3H]-NAD-199 as described in the Methods section. Competition curves were fitted well by two-binding site models in all cases (P<0.05), and Kh, Kl and percentage higher affinity site (Rh) values (mean± s.e.m., n experiments) are recorded.
Effects of agonists to stimulate [35S]-GTPγS binding
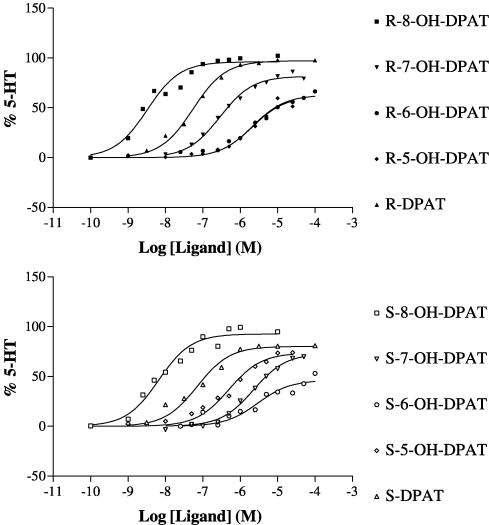
Concentration–response curves were obtained for each agonist to stimulate [35S]-GTPγS binding to membranes of CHO cells expressing the human 5-HT1A serotonin receptor (Figure 5). Stimulation of [35S]-GTPγS binding occurred at different potencies for each compound and to different maximal extents. The maximal stimulation of [35S]-GTPγS binding was determined relative to that given by a maximally stimulating concentration of serotonin and the potency (EC50) and relative efficacy (percentage of maximal serotonin effect, Emax) data are given in Table 3.
Figure 5.
Stimulation of [35S]-GTPγS binding by agonists via human 5-HT1A serotonin receptors expressed in CHO cells. [35S]-GTPγS binding was determined as described in the Methods section. The data are from representative experiments replicated as in Table 3. Data were analysed using Prism, and the curves shown are sigmoidal concentration/response curves with Hill coefficients of 1 that provided the best fit to the data in all cases (P<0.05).
Table 3.
Stimulation of [35S]-GTPγS binding by agonists in membranes of CHO cells expressing the human 5-HT1A receptor
| Ligand enantiomer | DPAT | 5-OH DPAT | 6-OH DPAT | 7-OH DPAT | 8-OH DPAT | |||||
|---|---|---|---|---|---|---|---|---|---|---|
| R | S | R | S | R | S | R | S | R | S | |
| pEC50±s.e.m. | 7.14±0.07 | 6.69±0.15 | 5.57±0.16 | 5.85±0.23 | 5.44±0.19 | 5.31±0.39 | 6.36±0.11 | 5.69±0.10 | 8.27±0.05 | 8.13±0.08 |
| (EC50) | (72) | (206) | (2669) | (1409) | (3656) | (4878) | (435) | (2059) | (5.4) | (7.4) |
| Emax±s.e.m (% serotonin) | 96.4±3.8 | 83.4±5.8 | 67.8±6.7 | 65.9±6.7 | 57.0±10.3 | 25.6±8.9 | 80.8±6.5 | 64.3±6.1 | 93.0±3.8 | 92.1±4.1 |
Stimulation of [35S]-GTPγS binding was determined as described in the Methods section, and the EC50 and maximal response (Emax, as a percentage of the maximal serotonin response) were determined. The data are mean±s.e.m, derived from three to seven experiments for EC50 values and from seven experiments for the maximal response.
Simulations of agonist binding and receptor response according to the Ternary Complex Model
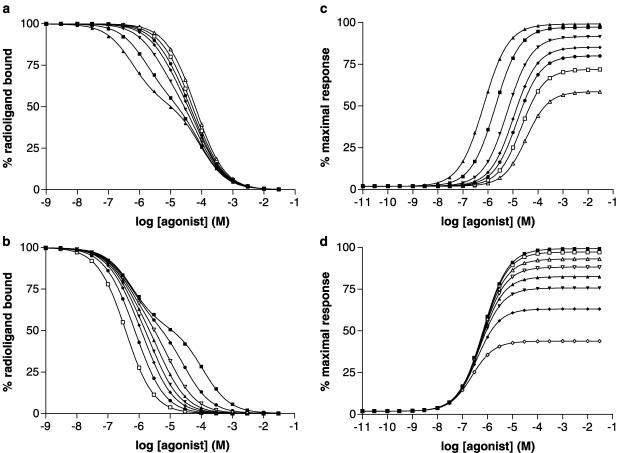
Data for agonist binding and agonist activation of G proteins were simulated using equations derived from the Ternary Complex Model (Figure 2). Data were simulated for a range of agonists with either the same affinity for the uncoupled receptor (KA=104 M−1) and differing abilities to bind to the G-protein-coupled form of the receptor (varying KAG) or differing abilities to bind to the uncoupled receptor (varying KA) and the same affinity to bind to the coupled form of the receptor (KAG=108 M−1) (see Figure 6 for the parameters used and the resulting simulated data). The data derived from the two sets of simulations were analysed using Prism. Simulated agonist binding data were all fitted best by a two-binding site model (P<0.05) from which dissociation constants for the higher and lower affinity sites (Kl, Kh) could be determined (Figure 6). The data are expressed in Figure 6 as the percentage inhibition of the binding of a radioligand that does not discriminate the coupled and uncoupled forms of the receptor and at a concentration much less than its dissociation constant. The percentage of receptors in the higher affinity state varied between ∼50% for high values of KAG/KA and ∼30% for low values of KAG/KA. Kl/Kh ratios were calculated from the data (Table 5). Simulated receptor activation data were fitted best (P<0.05) by sigmoidal concentration/response curves with Hill coefficients close to 1. The Hill coefficients varied from 0.88 for high values of KAG/KA to 0.98 for low values of KAG/KA. The maximal agonist response (Emax, expressed as a percentage of the maximum system response) and the concentration of agonist giving a half maximal response (EC50) were determined from the curves and the Kl/EC50 ratio was derived.
Figure 6.
Simulation of agonist binding and G protein activation according to the Ternary Complex Model. The Ternary Complex Model (Figure 2) was used as described in the Methods section, and two simulations were performed with values of parameters as follows: Simulation 1: KA 104 M−1; KAG (M−1) 108, 3.33 × 10⁷, 107, 5 × 10⁶, 3.33 × 10⁶, 2 × 10⁶, 106; J 108 M−1; [R]=2 × 10⁻¹⁰ M, [G]=10−10 M. Simulation 2 KA (M−1) 8 × 10³, 3 × 10⁴, 8 × 10⁴, 1.5 × 10⁵, 2.5 × 10⁵, 4 × 10⁵, 8 × 10⁵, 2 × 10⁶; KAG 108 M−1; J 108 M−1; [R]=2 × 10⁻¹⁰ M, [G]=10−10 M. Data from the two simulations are given in Table 5 and the derived parameters were amalgamated in subsequent analyses (Figure 7 and Figure 8). Panels a and b (simulations 1 and 2, respectively) show agonist binding expressed as percentage inhibition of the binding of a radioligand that does not discriminate coupled and uncoupled forms of the receptor at a radioligand concentration much less than its dissociation constant. Panels c and d (simulations 1 and 2, respectively) show agonist activation of G proteins with response (E) expressed as a percentage of the maximal response in the system.
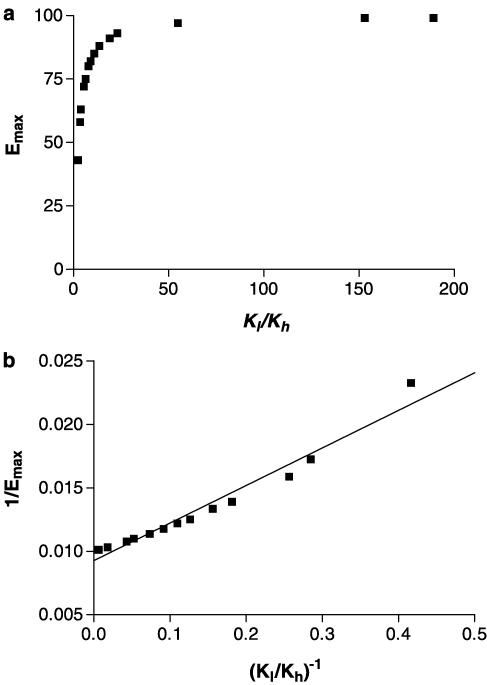
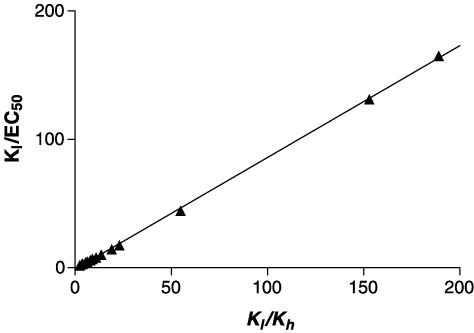
For these two sets of simulated data, the relation between Emax and Kl/Kh is hyperbolic, with high values of Kl/Kh giving Emax values of 100% (Figure 7a). A correlation between the two quantities is observed (r2=0.962, P<0.05, Figure 7b) if the data are plotted in the form of a double reciprocal plot, although the relation is not a linear one. Kl/EC50 and Kl/Kh are highly correlated (r2=0.9996, P<0.05, Figure 8).
Figure 7.
Relation between Emax and Kl/Kh. Data for Emax derived from the simulations of Figure 6 (see Table 5 for parameters) are plotted versus Kl/Kh (a), and as 1/Emax versus (Kl/Kh)−1 (b).
Figure 8.
Relation between Kl/EC50 and Kl/Kh. Data for Kl/EC50 derived from the simulations of Figure 6 (see Table 5 for parameters) are plotted versus Kl/Kh.
Discussion
In this study, we have used a homologous series of 2-(dipropylamino)tetralins to probe the structural requirements of agonist binding and receptor activation at the 5-HT1A serotonin receptor. We have also examined whether agonist binding data may be used to predict the relative efficacy for this series of agonists. The results provide some insights into the structural requirements in agonists at this receptor as well as the mechanisms of receptor activation.
Agonists have been tested in competition ligand binding assays versus two radioligands, the agonist [3H]-8-OH DPAT and the antagonist [3H]-NAD-199, in order to provide estimates of the dissociation constants of the higher and lower affinity agonist binding sites (Kh, Kl). In competition versus [3H]-8-OH DPAT all of the ligands gave data that were fitted best by a one-binding site model. [3H]-8-OH DPAT has been shown to label the 5-HT1A receptor coupled to G proteins (Newman-Tancredi et al., 1992). In competition experiments versus [3H]-NAD-199 all of the ligands gave data that could be resolved into two sets of sites. [3H]-NAD-199 is a recently introduced radioligand (Jerning et al., 1998; Malmberg and Strange, 2000) that has been shown to label the 5-HT1A receptor coupled to G protein and uncoupled from G proteins. The lower affinity sites observed in competition versus [3H]-NAD-199 correspond to agonist binding to the free receptor uncoupled from G protein and should provide estimates of Kl. There is mostly good agreement between the affinities of the ligands for the higher affinity site determined in competition versus [3H]-NAD-199 and the affinity derived in competition versus [3H]-8-OH DPAT, both of which should provide estimates of ligand affinities for the higher affinity sites (Kh). In some cases, the two affinity estimates differ slightly, with a higher affinity being seen in competition versus [3H]-NAD-199. Two possible sources of this difference may be proposed. There may be difficulties in analysing a competition curve into two sites when the compound has a low affinity and the competition is not complete, for example, R- and S-6-OH DPAT. Also, there may be complexities in competition experiments versus [3H]-8-OH DPAT, which is a racemic mixture of two enantiomers that bind with different affinities to the receptor, whereas [3H]-NAD-199 is a single enantiomeric species. In subsequent analyses using Kh, the mean of the two estimates (pKh versus [3H]-NAD-199, pKi versus [3H]-8-OH DPAT) was used.
One of the aims of the present study was to determine the structural features in the agonists used that are responsible for agonist binding to the 5-HT1A receptor and subsequent responses. In considering agonist binding, there are two sets of data for dissociation constants (Kh and Kl). Kh depends on agonist binding to the free receptor and the conformational change involved in coupling to the G protein. Values of Kh, therefore, cannot be used for structure–activity studies as changes in agonist structure could affect both agonist binding and the conformational change. The lower affinity agonist binding sites (Kl) correspond to the uncoupled receptor and so Kl may be used to consider the relation between structure and binding affinity. Even for Kl, however, some components of relative efficacy may be included depending on the extent of agonist-dependent conformational changes upon binding to uncoupled receptor (Colquhoun, 1998; Strange, 1999).
In the series of compounds tested, the nonhydroxylated species, R- and S-DPAT, both exhibit similar binding affinities (Kl) of about 1 μM. These compounds exhibit a similar binding affinity for the D2 dopamine receptor (Coley et al., 2000; Payne et al., 2002), and this may reflect the binding energy of electrostatic interactions between the cationic amino group and the receptor and hydrophobic interactions between the dipropyl groups and the aromatic moiety of the ligand with the receptor. The sum of these interactions may be similar in magnitude for the D2 and 5-HT1A receptors. The addition of hydroxyl groups to these compounds then has variable effects on Kl for the 5-HT1A receptor. Both R- and S-enantiomers of 8-OH DPAT show the highest binding affinity (in terms of Kl) for the 5-HT1A receptor, and there is a slight preference (∼four fold) in favour of the S-enantiomer. Hence, addition of the 8-OH group is very favourable in this series of compounds for the 5-HT1A serotonin receptor. Addition of 5-OH, 6-OH and 7-OH groups was unfavourable for binding to the lower affinity site in each case, although in some cases the effects were small, for example, 7-OH DPAT. Thus, for the 5-HT1A serotonin receptor there is a strong productive interaction between the 8-OH group on the ligand and groups on the receptor. Possible candidate residues for interaction with the 8-OH groups would be Ser 198, Thr 199. Surprisingly, however, the 8-OH group exerts this effect for both the R- and S-enantiomers of this compound. This is discussed in more detail below.
A similar pattern is seen for the ability of these ligands to stimulate [35S]-GTPγS binding. R-DPAT and the R- and S-enantiomers of 8-OH DPAT are full agonists in this assay system, and the compounds with other substitution patterns exhibit lower maximal effects. The rank orders of potencies (EC50) and binding affinities (Kl) for this series of ligands are similar although not identical, but there is a correlation between the two sets of parameters (r2=0.941, P<0.01). It is of interest that the unhydroxylated R-DPAT is a potent full agonist at the 5-HT1A receptor as similar observations have been made for this compound for the D2 dopamine receptor (Payne et al., 2002). This shows that interaction between a hydroxyl group on the agonist and residues on the receptor (TMV) is not essential for full activation. Under these circumstances, the principal interactions between agonist and receptor may be between the cationic amino group of the agonist and the aspartate in TMIII and between the aromatic ring of the agonist and aromatic residues in TMVI of the receptor. This is consistent with physical and mutational analyses of activation of rhodopsin and the β2 adrenoreceptor (Farrens et al., 1996; Ballesteros et al., 2001a) showing that the principal conformational changes occurred between TMIII and TMVI in these proteins. The enantiomers of 8-OH DPAT are both potent full agonists. It is clear that there is an interaction of the 8-OH group with the receptor as there is a substantial difference in the affinity and potency data for the 8-OH and unhydroxylated compounds. Nevertheless, the two enantiomers of 8-OH DPAT have similar properties in terms of receptor activation. This could reflect the two enantiomers adopting different conformations so that the principal interacting groups are in similar positions. The enantiomers of 5-OH and 7-OH DPAT, however, exhibit substantial stereoselectivity for both ligand binding and receptor activation for the D2 dopamine receptor (Payne et al., 2002). For the D2 dopamine receptor, therefore, such 2-(dipropylamino)tetralins do not seem to adopt different conformations. For the 5-HT1A receptor, Mellin et al. (1991) have suggested, using pharmacophore analysis, that the two enantiomers of this compound do not adopt different conformations, but rather they bind in different orientations. In these two orientations the amino group and aromatic ring are in similar relative orientations, but the 8-OH groups are in quite different positions within the receptor binding site. This suggests that the 5-HT1A receptor can be activated in two ways with different interactions between ligand and receptor. Similarly, it has been shown that the D2 dopamine receptor may be activated by 2-(dipropylamino)tetralins in different orientations, depending on their hydroxyl substitution pattern (Payne et al., 2002).
Another aim of this study was to examine whether ligand binding data for higher and lower affinity sites (Kl/Kh ratio) may be used to predict the relative efficacies of agonists. The principal measure of relative efficacy that has been used is the maximal effect in [35S]-GTPγS binding assays (Emax), but we have also determined the ratio of the lower affinity dissociation constant to the potency for stimulation of [35S]-GTPγS binding (Kl/EC50) as a second measure of this (Table 4). The Kl/EC50 ratio is a measure of the amplification of signal from ligand binding to response and so should reflect agonist efficacy (Black & Leff, 1983; Gardner et al., 1997). In the present study, this ratio shows a trend to lower values for the S-enantiomers in this series of compounds. This suggests that the S-enantiomers are less efficacious agonists than the corresponding R-enantiomers. This difference has been obscured in the data for maximal effect (Emax) as some of the compounds are nearly full agonists for stimulation of [35S]-GTPγS binding. Even with the enantiomers of 8-OH DPAT, however, analysis of data using the Kl/EC50 ratio shows that the R-enantiomer is a more efficacious agonist. The enantiomers of 8-OH DPAT have been examined in several other studies (Bjork et al., 1989; Cornfield et al., 1991; Liu et al., 1993; Lejeune et al., 1997) and these have shown, in agreement with the present data, that the R- and S-enantiomers have similar potencies and relative efficacies, although in several studies the R-enantiomer exhibits a slightly higher relative efficacy.
Table 4.
Efficacy parameters
| Ligand enantiomer | DPAT | 5-OH DPAT | 6-OH DPAT | 7-OH DPAT | 8-OH DPAT | |||||
|---|---|---|---|---|---|---|---|---|---|---|
| R | S | R | S | R | S | R | S | R | S | |
| Kl/Kh | 98.0 | 25.1 | 22.2 | 33.5 | 29.9 | 11.7 | 57.4 | 17.7 | 126.1 | 48.4 |
| Kl/EC50 | 11.3 | 5.4 | 3.2 | 2.0 | 6.7 | 1.2 | 6.2 | 1.8 | 10.7 | 2.0 |
The Kl/Kh ratio has been proposed to be a measure of the stabilisation of the ternary complex of agonist/receptor/G protein over the uncoupled receptor (De Lean et al., 1980). Kl/Kh should, therefore, be a predictor of agonist efficacy. There have been a number of attempts for different G-protein-coupled receptors to examine such relations, and correlations have been reported for some receptors (see for example De Lean et al., 1980; Evans et al., 1985; Fitzgerald et al., 1999) and not for others (Sibley & Creese, 1983; Fisher et al., 1984; Gardner et al., 1997, Gardner & Strange, 1998). Some of these correlations have used Kl/Kh and some log Kl/Kh, and it is unclear which is the more appropriate parameter. In order to understand these relations better, we have simulated such correlations for a G-protein-coupled receptor using the Ternary Complex Model. Simulations were performed for a range of agonists with different abilities to stabilise the R and RG states of the receptor and values for Kl and Kh determined from simulated ligand binding data. Maximal effects (Emax) and EC50 values for stimulation of G protein activation were determined from simulated concentration/response curves and expressed relative to the maximal response in the system. The relation between Emax and Kl/Kh is hyperbolic (Figure 7a) and reaches a plateau at high Kl/Kh. This relation makes it difficult to predict Emax from Kl/Kh values, but if the data are plotted in a double reciprocal format then a good correlation is seen between the two parameters (Figure 7b). The relation is not a linear one, but with experimental data it may provide a useful analytical tool (see below). In some published studies, data are restricted to values of Emax below ∼95% and log Kl/Kh values are used to explore the relation between the two quantities. Indeed if the present simulated data are analysed without the two highest values of Emax, reasonable correlations between Emax and log Kl/Kh can be obtained (data not shown). Kl/Kh and Kl/EC50 derived from the simulated data are highly correlated (Figure 8). It should be noted that the relation between Kl/Kh and Kl/EC50 is effectively one between 1/Kh and 1/EC50, but we prefer to use Kl/Kh and Kl/EC50 as Kl/EC50 is a useful descriptor of relative efficacy. These observations show that Kl/Kh may predict relative efficacy if the appropriate relation is used.
When the experimental data of the present study are considered, there are correlations between the Kl/Kh ratio and the relative Emax (r2=0.494, P<0.05), between the log Kl/Kh ratio and the relative Emax (r2=0.684, P<0.05), between (Kl/Kh)−1 and 1/Emax (r2=0.727, P<0.05) and between the Kl/Kh ratio and the Kl/EC50 ratio (r2=0.719, P<0.05). It seems therefore that, for this set of compounds of related structures, agonist binding parameters may be used to predict agonist efficacy. In a previous study on the 5-HT1A receptor with a different set of agonists, we were unable to see any such correlations (McLoughlin & Strange, 2000), but this may reflect the much more diverse structures of the compounds tested. In that study there was a trend to higher maximal agonist effects for compounds with high Kl/Kh ratios and vice versa, but the relation was incomplete.
Other laboratories have examined the relation between ligand binding parameters and agonist efficacy for the 5-HT1A receptor. Watson et al. (2000) have reported correlations between agonist affinity parameters and the maximal agonist effect, whereas Cilia et al. (2001) were unable to observe such a correlation. Assie et al. (1999) reported a correlation for a range of ligands, but they also noted some exceptions. It seems, therefore, that the Kl/Kh ratio may be a helpful predictor of the maximal agonist effect for some compounds but that there are additional factors that determine agonist efficacy. One of the factors may be the ability of the agonist to activate the G protein having stabilised the ternary complex of agonist/receptor/G protein.
Acknowledgments
We thank the BBSRC for financial support and AstraZeneca for a generous gift of [3H]-NAD-199.
Abbreviations
- CHO-5-HT1A cells
CHO cells expressing human 5-HT1A serotonin receptor
- D2 receptor
D2 dopamine receptor
- DPAT
2-(dipropylamino)tetralin
- NAD-199
(R)-3-N,N-dicyclobutylamino-8-fluoro-[6-3H]-3,4-dihydro-2H-1-benzopyran-5-carboxamide
- TM
membrane spanning α-helix
References
- ASSIE M.B., COSI C., KOEK W. Correlation between low/high affinity ratios for 5-HT(1A) receptors and intrinsic activity. Eur. J. Pharmacol. 1999;386:97–103. doi: 10.1016/s0014-2999(99)00738-4. [DOI] [PubMed] [Google Scholar]
- BALLESTEROS J.A., JENSEN A.D., LIAPAKIS G., RAMUSSEN S.G., SHI L., GETHER U., JAVITCH J.A. Activation of the β2-adrenergic receptor involves disruption of an ionic lock between the cytoplasmic ends of transmembrane regions 3 and 6. J. Biol. Chem. 2001a;276:29171–29177. doi: 10.1074/jbc.M103747200. [DOI] [PubMed] [Google Scholar]
- BALLESTEROS J.A., SHI L., JAVITCH J.A. Structural mimicry in G protein-coupled receptors: implications of the high-resolution structure of rhodopsin for structure–function analysis of rhodopsin-like receptors. Mol. Pharmacol. 2001b;60:1–19. [PubMed] [Google Scholar]
- BJORK L., BACKLUND-HOOK B.B., NELSON D.L., ANDEN N.E., HACKSELL U. Resolved N,N-dialkylated 2-amino-8-hydroxytetralins: stereoselective interactions with 5-HT1A receptors in brain. J. Med. Chem. 1989;32:779–783. doi: 10.1021/jm00124a009. [DOI] [PubMed] [Google Scholar]
- BLACK J.W., LEFF P. Operational models of pharmacological agonism. Proc. R. Soc. London B. 1983;220:141–162. doi: 10.1098/rspb.1983.0093. [DOI] [PubMed] [Google Scholar]
- CASTRO S.W., STRANGE P.G. Coupling of D2 and D3 dopamine receptors to G-proteins. FEBS Lett. 1993;315:223–226. doi: 10.1016/0014-5793(93)81168-y. [DOI] [PubMed] [Google Scholar]
- CHANDA P.K., MINCHIN M.C.W., DAVIS A.R., GREENBERG L., REILLY Y., MCGREGOR W.H., BHAT R., LUBECK M.D., MIZUTANI S., HUNG P.P. Identification of residues important for ligand binding to the human 5-hydroxytryptamine1A serotonin receptor. Mol. Pharmacol. 1993;43:516–520. [PubMed] [Google Scholar]
- CHENG Y.-C., PRUSOFF W.H. Relationship between the inhibition constant (Ki) and the concentration of inhibitor that causes 50% inhibition (I50) of an enzymatic reaction. Biochem. Pharmacol. 1973;22:3099–3108. doi: 10.1016/0006-2952(73)90196-2. [DOI] [PubMed] [Google Scholar]
- CILIA A., POGGESI E., TESTA R., LEONARDI A. Correlation between effects on [35S]-GTPγS binding and low/high affinity ratios for the human 5-HT1A receptor transfected in HeLa cells. Br. J. Pharmacol. 2001;133 Suppl:220. [Google Scholar]
- COLEY C., WOODWARD R., JOHANSSON A.M., STRANGE P.G., NAYLOR L.H. Effect of multiple serine/alanine mutations in transmembrane spanning region V of the D2 dopamine receptor on ligand binding. J. Neurochem. 2000;74:358–366. doi: 10.1046/j.1471-4159.2000.0740358.x. [DOI] [PubMed] [Google Scholar]
- COLQUHOUN D. Binding, gating and efficacy: the interpretation of structure-activity relationships for agonists and of the effects of mutating receptors. Br. J. Pharmacol. 1998;125:924–947. doi: 10.1038/sj.bjp.0702164. [DOI] [PMC free article] [PubMed] [Google Scholar]
- CORNFIELD L., LAMBERT G., ARVIDSSON L., MELLIN C., VALLGARDA J., HACKSELL U., NELSON D.L. Intrinsic activity of enantiomers of 8-hydroxy-2-(di-n-propylamino) tetralin and its analogs at 5-hydroxytryptamine1A receptors that are negatively coupled to adenylate cyclase. Mol. Pharmacol. 1991;39:780–787. [PubMed] [Google Scholar]
- DE LEAN A., STADEL J.M., LEFKOWITZ R.J. A ternary complex model explains the agonist-specific binding properties of the adenylate cyclase-coupled β-adrenergic receptor. J. Biol. Chem. 1980;255:7108–7117. [PubMed] [Google Scholar]
- EVANS T., HEPLER J.R., MASTERS S.B., BROWN J.H., HARDEN T.K. Guanine nucleotide regulation of agonist binding to muscarinic acetylcholine receptors. Biochem. J. 1985;232:751–757. doi: 10.1042/bj2320751. [DOI] [PMC free article] [PubMed] [Google Scholar]
- FARRENS D.L., ALTENBACH C., YANG K., HUBBELL W.L., KHORANA H.G. Requirements of rigid-body motion of transmembrane helices for light activation of rhodopsin. Science. 1996;274:768–770. doi: 10.1126/science.274.5288.768. [DOI] [PubMed] [Google Scholar]
- FISHER S.K., FIGUEIREDO J.C., BARTUS R.T. Differential stimulation of inositol phosphate turnover by analogues of oxotremorine. J. Neurochem. 1984;43:1171–1179. doi: 10.1111/j.1471-4159.1984.tb12858.x. [DOI] [PubMed] [Google Scholar]
- FITZGERALD L.W., CONKLIN D.S., KRAUSE C.M., MARSHALL A.P., PATTERSON J.P., TRAN D.P., IYER G., KOSTICH W.A., LARGENT B.L., HARTIG P.R. High-affinity agonist binding correlates with efficacy (intrinsic activity) at the human serotonin 5-HT2A and 5-HT2C receptors: evidence favoring the ternary complex and two-state models of agonist action. J. Neurochem. 1999;72:2127–2134. doi: 10.1046/j.1471-4159.1999.0722127.x. [DOI] [PubMed] [Google Scholar]
- GARDNER B., HALL D.A., STRANGE P.G. Pharmacological analysis of dopamine stimulation of [35S]-GTPγS binding via human D2short and D2long dopamine receptors expressed in recombinant cells. Br. J. Pharmacol. 1996;118:1544–1550. doi: 10.1111/j.1476-5381.1996.tb15572.x. [DOI] [PMC free article] [PubMed] [Google Scholar]
- GARDNER B.R., HALL D.A., STRANGE P.G. Agonist action at D2(short) dopamine receptors determined in ligand binding and functional assays. J. Neurochem. 1997;69:2589–2598. doi: 10.1046/j.1471-4159.1997.69062589.x. [DOI] [PubMed] [Google Scholar]
- GARDNER B., STRANGE P.G. Agonist action at D2(long) dopamine receptors: ligand binding and functional assays. Br. J. Pharmacol. 1998;124:978–984. doi: 10.1038/sj.bjp.0701926. [DOI] [PMC free article] [PubMed] [Google Scholar]
- HO B., KARSCHIN A., BRANCHEK T., DAVIDSON N., LESTER H.A. The role of conserved aspartate and serine residues in ligand binding and in function of the 5-HT1A receptor: a site directed mutation study. FEBS Lett. 1992;312:259–262. doi: 10.1016/0014-5793(92)80948-g. [DOI] [PubMed] [Google Scholar]
- JERNING E., SVANTESSON G.T., MOHELL N. Receptor binding characteristics of [3H]-NAD-299, a new selective 5-HT1A receptor antagonist. Eur. J. Pharmacol. 1998;360:219–225. doi: 10.1016/s0014-2999(98)00667-0. [DOI] [PubMed] [Google Scholar]
- KENAKIN T.P. Pharmacological Analysis of Drug-Receptor Interactions. New York: Raven Press; 1993. [Google Scholar]
- LEJEUNE F., NEWMAN-TANCREDI A., AUDINOT V., MILLAN M.J. Interactions of (+)- and (−)-8- and 7-hydroxy-2-(di-n-propylamino)tetralin at human (h)D3, hD2 and h serotonin1A receptors and their modulation of the activity of serotoninergic and dopaminergic neurones in rats. J. Pharmacol. Exp. Ther. 1997;280:1241–1249. [PubMed] [Google Scholar]
- LIU Y., YU H., SVENSSON B.E., CORTIZO L., LEWANDER T., HACKSELL U. Derivatives of 2-(dipropylamino)tetralin: effect of the C8-substituent on the interaction with 5-HT1A receptors. J. Med. Chem. 1993;36:4221–4229. doi: 10.1021/jm00078a012. [DOI] [PubMed] [Google Scholar]
- LOWRY O.H., ROSEBROUGH N.J., FARR A.L., RANDALL R.J. Protein measurement with the folin phenol reagent. J. Biol. Chem. 1951;193:265–275. [PubMed] [Google Scholar]
- MALMBERG A., STRANGE P.G. Site-directed mutations in the third intracellular loop of the serotonin 5-HT1A receptor alter G protein coupling from Gi to Gs in a ligand dependent manner. J. Neurochem. 2000;75:1283–1293. doi: 10.1046/j.1471-4159.2000.751283.x. [DOI] [PubMed] [Google Scholar]
- MCLOUGHLIN D., STRANGE P.G. Mechanisms of agonism and inverse agonism at 5-HT1A serotonin receptors. J. Neurochem. 2000;74:347–357. doi: 10.1046/j.1471-4159.2000.0740347.x. [DOI] [PubMed] [Google Scholar]
- MELLIN C., VALLGARDA J., NELSON D.L., BJORK L., YU H., ANDEN N.E., CSOREGH I., ARVIDSSON L.E., HACKSELL U. A 3-D model for 5-HT1A-receptor agonists based on stereoselective methyl-substituted and conformationally restricted analogues of 8-hydroxy-2-(dipropylamino)tetralin. J. Med. Chem. 1991;34:497–510. doi: 10.1021/jm00106a004. [DOI] [PubMed] [Google Scholar]
- NEWMAN-TANCREDI A., WOOTTON R., STRANGE P.G. High-level stable expression of recombinant 5-HT1A 5-hydroxytryptamine receptors in Chinese hamster ovary cells. Biochem. J. 1992;285:933–938. doi: 10.1042/bj2850933. [DOI] [PMC free article] [PubMed] [Google Scholar]
- PAYNE S., JOHANSSON A., STRANGE P.G. Mechanisms of ligand-binding and efficacy at the human D2(short) dopamine receptor. J. Neurochem. 2002;82:1106–1117. doi: 10.1046/j.1471-4159.2002.01046.x. [DOI] [PubMed] [Google Scholar]
- SIBLEY D., CREESE I. Interaction of ergot alkaloids with anterior pituitary D2 dopamine receptors. Mol. Pharmacol. 1983;23:585–593. [PubMed] [Google Scholar]
- STRADER C.D., FONG T.M., TOTA M.R., UNDERWOOD D., DIXON R.A. Structure and function of G protein-coupled receptors. Annu. Rev. Biochem. 1994;63:101–132. doi: 10.1146/annurev.bi.63.070194.000533. [DOI] [PubMed] [Google Scholar]
- STRANGE P.G. The energetics of ligand binding to catecholamine receptors. Trends Pharmacol. Sci. 1996a;17:238–244. doi: 10.1016/0165-6147(96)10025-0. [DOI] [PubMed] [Google Scholar]
- STRANGE P.G. 7TM receptors–locks and keys. Trends Pharmacol. Sci. 1996b;17:346–347. [PubMed] [Google Scholar]
- STRANGE P.G. G-protein coupled receptors–conformations and states. Biochem. Pharmacol. 1999;58:1081–1088. doi: 10.1016/s0006-2952(99)00144-6. [DOI] [PubMed] [Google Scholar]
- WATSON J., COLLIN L., HO M., RILEY G., SCOTT C., SELKIRK J.V., PRICE G.W. 5-HT(1A) receptor agonist-antagonist binding affinity difference as a measure of intrinsic activity in recombinant and native tissue systems. Br. J. Pharmacol. 2000;130:1108–1114. doi: 10.1038/sj.bjp.0703394. [DOI] [PMC free article] [PubMed] [Google Scholar]
- WREGGETT K.A., DE LEAN A. The ternary complex model. Its properties and application to ligand interactions with the D2-dopamine receptor of the anterior pituitary gland. Mol. Pharmacol. 1984;26:214–227. [PubMed] [Google Scholar]


