Abstract
Inflammation is a pathophysiological event that has relevance for altered drug disposition in humans. Two functions of P-glycoprotein (P-gp) are hepatic drug elimination and prevention of drug entry into the central nervous system (CNS). Our objective was to investigate if localized CNS inflammation induced by Escherichia coli lipopolysaccharide (LPS) would modify mdr1a/P-gp expression and function in the brain and liver.
Our major finding was that the CNS inflammation in male rats produced a loss in the expression of mdr1a mRNA in the brain and liver that was maximal 6 h after intracranial ventricle (i.c.v.) administration of LPS. When 3H-digoxin was used at discrete time points, as a probe for P-gp function in vivo, an increase in brain and liver 3H-radioactivity and plasma level of parent digoxin was produced 6 and 24 h following LPS treatment compared to the saline controls. Digoxin disposition was similarly altered in mdr1a+/+ mice but not in mdr1a−/− mice 24 h after administering LPS i.c.v.
In male rats, the biliary elimination of parent digoxin was reduced at 24 h (60%) and 48 h (40%) after LPS treatment and was blocked by the P-gp substrate cyclosporin A. An observed loss in CYP3A1/2 protein and organic anion transporting polypeptide 2 mRNA in the liver may make a minor contribution to digoxin elimination in male rats after LPS treatment.
Conditions which impose inflammation in the CNS produce dynamic changes in mdr1a/P-gp expression/function that may alter hepatic drug elimination and the movement of drugs between the brain and the periphery. The use of experimental models of brain inflammation may provide novel insight into the regulation of P-gp function in that organ.
Keywords: P-glycoprotein, mdr1a, organic anion transporting polypeptide (oatp2), CNS inflammation, drug elimination, drug transport, digoxin
Introduction
P-glycoprotein (P-gp) encoded by the gene MDR1 in humans and mdr1a and mdr1b in rodents is expressed normally in epithelial cells of several organs including brain, liver, intestine, kidney, adrenal gland and testes (Gottesman & Pastan, 1993). The protein products of mdr1a and mdr1b play a key role in disposition and excretion of a wide array of clinically used drugs and provides protection against exposure to toxic xenobiotics (Mayer et al., 1996; Schinkel et al., 1997; Johnson et al., 2001). In rodents, mdr1a is the primary multidrug resistance (mdr) transcript expressed in the brain (Croop et al., 1989). P-gp in the choroid plexus and microvessel endothelial cells contributes to the blood – cerebral spinal fluid and the blood – brain drug permeability barriers, respectively, and prevent accumulation of several drugs (e.g. digoxin, dexamethasone, cyclosporin A (CSA), loperamide and antineoplastics) in the central central nervous system (CNS) (Schinkel et al., 1994, 1995; Beaulieu et al., 1997; Kawahara et al., 1999; Rao et al., 1999). In the periphery, P-gp expression in the intestinal epithelia reduces the systemic absorption of several drugs (e.g. digoxin and CSA and vinblastine) and contributes to excretion of P-gp substrates from the blood (Mayer et al., 1996; Schinkel et al., 1997; van Asperen et al., 2000). In the renal proximal tubule and in the canalicular membrane of hepatocytes, P-gp is important for the secretion of some drugs into the urine and bile, respectively (van Asperen et al., 2000; Ando et al., 2001; Tsuruoka et al., 2001). Conditions that impair P-gp-mediated drug transfer in the peripheral organs and the blood – brain barrier or choroid plexus may lead to decreased elimination, or altered entry of a number of clinically important drugs into the CNS.
When host defense mechanisms are activated by the administration of lipopolysaccharide (LPS), inflammatory cytokines or turpentine to rodents, the expression of mdr1a mRNA in the liver is diminished and is followed by a reduction in the levels of P-gp expression (Piquette-Miller et al., 1998; Hartmann et al., 2001). In vivo functional studies have demonstrated that the systemic administration of Klebsiella pneumoniae endotoxin decreases hepatic elimination of the P-gp substrate rhodamine123 (Ando et al., 2001). The effects of inflammation on hepatic mdr1b expression remain controversial. For instance, it has been shown that mdr1b mRNA is depressed by peripheral inflammation (Piquette-Miller et al., 1998; Hartmann et al., 2001), whereas other groups have shown an increase in hepatic mdr1b expression in response to inflammation (Vos et al., 1998; Ando et al., 2001). Nonetheless, the majority of findings support the idea that a depression of P-gp expression or function in the liver occurs in response to systemic inflammation. In addition to drug transport, it is well known that another hepatic drug-handling system, cytochrome P450 (CYP)-mediated biotransformation, is diminished during inflammatory responses (Renton, 2000; Morgan, 2001). Not only are CYP systems in the liver modulated during systemic inflammation, but they are also significantly changed when inflammation is confined to the brain (Renton & Nicholson, 2000; Nicholson & Renton, 2001). It remains to be determined if inflammation confined to the CNS modulates hepatic drug elimination through effects on mdr1a/P-gp expression in that organ.
Systemic inflammation caused a minor reduction in P-gp in mouse brain membrane preparations and increased brain/plasma ratio of the P-gp substrate doxorubicin without major histopathological changes to the blood – brain barrier (Zhao et al., 2002). These findings suggest that P-gp function in the blood – brain barrier may be minimally impaired during systemic inflammation. However, it is possible that a localized inflammation in the brain may be required to induce more profound changes in brain expressed mdr1a and P-gp function. It is known that neuroinflammatory diseases can change the permeability characteristics of the blood–brain barrier (de Vries et al., 1997). P-gp is an important determinant of the blood–brain barrier permeability to drugs, but the effects of neuroinflammation on the brain expression of mdr1a and P-gp function remain to be determined.
In the present study, we investigated if a localized CNS inflammation induced by Escherichia coli LPS will downregulate P-gp function and/or mdr1a expression in the brain and liver. As the distribution of the heart glycoside, digoxin into the brain and several peripheral tissues is strongly affected by mdr1a/P-gp activity (Schinkel et al., 1995; Mayer et al., 1996; Kawahara et al., 1999), we have chosen digoxin as a prototype drug to examine P-gp function during CNS inflammation. The use of experimental models of brain inflammation may provide insight into the regulation of P-gp function in that organ and may lead to novel approaches that facilitate drug delivery in the treatment of CNS disorders.
Methods
Animal preparation and production of CNS inflammation
All experimental procedures involving the use of animals have been approved by the Dalhousie University Committee on Laboratory Animals according to the guidelines established by the Canadian Council on Animal Care. Male or female Sprague–Dawley rats (175–200 g) obtained from Charles River Laboratories (Wilmington, MA, U.S.A.) or male FVB mdr1a+/+ (wild-type) and mdr1a−/− mice (5–6 weeks age) obtained from Taconic Farms (Germantown, NY, U.S.A.) were housed in plastic cages, lined with clay chips with free access to Purina rat chow and water. Animals were allowed to acclimatize in our animal holding facilities for 1–2 weeks before use. On the starting day of the experiment, rats (250–300 g) and mice (25–30 g) were anaesthetized with enflurane (3–4%). CNS inflammation was generated by infusion of 25 μg in 5 μl of saline (rats) and 2.5 μg in 2.5 μl of saline (mice) of E. coli LPS (serotype 0127 : B8) into the left lateral cerebral ventricle at a rate of 2.5 μl min−1 using a Harvard Apparatus syringe pump. Control rats and mice were injected with 5 and 2.5 μl of saline (0.9%), respectively. The coordinates (in mm) for the stereotaxic injection were −4.5 D/V, −1.5 L and −1.0 A/P from the bregma for the rat and –2.5 D/V, −1.0 L and –0.2 A/P from the bregma in mice (Paxinos & Watson, 1986; Franklin & Paxinos, 1997). There are several stereotypes of LPS and each may posses a different potency. We have titrated our intracranial ventricle (i.c.v.) dose of E. coli endotoxin (serotype 0127 : B8) to 25 μg in order to generate a reproducible nonlethal inflammatory response that is restricted to the CNS and reduces hepatic CYP metabolic activity (Nicholson & Renton, 2001; Renton & Nicholson, 2000). At 24 h after i.c.v. administration of LPS (25 μg) to rats, a loss (50%) in hepatic CYP1A1/2 metabolic activity is observed (Nicholson & Renton, 2001; Renton & Nicholson, 2000). The i.c.v. administration of LPS (2.5 μg) to wild-type FVB mice produced a similar reduction (50%) in the rate CYP1A1/2 metabolism in hepatic microsomes compared to rats and validated the use of this dosage of LPS for our studies in mice.
Immunohistochemistry
The methods for immunohistochemical detection of heat-shock protein (hsp25) in rat brain have been reported in detail (Renton & Nicholson, 2000). Briefly, following transcardial perfusion with ice-cold 4% paraformaldehyde, brains were dissected and cryopreserved in 30% sucrose. Primary rabbit anti-mouse hsp25 (1 : 2000 dilution) (Stressgene Biotechnologies, Victoria, Canada) was reacted with 30 μm coronal brain sections followed by incubation with biotinylated goat anti-rabbit IgG (1 : 5000), incubation with avidin–biotin solution and staining with DAB reagent. Biotinylated IgG, ABC and DAB reagents were obtained from Vector Laboratories (Burlingame, CA, U.S.A.).
RT-PCR analysis of mRNA
Total RNA was extracted from livers and brain of male rats using the Amersham QuickPrep™ RNA extraction kit (Amersham, Piscataway, NJ, U.S.A.) following manufacturer's instructions. A semiquantitative RT-PCR assay was utilized based on previously published methods (Hartmann et al., 2001). Reverse transcription (RT) of 0.5 μg RNA for rat liver or 2.5 μg RNA for rat brain was performed using the First-Strand cDNA Synthesis Kit from MBI Fermentas (Flamborough, ON, U.S.A.) in a total volume of 20 μl following manufacturer's instructions. Standard PCR curves with sequential dilutions of RT products were generated to establish linearity and to determine optimal template concentrations. A volume of 1 μl of RT product was then used for amplification of specific DNA sequences in the presence of 1 mM organic anion transporting polypeptide 2 (oatp2), 4 mM (mdr1a) and 1 mM (mdr1b) MgCl2, 200 μM dNTP and 50 pmol of each primer in a total volume of 100 μl using a GeneAmp™ 2400 Thermocycler (Perkin-Elmer, Mississauga, ON, Canada). The reaction was initiated by addition of 2.5 U of Taq polymerase (MBI Fermentas) and amplification proceeded through 30 cycles (mdr1a and mdr1b) or 26 cycles (oatp2). The following primer sequences were used for amplification: mdr1a, forward primer 5′-GAC GGA ATT GAT AAT GTG GAC A-3′, reverse primer 5′-AAG GAT CAG GAA CAA TAA A-3′ (nt 2022–2372 in GenBank #AF286167). Mdr1b, forward primer 5′-GAA ATA ATG CTT ATG AAT CCC AAA G-3′, reverse primer 5′-GGT TTC ATG GTC GTC GTC TCT TGA-3′ (nt 2012–2337 in GenBank L16546). Oatp2, forward primer 5′-TTG GTG TTG GAT GTG CAG TT-3′, reverse primer 5′-GCC AAT GGT CAT TCC TGT TT-3′ (nt 484–833 in GenBank #U95011). The temperature steps for each PCR cycle were as follows: for mdr1a or mdr1b, 45 s at 94°C, 30 s at 55°C, 1 min 30 s at 72°C and for oatp2, 1 min at 94°C, 2 min at 55°C, 2 min at 72°C. The PCR products were separated by electrophoresis on 2% agarose gels, stained with SYBR Gold™ nucleic acid stain (Molecular Probes, Eugene, OR, U.S.A.) and visualized by UV and automatic detection. Size of DNA bands (approximately 350 bp for each gene product) was confirmed using Gene Ruler™ 100 bp DNA ladder from MBI Fermentas. The optical densities of PCR products were quantitated using a DC120 camera and DS1D Scientific Imaging software (Eastman Kodak) and were normalized to 18S ribosomal RNA (rRNA) band intensities. For 18S quantification 10 μg of total RNA were heated at 65°C for 10 min, then electrophoresed on denaturing gels, stained with SYBR Green™ II RNA stain (Molecular Probes, Eugene, OR, U.S.A.), visualized and quantified as above. Location of 18S rRNA was confirmed using high-range RNA ladder (0.24–9.5 kb) from Fermentas.
3H-digoxin tissue distribution
3H-digoxin was used as a probe substrate to evaluate P-gp function in vivo 6, 24 or 48 h following the central administration of LPS. Animals were killed by decapitation at 2, 4, 8 or 16 h after intraperitoneal (i.p.) administration of 3H-digoxin (0.5 mg kg−1) followed by collection of plasma and tissues for total 3H-radioactivity measurements. In initial experiments, plasma radioactivity was maximally elevated in the LPS- versus the saline-treated rats at the 2 h time point (data not shown) and was chosen as the duration for our subsequent 3H-digoxin disposition analyses. Tissues were weighed, rinsed and homogenized in phosphate-buffered saline (pH 7.4) with a Polytron homogenizer. Total volume of the homogenate was measured to determine mass of tissue/ml−1 of suspension. A volume of 100 μl aliquots of each whole tissue homogenate or 200 μl of brain homogenate (in duplicate) were added to 6 ml of Beckman ready-safe scintillation cocktail and counted for total disintegrations per minute (DPM) using a Beckman LS5000TA scintillation counter (Beckman instruments, Fullerton, CA, U.S.A.). Similar procedures were used for digoxin disposition analysis that was performed in FVB wild-type or mdr1a−/− mice 24 h after i.c.v. injection of LPS.
Bile and intestinal elimination of 3H-digoxin
Saline- and LPS-treated male rats were pair fed for bile elimination studies based on the average amount of food normally eaten by LPS-treated rats. Rats were fed 2.5 and 12.5 g of food on the day of and day after i.c.v. LPS or saline treatment. At 24 or 48 h after i.c.v. injection of LPS, rats were anaesthetized with sodium pentobarbital (60 mg kg−1 i.p.). A tracheotomy was performed and animals were allowed to breath spontaneously. Body temperature was maintained at 37°C with a heating lamp. A heparinized arterial-venous loop was inserted from the internal carotid artery to the jugular vein to allow for i.v. 3H-digoxin administration and arterial blood collection. The common bile duct was cannulated with PE10 polyethylene tubing. After surgical procedures animals were continuously infused with heparin (5 IU) in physiological saline (0.9% w/v) at 5 μl min−1. At 10 min after completion of surgery, 0.5 mg kg−1 of 3H-digoxin was administered at a rate of 100 μl min−1 over approximately 2 min into venous side of the arterial-venous loop. At 5 min after completing the 3H-digoxin infusion, the first of three successive 30 min bile collections was started. Arterial blood samples (120 μl) were drawn directly into capillary pipettes from the arterial-venous loop at the times corresponding to the beginning and end of each bile collection interval (5, 35, 65 and 95 min). Blood was then transferred to a microcentrifuge tube containing 1 IU of heparin and centrifuged immediately to separate the plasma. Aliquots of plasma (50 μl) and bile (20 μl) were counted for total 3H-radioactivity as described above. At the end of the experiment, the small intestines were removed and flushed with 10 ml of phosphate-buffered saline (pH 7.4) to collect intestinal contents for total radioactivity determination. For the inhibition experiments 3H-digoxin (0.5 mg kg−1) was administered as above followed by a single 30 min control bile collection interval. CSA (10 mg kg−1), estrone-3 sulfate (2.5 or 5.0 mg kg−1) or vehicle ethanol/saline (60/40%) was administered i.v. at a rate of 25 μl min over approximately 4 min at the start of the second bile collection period.
Thin layer chromatography 3H-digoxin measurements
Thin layer chromatography (TLC) was performed according to previously published methods that separate digoxin from its major metabolites (Carvalhas & Figueira, 1973; Harrison & Gibaldi, 1976). Plasma samples, 750 μl were extracted three times in 2.5 ml of chloroform/methanol (9 : 1 v/v). The organic layer was evaporated under a stream of N2 and sample was resuspended in 5 μl of 95% ethanol. Extracted plasma and crude bile samples were streaked on 10 × 2.5 cm2 silica gel GF plates (Analtech Inc, Newark, DE, U.S.A.) and developed twice in an ethylacetate/chloroform/acetic acid (90 : 5 : 5) mobile phase. Controls of standard 3H-digoxin, resuspended in blank plasma or bile samples were used for comparison. Sections of the plate (0.3–0.5 cm) from the origin to the solvent front were scraped and counted for 3H-radioactivity. The percentage of DPM associated with parent digoxin was calculated as follows: % 3H-digoxin=DPM associated with digoxin peak/total DPM recovered from TLC plate.
Western blot immunoassay
Detailed methods for our Western blotting protocol have been previously reported (Renton & Nicholson, 2000). Briefly, 25 μg of hepatic microsomal protein was separated by electrophoresis under nonreducing conditions with a 7.5% SDS-polyacrylamide gel. Proteins were transferred to Immobilon-P membrane. Blots were blocked for 1 h in 5% skim milk followed by incubation with mouse anti-rat CYP3A1/2 monoclonal antibody 2-13-1 (National Institutes of Health, Bethesda, MD, U.S.A.) (1 : 5000) in 2% skim milk for 1 h at room temperature and then anti-mouse horseradish peroxidase-conjugated secondary antibody (1 : 5000) in 5% skim milk for 1 h at room temperature. Immunoreactivity was detected by chemiluminescence (Amersham Pharmacia Biotech, U.K.) and exposure to X-ray film. Band intensities were assessed with Molecular Analyst (Bio-Rad) and expressed as a percentage of the saline control.
Data analysis and statistics
Radioactivity in each plasma, tissue and bile sample was recorded as disintegrations per minute (DPM). Background radioactivity (10–20 DPM) was subtracted to measure specific DPM. Tissue 3H-radioactivity was expressed as DPM mg−1 of tissue and plasma and bile 3H-radioactivity as DPM ml−1. After correction for metabolism, the plasma or bile 3H-digoxin was expressed as ng ml−1. ClBile of radioactivity equals the amount of total DPM eliminated in the bile over each time interval divided by the area under the plasma DPM versus time curve (AUC) for each time interval. AUC (linear trapezoidal rule) was calculated with the plasma DPM data at the beginning and end of each collection interval. Data are presented as mean±s.e.m. of at least three experiments. A two-tailed unpaired t-test or Wilcoxin's rank-sum test (nonparametric data) was used for statistical comparison between two groups. For multiple comparison procedures, an analysis of variance (ANOVA) or Kruskal–Wallis ANOVA on ranks (nonparametric data) was used followed by the Student–Newman–Keuls test for post hoc analysis. A difference in mean values with a value of P⩽0.05 was considered to be significant.
Chemicals and reagents
CYP3A1/2 mouse anti-rat monoclonal antibody (#2-13-1) was kindly provided by Dr. H. Gelboin, National Cancer Institute, NIH, (Bethesda, MD, U.S.A.). Unlabeled digoxin and E. coli LPS (serotype 0127 : B8) were obtained from Sigma, (St Louis, MI, U.S.A.). Enflurane was obtained from Abbott Laboratories, Saint Laurent, Quebec, Canada. 3H-digoxin was obtained from Perkin-Elmer (Boston, MA, U.S.A.). CSA was obtained from Sandoz Canada Inc. (Dorval, Quebec, Canada). All other chemicals were of the highest grade available from commercial suppliers.
Results
Induction of CNS inflammation by direct administration of LPS into the lateral ventricle
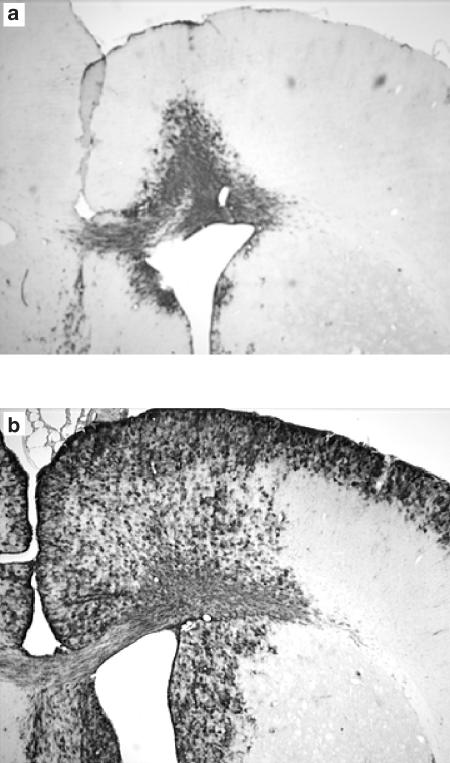
The characterization of localized CNS inflammation induced by i. c.v. administration of 25 μg of LPS to rats has previously been reported by our laboratory (Nicholson & Renton, 2001; Renton & Nicholson, 2000). Hsp25 immunoreactivity in the brain was used as a marker in the current study to validate the LPS-evoked inflammatory response in the CNS of rats. As shown in Figure 1 hsp25 was extensively expressed throughout the brain 48 h after LPS (25 μg) was administered i.c.v. In saline–treated rats only minor responses were detected in the region of the injection needle track. Similar expression was also observed 24 h after LPS administration (data not shown).
Figure 1.
Representative effect of LPS given directly into the lateral ventricle on the expression of hsp25 in male rat brain. Coronal brain sections (30 μm) were exposed to anti-mouse/rat hsp25 antibody 48 h after 5 μl saline (a) or 25 μg of LPS (b) was injected directly into the left lateral ventricle. In all LPS-treated animals the sections demonstrated prolific hsp25 reactivity around the area of the lateral ventricle and the cerebral cortex, whereas in the saline-treated rats minor reactivity was observed only around the needle track and injected ventricle, n=4.
Effect of CNS inflammation on mdr1a, mdr1b mRNA expression in the male rat brain and liver
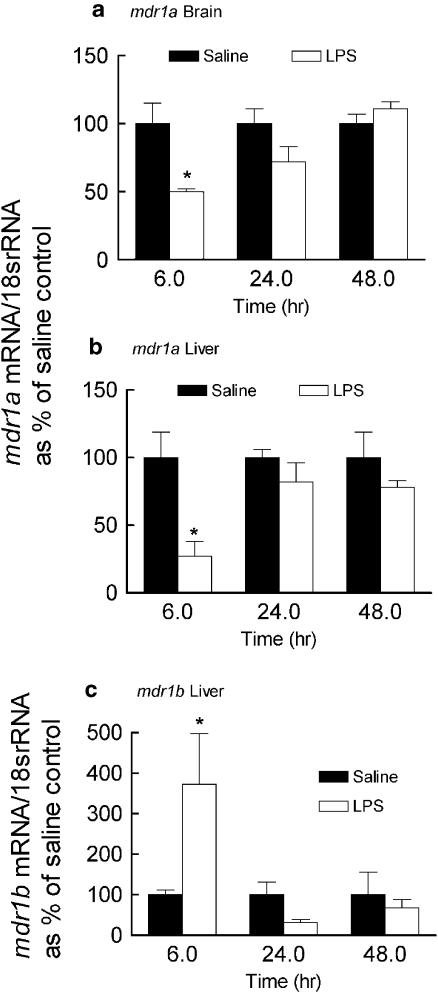
In LPS-treated animals, brain and hepatic mdr1a mRNA were rapidly and maximally downregulated (50 and 70%, respectively) compared to saline controls at 6 h and were similar to the saline control at 24 and 48 h (Figure 2a and b). The expression of hepatic mdr1b mRNA was induced at 6 h (300% of control) and was not significantly different from the saline time controls at 24 or 48 h following LPS treatment (Figure 2c). We measured mdr1b mRNA only in the liver because it is minimally expressed in the brain (Croop et al., 1989).
Figure 2.
Effect of LPS given directly into the lateral ventricle of the brain on the expression of mdr1a (brain and the liver) and mdr1b (liver) mRNA. Brains and livers were collected from male rats at 6, 24 and 48 h following LPS (25 μg) or saline (5 μl) administration into the lateral ventricle. Semiquantitative RT-PCR analysis was performed to determine brain and liver mdr1a (a and b) and liver mdr1b (c) mRNA levels. For each time point the mdr1a or mdr1b/18s rRNA ratios are reported as a percentage of the saline control (mean ±s.e.m. of three or four separate measurements). *P<0.05 compared to respective saline control, unpaired t-test or Wilcoxin's rank-sum test (mdr1b 6 h time point only).
The disposition of 3H-radioactivity after administration of 3H-digoxin to rats
The disposition of the P-gp substrate digoxin at three discrete times (6, 24 and 48 h) following i.c.v. injection of LPS or saline is illustrated in Table 1. In rats given LPS for 6 or 24 h, the total plasma radioactivity (2 h after the i.p. administration of 3H-digoxin) was increased by 300 and 150%, respectively, compared to the saline-treated controls. Significant increases in tissue 3H-radioactivity also occurred in the liver, kidney and brain of the LPS-treated (6 and 24 h) rats, but the tissue/plasma ratio of 3H-radioactivity for those organs was unchanged. No differences in intestinal content of 3H-radioactivity were observed and the intestine/plasma ratio of radioactivity significantly decreased for that organ in LPS-treated rats at 24 h. At 48 h after LPS treatment, total plasma 3H-radioactivity remained elevated (160%) but all tissue 3H-radioactivity levels were similar to controls. The elevated plasma 3H-radioactivity and nonchanging tissue 3H-radioactivity level were reflected as decreases in tissue/plasma 3H-radioactivity in the brain, liver, kidney and small intestine in LPS-treated relative to the saline control animals.
Table 1.
Effect of direct administration of LPS (25 μg) into the lateral ventricle on the tissue distribution of 3H-radioactivity after 3H-digoxin administration to male Sprague–Dawley rats
| Tissue | Treatment | 6 h | 24 h | 48 h |
|---|---|---|---|---|
| DPM g−1 tissue | ||||
| Plasmaa | Saline | 2400±400 | 1700±300 | 1700±500 |
| LPS | 7300±1000** (300) | 2600±400 (152) | 2800±400 (164) | |
| Liver | Saline | 18000±3000 | 14000±1000 | 12000±3000 |
| LPS | 37000±6000* (206) | 20000±3000* (143) | 13000±1000 (108) | |
| Brain | Saline | 630±60 | 650±40 | 520±70 |
| LPS | 1000±100* (160) | 890±90* (137) | 590±90 (113) | |
| Kidney | Saline | 4300±600 | 3900±400 | 5300±1000 |
| LPS | 12000±1000** (280) | 6100±800* (156) | 5900±600 (111) | |
| Small intestine | Saline | 33000±9000 | 15000±2000 | 18000±4000 |
| LPS | 51000±4000 (155) | 14000±1000 (93) | 12000±2000 (66) | |
| Tissue/plasma DPM ratio | ||||
| Liver | Saline | 6.6±1.1 | 9.0±1.0 | 8.8±1.1 |
| LPS | 4.3±1.2 | 9.3±0.8 | 5.3±0.5** | |
| Brain | Saline | 0.22±0.06 | 0.51±0.1 | 0.68±0.17 |
| LPS | 0.12±0.01 | 0.47±0.1 | 0.25±0.04* | |
| Kidney | Saline | 1.4±0.3 | 2.6±0.3 | 4.4±1.0 |
| LPS | 1.3±0.2 | 2.7±0.2 | 2.7±0.2* | |
| Small intestine | Saline | 12.0±4.0 | 9.2±1.8 | 15.0±3.6 |
| LPS | 6.0±1.0 | 4.7±0.7* | 5.2±0.9* | |
LPS (25 μg) or saline (5 μl) was administered directly into the lateral ventricle of male rats and 3H-digoxin (0.5 mg kg−1) was given i.p. 6, 24 or 48 h later. Animals were killed 2 h post digoxin administration for collection of tissues and plasma.
Plasma radioactivity is expressed as DPM ml−1. Tissue/plasma ratio represents the 3H-radioactivity g−1 of tissue divided by the 3H-radioactivity in 1 ml of plasma. In parentheses is shown the percentage of difference in total radioactivity in LPS- versus saline-treated animals. Data are represented as the mean±s.e.m. of 4–8 measurements. Each time point (6, 24 or 48 h) was performed as a discrete experiment on separate occasions; thus, within each time period an unpaired two-tailed t-test was used to compare LPS-treated rats to the respective saline time controls
P< 0.05
P< 0.01.
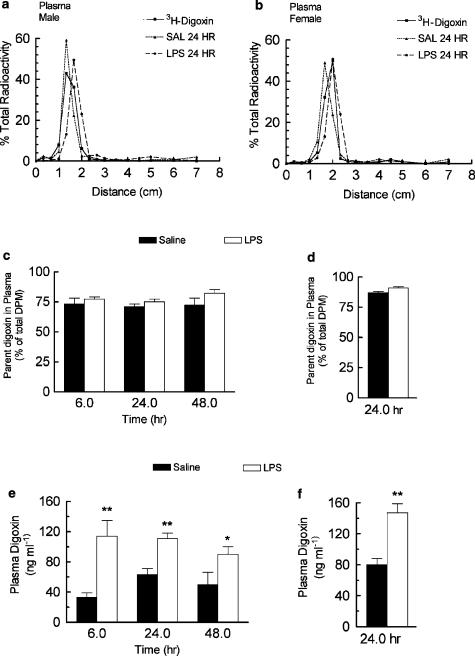
TLC was used to determine the percentage of radioactivity in the plasma that was associated with parent digoxin (Figure 3a). In male rats, plasma radioactivity was primarily (>70%) associated with the parent compound as identified by comigration with standard digoxin (rf 0.23–0.28) on TLC plates. The % radioactivity recovered as parent drug was identical in saline- and LPS-treated male rats 6, 24 and 48 h after treatment and suggested that altered metabolism was not primarily responsible for the observed increase in plasma radioactivity (Figure 3c). When corrected for metabolism, 3H-digoxin concentration (ng ml−1) in the plasma was significantly elevated in male rats treated with LPS at 6 h (330%), 24 h (175%) and 48 h (180%) compared to the respective saline controls (Figure 3e). To further rule out metabolism as a major contributor to the increase in digoxin plasma concentration observed in LPS-treated male rats, we performed a single digoxin disposition experiment in female rats, which does not appreciably metabolize digoxin (Salphati & Benet, 1999) (Table 2). Changes in digoxin tissue disposition in female rats were similar to that observed in males. In female rats, however, the amount of parent digoxin recovered (percentage of total radioactivity) in the plasma was about 90% (Figure 3d), which is consistent with decreased digoxin metabolism in female rats. At 24 h after LPS treatment, plasma digoxin was elevated (183%) in female, which is similar to that observed in males (Figure 3f).
Figure 3.
Effect of LPS given directly into the lateral ventricle of the brain on the plasma concentration of digoxin. LPS (25 μg) or saline (5 μl) was administered directly into the lateral ventricle of rats and 3H-digoxin (0.5 mg kg−1) was given i.p. 6, 24 or 48 h (male) or 24 h (female) later. Blood samples were collected 2 h later for determination of plasma radioactivity level. Representative TLC detection of 3H-digoxin in plasma extracts, the parent digoxin recovered in the plasma (as a percentage of total radioactivity) and plasma digoxin (ng ml−1) are shown, respectively, in (a, c, e) for male and (b, d, f) for female rats. Data are represented as the mean ±s.e.m. of four to eight separate measurements. 3H-digoxin recovered in standards were >95%. *P< 0.05, **P< 0.01 plasma 3H-digoxin was significantly higher in LPS compared to the corresponding saline control, unpaired t-test (male 48 h). Wilcoxin's rank-sum test (male 6, 24 h and female 24 h).
Table 2.
Effect of direct administration of LPS (25 μg) into the lateral ventricle on the tissue distribution of 3H-radioactivity after 3H-digoxin administration to female Sprague–Dawley rats
| 24 h after LPS administration | ||||
|---|---|---|---|---|
| Tissue radioactivity | Tissue/Plasma | |||
| (DPM g−1 tissue)a | radioactivity ratio | |||
| Saline | LPS | Saline | LPS | |
| Plasmaa | 4400±400 | 7600±700** (1 7 3) | ||
| Brain | 990±50 | 1300±90*(1 3 1) | 0.23±0.03 | 0.18±0.02 |
| Liver | 25000±1800 | 37000±2300**(1 4 8) | 5.8±0.4 | 5.1±0.6 |
| Kidney | 7000±700 | 12000±500***(1 7 1) | 1.6±0.1 | 1.5±0.1 |
| Small intestine | 29700±3600 | 31900±7000 (1 0 7) | 7.1±1.2 | 4.5±1.4 |
Female rats were treated as indicated in Table 1 aPlasma radioactivity is expressed as DPM ml−1. In parentheses are shown the % difference in total radioactivity in LPS versus saline-treated animals. Tissue/plasma ratio represents the radioactivity g−1 of tissue divided by the radioactivity in 1 ml of plasma. Data are represented as the mean±s.e.m. of 4–5 measurements.
P< 0.05
P<0.01
P< 0.001 different compared to the saline-treated rats, unpaired t-test.
Effect of CNS inflammation on the biliary and intestinal elimination of 3H-digoxin
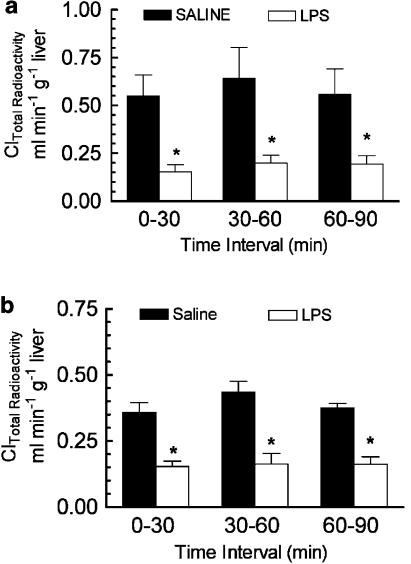
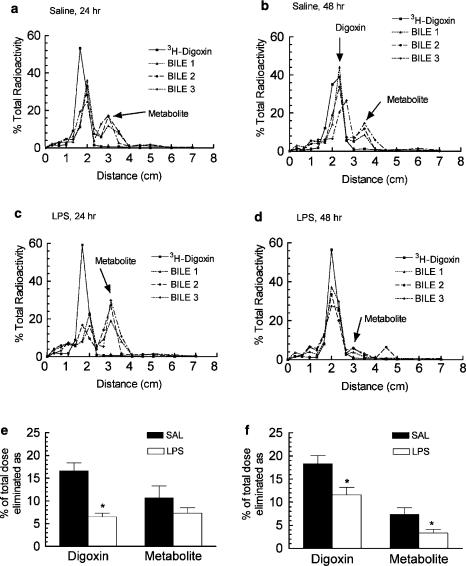
The effect of CNS inflammation on 3H-digoxin elimination in the bile was determined in anaesthetized male rats 24 or 48 h after i.c.v. LPS or saline administration. Total 3H-radioactivity clearance (Cl) was decreased 70% after 24 h and 50% after 48 h in the LPS-treated rats compared to the respective saline controls (Figure 4a and b). Representative thin-layer chromatograms for bile samples collected from saline- and LPS-treated male rats are shown in Figure 5a–d. The TLC analysis demonstrated that the majority of the radioactivity in the bile was resolved as digoxin and a primary metabolite peak. Cleavage of digoxin to the bis-digitoxide is the first step in metabolism of the parent compound (Carvalhas & Figueira, 1973; Salphati & Benet, 1999). Although the precise identity of the metabolite peak was not determined, the major metabolite corresponded to the known rf value of digoxigenin-bis-digitoxide (0.4). When corrected for metabolism, the total biliary elimination of digoxin (percentage of original i.v. dose) was reduced by 60% after 24 h LPS-treated rats (Figure 5e).
Figure 4.
Effect of LPS administered directly into the lateral ventricle on the biliary Cl of 3H-radioactivity after 3H-digoxin administration. Male rats were given a single i.c.v. injection of LPS (25 μg) or saline (5 μl). 3H-digoxin (0.5 mg kg−1) was administered i.v. 24 h (a) or 48 h (b) later. Biliary Cl was measured over three consecutive 30 min intervals starting 5 min after completing the injection of 3H-digoxin. Each bar represents the mean biliary Cl of total 3H-radioactivity ±s.e.m. of three to four separate measurements. *P<0.05, significantly different compared saline control, ANOVA followed by Student–Newman–Keuls post hoc test.
Figure 5.
Effect of LPS administered directly into the lateral ventricle on the biliary elimination 3H-digoxin. Male rats were treated as indicated in the legend of Figure 4. Representative TLC detection of digoxin is shown for 24 h and 48 h saline (a, b) and LPS- (c, d) treated rats. Bile samples 1, 2, and 3 represent the three collections from an individual experiment. Digoxin (rf=0.23–0.28) was identified as the peak that comigrated with the standard 3H-digoxin. The amount of digoxin and metabolite eliminated in the bile (as percentage of the digoxin dose) are shown for the 24 h (e) and 48 h (f) treatment groups. Each bar represents the mean 3H-digoxin or metabolite eliminated in the bile over the 1.5 h experimental duration ±s.e.m. of three to four separate measurements. *P<0.05 significantly different compared saline control, unpaired t-test.
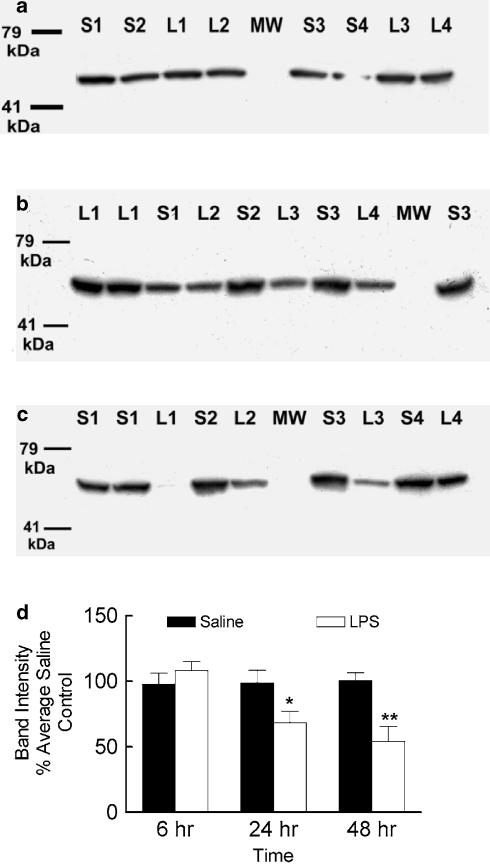
After 48 h of LPS treatment the biliary elimination of digoxin was reduced by 40%. There was also a reduction (50%) in the major metabolite peak (Figure 5f) compared to the saline control and suggesting that CNS inflammation may also downregulate hepatic metabolism of digoxin. The microsomal levels of CYP3A1/2 protein at 6, 24 and 48 h after LPS or saline was administered i.c.v. was measured using a CYP3A1/2 monoclonal antibody, which produced a single band with a molecular weight of about 55 kDa on Western blots (Figure 6a–c). In LPS-treated male rats, hepatic CYP3A1/2 expressed protein was similar at 6 h, and decreased at 24 h (32%) and 48 h (46%) compared to the respective saline controls (Figure 6d).
Figure 6.
Representative Western blots demonstrating the effect of LPS administered directly into the lateral ventricle of male rats on the hepatic microsomal expression of CYP3A1/2 protein 6 h (a), 24 h (b) or 48 h (c) after treatment. Lanes S1–S4 and L1–L4 represent individual saline or LPS-treated animals, respectively. The results of densitometry analysis (d) are expressed as the mean density ±s.e.m. of four individual samples repeated in duplicate or triplicate. For the individual Western blots, the band intensities were normalized to the average band intensity of the saline-treated animals and allowed for pooling of the replicated data. *P<0.05, **P<0.01, compared to the saline time control, unpaired t-test.
At the end of the 1.5 h bile Cl experiment, the total small intestinal contents were collected and the percentage of intestinal 3H-radioactivity was determined. Since the common bile duct was ligated all 3H-radioactivity in the small intestine represents direct intestinal excretion. The total intestinal elimination of 3H-radioactivity (% of the initial dose) was identical between saline and LPS-treated rats 24 h (5.9±1.1 versus 6.0±0.9) and 48 h (6.7±0.3 versus 7.5±1.0) after induction of CNS inflammation.
Effect of CSA on the biliary elimination of digoxin
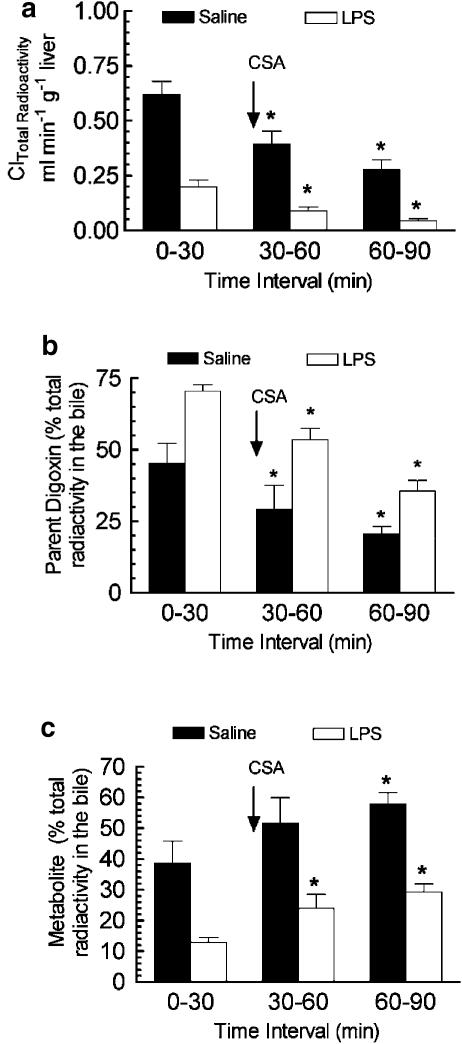
CSA is an established P-gp substrate that can competitively inhibit the transport of other P-gp substrates (Ando et al., 2001). We performed inhibition experiments with CSA to identify P-g-mediated digoxin transport into the bile. CSA administered at the start of the second bile collection interval significantly reduced the biliary Cl of total radioactivity in both saline- and LPS-treated rats compared to the first bile collection period (Figure 7a). TLC analysis of the bile samples indicated that the presence of CSA resulted in a decrease in the percentage of radioactivity in the bile recovered as the parent drug digoxin (Figure 7b) and an increase in the percentage of radioactivity recovered as the metabolite (Figure 7c). When the vehicle (ethanol/saline, 60/40%) was administered no change in biliary Cl of total 3H-radioactivity was observed (data not shown).
Figure 7.
Effect of administration of the P-gp inhibitor CSA on the biliary Cl of total 3H-radioactivity (a) and the percentage of radioactivity recovered in the bile as digoxin (b) and metabolite (c). Inhibition experiments were carried out 48 after i.c.v. LPS or saline treatment. 3H-digoxin (0.5 mg kg−1) was administered 5 min prior to the start of the first bile collection period (control collection) and a single i.v. injection of CSA (10 mg kg−1) was given at the start of the second bile collection interval. Each bar represents the mean ±s.e.m. of three to four separate measurements. *P<0.05, within treatment group, significantly different compared to the first bile collection interval, ANOVA followed by Student–Newman–Keuls post hoc test.
Depression of oatp2 mRNA levels in response to CNS inflammation
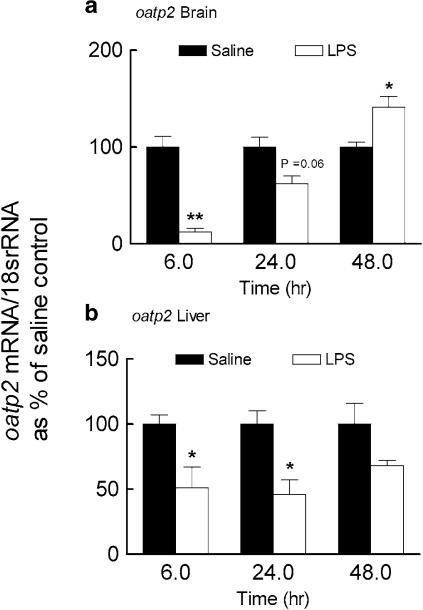
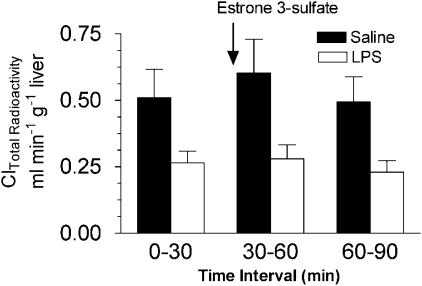
The rat oatp2 transports digoxin with high affinity in vitro (Km=0.24 μM), mediates digoxin uptake into isolated hepatocytes and it has been hypothesized that oatp2 may contribute to the first step in hepatic elimination of digoxin and its uptake into the CNS (Noe et al., 1997; Gao et al., 1999; Reichel et al., 1999; Kodawara et al., 2002). Brain oatp2 mRNA was almost completely abolished 6 h after the induction of inflammation (Figure 8a). At 24 h, brain oatp2 mRNA partially returned to normal levels and at 48 h was significantly elevated (140%) compared to saline control. In LPS-treated rats, hepatic oatp2 mRNA was decreased at 6 h and 24 h but was similar to control level at 48 h (Figure 8b). These results suggested that a depression in oatp2 expression might contribute to altered digoxin elimination in the bile. However, when the oatp2 substrate estrone 3-sulfate (2.5 or 5.0 mg kg−1) was administered instead of CSA no change in biliary Cl of total 3H-radioactivity was observed (Figure 9).
Figure 8.
Effect of LPS given directly into the lateral ventricle of the brain on the expression of oatp2 mRNA in the brain (a) and the liver (b). Brains and livers were collected 6, 24 and 48 h following LPS (25 μg) or saline (5 μl) administration into the lateral ventricle. Oatp2 mRNA was determined by semiquantitative RT-PCR analysis. For each time point the oatp2/18s rRNA ratios are reported as percentage of the saline control (mean±s.e.m. of three or four separate measurements). *P< 0.05, **P< 0.01 compared to respective saline control, unpaired t-test.
Figure 9.
Effect of administration of the oatp2 substrate estrone 3-sulfate on the biliary Cl of total 3H-radioactivity. Inhibition experiments were carried out 48 after i.c.v. LPS or saline treatment. 3H-digoxin (0.5 mg kg−1) was administered 5 min prior to the start of the first bile collection period (control collection) and a single i.v. injection of estrone 3-sulfate (2.5 or 5 mg kg−1) was given at the start of the second bile collection interval. Each bar represents the mean ±s.e.m. of three to four separate measurements.
Tissue distribution of digoxin in mdr1a−/− mice
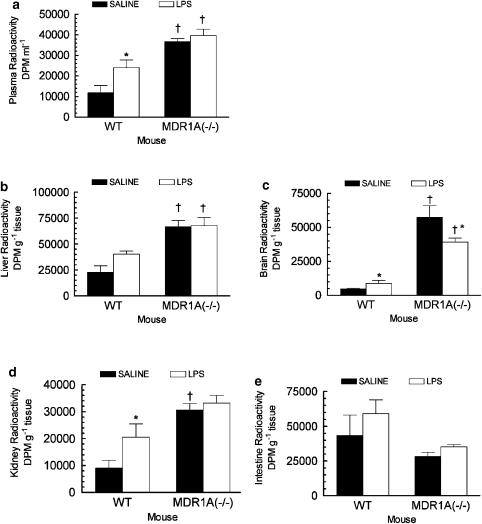
When LPS (2.5 μg) was administered i.c.v. to mdr1a+/+ mice, total radioactivity was significantly increased in plasma (200%), brain (160%) and kidney (230%) 2 h after i.p. administration of 3H-digoxin (0.5 mg kg−1) compared to the saline-treated mdr1a+/+ mice (Figure 10). Hepatic total radioactivity was increased (170%) in LPS- versus saline-treated mdr1a+/+ mice. A power calculation indicated that with the observed average standard deviation (11,500 DPM g−1), 8 animals per group would be required to detect a statistical difference (P<0.05) between the means of these two groups when the power of the performed test=80%. In mdr1a−/− mice LPS had no effect on plasma, liver, kidney or intestinal radioactivity compared to the saline-treated animals. Interestingly, there was a lower accumulation of radioactivity in the brain of mdr1a−/− mice treated with LPS compared to the saline controls. The increased tissue and plasma radioactivity observed in mdr1a−/− mice compared to mdr1a+/+ mice confirms the validity of digoxin as a probe for mdr1a-expressed P-gp function in vivo.
Figure 10.
Effect of administration of 2.5 μg of LPS directly into the lateral ventricle of mdr1a expressing (mdr1a+/+) and deficient mice (mdr1a−/−) on the plasma (a), liver (b), brain (c), kidney (d) and small intestine (e) levels of total radioactivity. 3H-digoxin (0.5 mg kg−1) was administered 24 h following the i.c.v. injection of LPS or saline and animals were killed 2 hr later for collection of tissues and plasma. Each bar represents the mean ±s.e.m. of four separate measurements. *P< 0.05, compared to the mdr1a+/+ saline treated animals, †P< 0.05, compared to the saline or LPS mdr1a+/+ treated animals, ANOVA (plasma, kidney and intestine) or Kruskal–Wallis ANOVA on ranks (brain and liver) followed by Student–Newman–Kuels post hoc test.
Discussion
In experimental models, the central administration of LPS produces a robust inflammatory response in the brain and is characterized by: activation of microglia, astrocytes and proinflammatory cytokine pathways, the release of inflammatory cytokines (TNF-α, IL-β and IL-6) and the infiltration of leukocytes into that organ (Perry et al., 1993; Nadeau & Rivest, 2002). Bacterial LPS is the major stimuli for such inflammatory responses in CNS infections caused by Gram-negative meningeal pathogens (Scheld et al., 2002). In addition, the overproduction and release of inflammatory cytokines may contribute to the pathogenesis of traumatic head injury or diseases of the CNS such as multiple sclerosis, HIV dementia, Alzheimer's and Parkinson's disease (de Vries et al., 1997; Gonzalez-Scarano & Baltuch, 1999). During those CNS disorders with an associated inflammatory component, a reduction in brain and hepatic drug P-gp function could greatly increase the risk for harmful drug interactions or toxicity.
We have demonstrated for the first time that inflammation localized to the CNS can alter the hepatic elimination of a known P-gp substrate digoxin. Inhibition of transport-mediated elimination of digoxin by CNS inflammation was supported by our observations that biliary elimination of parent digoxin was depressed in LPS- versus saline-treated rats. In the presence of the P-gp inhibitor CSA, the ratio of parent digoxin to metabolite detected in the bile was reduced and provided evidence of P-gp-mediated transport of digoxin into the bile. These results are consistent with the loss of hepatic mdr1a mRNA expression as detected by RT-PCR and support the hypothesis that reduced P-gp expression/function contributes to reduced biliary elimination and increased plasma digoxin in rats with CNS inflammation. The induction of hepatic mdr1b mRNA does not correlate with decreased digoxin elimination and indicated that this change did not appreciably contribute to the biliary elimination of digoxin. Other studies have also shown that the distribution and elimination of digoxin is not substantially altered in the absence of mdr1b (Mayer et al., 1996; Schinkel et al., 1997). Interestingly, CSA reduced 3H-radioactivity Cl to lower levels in rats with CNS inflammation. Thus, drug interactions involving P-gp may be more profound during episodes of inflammation when the basal capacity to eliminate drugs is already reduced.
An impairment of luminal (P-gp) transport of digoxin in the organs of drug elimination (liver, kidney and intestine) during CNS inflammation would be predicted to result in decreased digoxin elimination, and increased intracellular and plasma concentrations of digoxin. Impairment of P-gp in the blood–brain barrier would be predicted to result in increased brain uptake of digoxin (Schinkel et al., 1995). The maximal percentage increases in plasma digoxin and, brain and liver radioactivity observed in LPS-treated rats coincided with the time (6 h) of maximal loss in brain or hepatic mdr1a expression and is consistent with a loss in P-gp function in those organs. Although hepatic and brain mdr1a mRNA returned to control levels by 24 h, brain, hepatic and plasma radioactivity remained higher and bile elimination of digoxin was reduced in LPS- versus saline-treated rats. Functionally, this would be expected since the half-life of P-gp is approximately 20 hr (Zhang & Ling, 2000). The elevated plasma, brain, kidney and liver radioactivity in mdr1a+/+ but not in mdr1a−/− LPS-treated mice further support that changes to mdr1a/P-gp expression or function continue to affect the disposition of digoxin up to 24 h after the administration of LPS into the CNS. The observation that LPS-treated mdr1a−/− mice displayed a decreased accumulation of brain digoxin compared to the saline-treated mdr1a−/− mice supports the idea that CNS inflammation may also have reduced a transport mechanism for digoxin uptake into the brain. If a process for digoxin uptake into the brain is reduced, it may explain why administering LPS directly into the lateral ventricle of wild-type mice or rats only produced modest increases in digoxin accumulation in the brain as compared to the larger increases in plasma digoxin concentration.
At variance to mdr1a, brain and liver oatp2 mRNA levels in LPS-treated rats recovered more slowly to control levels. One may envision that if basolateral transport process for digoxin was depressed by CNS inflammation and recovered more slowly than luminal efflux transport processes (P-gp) an increased plasma digoxin concentration would be maintained but tissue levels would decrease (i.e. decrease tissue/plasma digoxin). The decrease in oatp2 expression may in part explain the reduced hepatic elimination of digoxin and reduction in brain and liver radioactivity compared to plasma radioactivity 48 h after the administration of LPS. However, estrone 3-sulfate, a substrate of oatp2 (Cattori et al., 2001) did not block the biliary Cl of 3H-radioactivity after 3H-digoxin administration. This result suggested that blocking P-gp has more relevance for altered digoxin elimination in the bile but may also indicate that other basolateral uptake processes for digoxin exist in the liver.
The activities of several hepatic P450 enzymes are downregulated after CNS inflammation (Nicholson & Renton, 2001; Renton & Nicholson, 2000). Digoxin has been reported to undergo significant metabolism in male rats via CYP3A1/2 in liver microsomes (Harrison & Gibaldi, 1976; Salphati & Benet, 1999). In the present study, we have demonstrated for the first time that hepatic CYP3A1/2 protein is depressed following the i.c.v. injection of LPS. This reduced hepatic CYP3A level likely did not greatly contribute to the increases in plasma digoxin and tissue radioactivity that were observed at 6 and 24 h as this enzyme was minimally altered at those times. However, at 48 h after induction of inflammation the digoxin metabolite profile in the bile indicated that an alteration in metabolism contributed in a minor way to the overall loss in digoxin elimination by the liver at this time. A simultaneous depression of CYP3A and P-gp during episodes of inflammation could have severe clinical implications for impaired elimination of the many drugs that are both metabolized by CYP3A and transported by P-gp.
In our studies, the observed changes in intestinal to plasma distribution of radioactivity likely occur only as a consequence of CNS inflammation-induced alterations in hepatic digoxin elimination. Decreased biliary secretion of digoxin into the small intestine is confirmed by the decreased intestinal/plasma radioactivity in the LPS- versus saline-treated rats. Moreover, saline- and LPS-treated rats with ligated bile ducts did not demonstrate differences in intestinal content of radioactivity. Systemic inflammation induced by K. pneumoniae decreased renal mdr1a levels and elimination of rhodamine123 by that organ (Ando et al., 2001). The observed increases in renal radioactivity in rats (6 and 24 h) and mdr1a+/+ mice (24 h) treated with LPS also suggested that CNS inflammation might reduce digoxin elimination by the kidney.
During systemic inflammation, Ando et al. (2001) and Zhao et al. (2002) have demonstrated a decrease in the biliary Cl of the P-gp substrate rhodamine123, a 30% reduction of P-gp detected in the brain and a corresponding increase in the brain uptake of doxorubicin 6 h after but not 24 h after administration of K. pneumoniae endotoxin. In contrast, our data obtained during inflammation localized in the CNS produced a more prolonged effect on the disposition of the P-gp substrate digoxin into the brain and liver. In the present study, hepatic mdr1a mRNA was reduced as early as 6 h after i.c.v. administration of E. coli LPS (25 μg), which is similar to that found generated by peripheral administration of K. pneumoniae endotoxin (Ando et al., 2001). Piquette-Miller et al. (1998) demonstrated a more prolonged reduction in hepatic mdr1a mRNA and P-gp up to 48 h after the peripheral administration of E. coli LPS (5 mg kg−1). The differences observed in these studies may indicate that the mechanisms that lead to a loss in mdr1a expression and P-gp function after CNS inflammation are different from that of peripheral inflammation. The type of endotoxin (E. coli versus K. pneumoniae), the dose, the P-gp substrate (digoxin, doxirubicin and rhodamine123) studied and the site of endotoxin administration (peripheral versus central) may also contribute to the observed differences in the different models of inflammation.
Several lines of evidence support the idea that peripheral release of cytokines modulates hepatic mdr1a levels and digoxin elimination as a result of inflammation in the CNS. LPS administered i.c.v. (25 μg) causes inflammation that is localized to the CNS but also triggers an elevation in serum inflammatory cytokine (TNF-α, IFN-γ, IL-1β and IL-6) levels (Nicholson & Renton, 2001; Renton & Nicholson, 2000). In rodents, mdr1a is downregulated in the liver or hepatocytes 24 h following acute inflammation in the periphery induced by i.p administration of cytokines IL-6 and IL-1β (Hartmann et al., 2001; Sukhai et al., 2001). Ando et al. (2001) demonstrated that the pentoxyfilline (an inhibitor of TNF-α production) prevented the loss in biliary elimination of rhodamine123 after administration of K. pneumoniae endotoxin. Alternatively, endogenous compounds that are substrates for P-gp including inflammatory cytokines and corticosterone (Wolf & Horwitz, 1992; Drach et al., 1996) that are released after administration of LPS may inhibit P-gp-mediated drug transport, especially at the earlier time points. Lastly, LPS may also decrease P-gp transport activity through protein kinase-mediated phosphorylation of P-gp (Miller et al., 1998; Tepperman et al., 2000).
It has been suggested that the expression of P-gp may be important in the immune response (Panwala et al., 1998; Johnstone et al., 2000). P-gp and members of the oatp family transport endogenous molecules, which are involved in inflammation including steroids, leukotrienes, prostaglandins and cytokines (Schinkel et al., 1995; Drach et al., 1996; Meijer et al., 1998). It should be a priority to investigate if the loss in expression of these transporters in the brain and liver are important for regulating the body disposition of inflammatory/antiinflammatory mediators during episodes of inflammation.
In summary, our findings indicate that in addition to modulating drug biotransformation in the CNS and periphery (Renton & Nicholson, 2000), inflammation localized in the CNS may also modulate drug disposition through effects on drug transport proteins in the liver and brain. In the liver, a depression of P-gp could alter the transport and elimination of a number of important drugs and lead to drug toxicity. Most importantly, the loss of mdr1a/P-gp expression in the brain could have consequences for the passage of endogenous/exogenous molecules between the brain and the periphery during inflammation. Conversely, inflammatory mechanisms that block P-gp expression in the brain may be useful to facilitate drug delivery to that organ during the treatment of CNS disorders.
Acknowledgments
This work was supported by the Canadian Institutes for Health Research. Kerry Goralski was a recipient of a Reynolds Fellowship and Nova Scotia Health Research Foundation Fellowship. Sandi Dibb provided technical assistance.
Abbreviations
- Cl
clearance
- CNS
central nervous system
- CSA
cyclosporin A
- CYP
cytochrome P450, HSP25, heat shock protein 25
- i.c.v.
intracranial ventricle
- i.p.
intraperitoneal
- LPS
lipopolysaccharide
- mdr
multidrug resistance
- Oatp
organic anion transporting polypeptide
- P-gp
P-glycoprotein
References
- ANDO H., NISHIO Y., ITO K., NAKAO A., WANG L., ZHAO Y.L., KITAICHI K., TAKAGI K., HASEGAWA T. Effect of endotoxin on P-glycoprotein-mediated biliary and renal excretion of rhodamine-123 in rats. Antimicrob. Agents. Chemother. 2001;45:3462–3467. doi: 10.1128/AAC.45.12.3462-3467.2001. [DOI] [PMC free article] [PubMed] [Google Scholar]
- BEAULIEU E., DEMEULE M., GHITESCU L., BELIVEAU R. P-glycoprotein is strongly expressed in the luminal membranes of the endothelium of blood vessels in the brain. Biochem. J. 1997;326:539–544. doi: 10.1042/bj3260539. [DOI] [PMC free article] [PubMed] [Google Scholar]
- CARVALHAS M.L., FIGUEIRA M.A. Comparative study of thin-layer chromatographic techniques for separation of digoxin, digitoxin and their main metabolites. J. Chromatogr. 1973;86:254–260. doi: 10.1016/s0021-9673(01)81267-x. [DOI] [PubMed] [Google Scholar]
- CATTORI V., VAN MONTFOORT J.E., STIEGER B., LANDMANN L., MEIJER D.K., WINTERHALTER K.H., MEIER P.J., HAGENBUCH B. Localization of organic anion transporting polypeptide 4 (Oatp4) in rat liver and comparison of its substrate specificity with Oatp1, Oatp2 and Oatp3. Pflugers Arch. 2001;443:188–195. doi: 10.1007/s004240100697. [DOI] [PubMed] [Google Scholar]
- CROOP J.M., RAYMOND M., HABER D., DEVAULT A., ARCECI R.J., GROS P., HOUSMAN D.E. The three mouse multidrug resistance (mdr) genes are expressed in a tissue-specific manner in normal mouse tissues. Mol. Cell Biol. 1989;9:1346–1350. doi: 10.1128/mcb.9.3.1346. [DOI] [PMC free article] [PubMed] [Google Scholar]
- DE VRIES H.E., KUIPER J., DE BOER A.G., VAN BERKEL T.J., BREIMER D.D. The blood–brain barrier in neuroinflammatory diseases. Pharmacol. Rev. 1997;49:143–155. [PubMed] [Google Scholar]
- DRACH J., GSUR A., HAMILTON G., ZHAO S., ANGERLER J., FIEGL M., ZOJER N., RADERER M., HABERL I., ANDREEFF M., HUBER H. Involvement of P-glycoprotein in the transmembrane transport of interleukin-2 (IL-2), IL-4, and interferon-gamma in normal human T lymphocytes. Blood. 1996;88:1747–1754. [PubMed] [Google Scholar]
- FRANKLIN K.B.J., PAXINOS G. The Mouse Brain in Stereotaxic Coordinates. San Diego: Academic Press; 1997. [Google Scholar]
- GAO B., STIEGER B., NOE B., FRITSCHY J.M., MEIER P.J. Localization of the organic anion transporting polypeptide 2 (Oatp2) in capillary endothelium and choroid plexus epithelium of rat brain. J. Histochem. Cytochem. 1999;47:1255–1264. doi: 10.1177/002215549904701005. [DOI] [PubMed] [Google Scholar]
- GONZALEZ-SCARANO F., BALTUCH G. Microglia as mediators of inflammatory and degenerative diseases. Annu. Rev. Neurosci. 1999;22:219–240. doi: 10.1146/annurev.neuro.22.1.219. [DOI] [PubMed] [Google Scholar]
- GOTTESMAN M.M., PASTAN I. Biochemistry of multidrug resistance mediated by the multidrug transporter. Annu. Rev. Biochem. 1993;62:385–427. doi: 10.1146/annurev.bi.62.070193.002125. [DOI] [PubMed] [Google Scholar]
- HARRISON L.I., GIBALDI M. Pharmacokinetics of digoxin in the rat. Drug Metab. Dispos. 1976;4:88–93. [PubMed] [Google Scholar]
- HARTMANN G., KIM H., PIQUETTE-MILLER M. Regulation of the hepatic multidrug resistance gene expression by endotoxin and inflammatory cytokines in mice. Int. Immunopharmacol. 2001;1:189–199. doi: 10.1016/s0162-3109(00)00271-x. [DOI] [PubMed] [Google Scholar]
- JOHNSON D.R., FINCH R.A., LIN Z.P., ZEISS C.J., SARTORELLI A.C. The pharmacological phenotype of combined multidrug-resistance mdr1a/1b and mrp1-deficient mice. Cancer Res. 2001;61:1469–1476. [PubMed] [Google Scholar]
- JOHNSTONE R.W., RUEFLI A.A., SMYTH M.J. Multiple physiological functions for multidrug transporter P- glycoprotein. Trends Biochem. Sci. 2000;25:1–6. doi: 10.1016/s0968-0004(99)01493-0. [DOI] [PubMed] [Google Scholar]
- KAWAHARA M., SAKATA A., MIYASHITA T., TAMAI I., TSUJI A. Physiologically based pharmacokinetics of digoxin in mdr1a knockout mice. J. Pharm. Sci. 1999;88:1281–1287. doi: 10.1021/js9901763. [DOI] [PubMed] [Google Scholar]
- KODAWARA T., MASUDA S., WAKASUGI H., UWAI Y., FUTAMI T., SAITO H., ABE T., INU K. Organic anion transporter oatp2-mediated interaction between digoxin and amiodarone in the rat liver. Pharm. Res. 2002;19:738–743. doi: 10.1023/a:1016184211491. [DOI] [PubMed] [Google Scholar]
- MAYER U., WAGENAAR E., BEIJNEN J.H., SMIT J.W., MEIJER D.K., VAN ASPEREN J., BORST P., SCHINKEL A.H. Substantial excretion of digoxin via the intestinal mucosa and prevention of long-term digoxin accumulation in the brain by the mdr 1a P-glycoprotein. Br. J. Pharmacol. 1996;119:1038–1044. doi: 10.1111/j.1476-5381.1996.tb15775.x. [DOI] [PMC free article] [PubMed] [Google Scholar]
- MEIJER O.C., DE LANGE E.C., BREIMER D.D., DE BOER A.G., WORKEL J.O., DE KLOET E.R. Penetration of dexamethasone into brain glucocorticoid targets is enhanced in mdr1A P-glycoprotein knockout mice. Endocrinology. 1998;139:1789–1793. doi: 10.1210/endo.139.4.5917. [DOI] [PubMed] [Google Scholar]
- MILLER D.S., SUSSMAN C.R., RENFRO J.L. Protein kinase C regulation of p-glycoprotein-mediated xenobiotic secretion in renal proximal tubule. Am. J. Physiol. 1998;275:F785–F795. doi: 10.1152/ajprenal.1998.275.5.F785. [DOI] [PubMed] [Google Scholar]
- MORGAN E.T. Regulation of cytochrome p450 by inflammatory mediators: why and how. Drug Metab. Dispos. 2001;29:207–212. [PubMed] [Google Scholar]
- NADEAU S., RIVEST S. Endotoxemia prevents the cerebral inflammatory wave induced by intraparenchymal lipopolysaccharide injection: role of glucocorticoids and CD14. J. Immunol. 2002;169:3370–3381. doi: 10.4049/jimmunol.169.6.3370. [DOI] [PubMed] [Google Scholar]
- NICHOLSON T.E., RENTON K.W. Role of cytokines in the lipopolysaccharide-evoked depression of cytochrome P450 in the brain and liver. Biochem. Pharmacol. 2001;62:1709–1717. doi: 10.1016/s0006-2952(01)00859-0. [DOI] [PubMed] [Google Scholar]
- NOE B., HAGENBUCH B., STIEGER B., MEIER P.J. Isolation of a multispecific organic anion and cardiac glycoside transporter from rat brain. Proc. Natl. Acad. Sci. U.S.A. 1997;94:10346–10350. doi: 10.1073/pnas.94.19.10346. [DOI] [PMC free article] [PubMed] [Google Scholar]
- PANWALA C.M., JONES J.C., VINEY J.L. A novel model of inflammatory bowel disease: mice deficient for the multiple drug resistance gene, mdr1a, spontaneously develop colitis. J. Immunol. 1998;161:5733–5744. [PubMed] [Google Scholar]
- PAXINOS G., WATSON C. The Rat Brain in Stereotaxic Coordinates. Sydney: Academic Press; 1986. [Google Scholar]
- PERRY V.H., ANDERSSON P.B., GORDON S. Macrophages and inflammation in the central nervous system. Trends Neurosci. 1993;16:268–273. doi: 10.1016/0166-2236(93)90180-t. [DOI] [PubMed] [Google Scholar]
- PIQUETTE-MILLER M., PAK A., KIM H., ANARI R., SHAHZAMANI A. Decreased expression and activity of P-glycoprotein in rat liver during acute inflammation. Pharm Res. 1998;15:706–711. doi: 10.1023/a:1011962818051. [DOI] [PubMed] [Google Scholar]
- RAO V.V., DAHLHEIMER J.L., BARDGETT M.E., SNYDER A.Z., FINCH R.A., SARTORELLI A.C., PIWNICA-WORMS D. Choroid plexus epithelial expression of MDR1 P glycoprotein and multidrug resistance-associated protein contribute to the blood – cerebrospinal-fluid drug-permeability barrier. Proc. Natl. Acad. Sci. U.S.A. 1999;96:3900–3905. doi: 10.1073/pnas.96.7.3900. [DOI] [PMC free article] [PubMed] [Google Scholar]
- REICHEL C., GAO B., VAN MONTFOORT J., CATTORI V., RAHNER C., HAGENBUCH B., STIEGER B., KAMISAKO T., MEIER P.J. Localization and function of the organic anion-transporting polypeptide Oatp2 in rat liver. Gastroenterology. 1999;117:688–695. doi: 10.1016/s0016-5085(99)70463-4. [DOI] [PubMed] [Google Scholar]
- RENTON K.W. Hepatic drug metabolism and immunostimulation. Toxicology. 2000;142:173–178. doi: 10.1016/s0300-483x(99)00142-0. [DOI] [PubMed] [Google Scholar]
- RENTON K.W., NICHOLSON T.E. Hepatic and central nervous system cytochrome P450 are down-regulated during lipopolysaccharide-evoked localized inflammation in brain. J. Pharmacol. Exp. Ther. 2000;294:524–530. [PubMed] [Google Scholar]
- SALPHATI L., BENET L.Z. Metabolism of digoxin and digoxigenin digitoxosides in rat liver microsomes: involvement of cytochrome P4503A. Xenobiotica. 1999;29:171–185. doi: 10.1080/004982599238722. [DOI] [PubMed] [Google Scholar]
- SCHELD W.M., KOEDEL U., NATHAN B., PFISTER H.W. Pathophysiology of bacterial meningitis: mechanism(s) of neuronal injury. J. Infect. Dis. 2002;186 Suppl. 2:S225–S233. doi: 10.1086/344939. [DOI] [PubMed] [Google Scholar]
- SCHINKEL A.H., MAYER U., WAGENAAR E., MOL C.A., VAN DEEMTER L., SMIT J.J., VAN DER VALK M.A., VOORDOUW A.C., SPITS H., VAN TELLINGEN O., ZIJLMANS J.M., FIBBE W.E., BORST P. Normal viability and altered pharmacokinetics in mice lacking mdr1-type (drug-transporting) P-glycoproteins. Proc. Natl. Acad. Sci. U.S.A. 1997;94:4028–4033. doi: 10.1073/pnas.94.8.4028. [DOI] [PMC free article] [PubMed] [Google Scholar]
- SCHINKEL A.H., SMIT J.J., VAN TELLINGEN O., BEIJNEN J.H., WAGENAAR E., VAN DEEMTER L., MOL C.A., VAN DER VALK M.A., ROBANUS-MAANDAG E.C., TE RIELE H.P. Disruption of the mouse mdr1a P-glycoprotein gene leads to a deficiency in the blood–brain barrier and to increased sensitivity to drugs. Cell. 1994;77:491–502. doi: 10.1016/0092-8674(94)90212-7. [DOI] [PubMed] [Google Scholar]
- SCHINKEL A.H., WAGENAAR E., VAN DEEMTER L., MOL C.A., BORST P. Absence of the mdr1a P-glycoprotein in mice affects tissue distribution and pharmacokinetics of dexamethasone, digoxin, and cyclosporin A. J. Clin. Invest. 1995;96:1698–1705. doi: 10.1172/JCI118214. [DOI] [PMC free article] [PubMed] [Google Scholar]
- SUKHAI M., YONG A., PAK A., PIQUETTE-MILLER M. Decreased expression of P-glycoprotein in interleukin-1beta and interleukin-6 treated rat hepatocytes. Inflamm Res. 2001;50:362–370. doi: 10.1007/PL00000257. [DOI] [PubMed] [Google Scholar]
- TEPPERMAN B.L., CHANG Q., SOPER B.D. Protein kinase C mediates lipopolysaccharide- and phorbol-induced nitric-oxide synthase activity and cellular injury in the rat colon. J. Pharmacol. Exp. Ther. 2000;295:1249–1257. [PubMed] [Google Scholar]
- TSURUOKA S., SUGIMOTO K.I., FUJIMURA A., IMAI M., ASANO Y., MUTO S. P-glycoprotein-mediated drug secretion in mouse proximal tubule perfused in vitro. J. Am. Soc. Nephrol. 2001;12:177–181. doi: 10.1681/ASN.V121177. [DOI] [PubMed] [Google Scholar]
- VAN ASPEREN J., VAN TELLINGEN O., BEIJNEN J.H. The role of mdr1a P-glycoprotein in the biliary and intestinal secretion of doxorubicin and vinblastine in mice. Drug Metab. Dispos. 2000;28:264–267. [PubMed] [Google Scholar]
- VOS T.A., HOOIVELD G.J., KONING H., CHILDS S., MEIJER D.K., MOSHAGE H., JANSEN P.L., MULLER M. Up-regulation of the multidrug resistance genes, Mrp1 and Mdr1b, and down-regulation of the organic anion transporter, Mrp2, and the bile salt transporter, Spgp, in endotoxemic rat liver. Hepatology. 1998;28:1637–1644. doi: 10.1002/hep.510280625. [DOI] [PubMed] [Google Scholar]
- WOLF D.C., HORWITZ S.B. P-glycoprotein transports corticosterone and is photoaffinity-labeled by the steroid. Int. J. Cancer. 1992;52:141–146. doi: 10.1002/ijc.2910520125. [DOI] [PubMed] [Google Scholar]
- ZHANG W., LING V. Cell-cycle-dependent turnover of P-glycoprotein in multidrug-resistant cells. J. Cell Physiol. 2000;184:17–26. doi: 10.1002/(SICI)1097-4652(200007)184:1<17::AID-JCP2>3.0.CO;2-U. [DOI] [PubMed] [Google Scholar]
- ZHAO Y.L., DU J., KANAZAWA H., SUGAWARA A., TAKAGI K., KITAICHI K., TATSUMI Y., HASEGAWA T. Effect of endotoxin on doxorubicin transport across blood–brain barrier and P-glycoprotein function in mice. Eur. J. Pharmacol. 2002;445:115–123. doi: 10.1016/s0014-2999(02)01661-8. [DOI] [PubMed] [Google Scholar]


