Abstract
Physiologically, perisinusoidal hepatic stellate cells (HSC) are quiescent and store retinoids. During liver injury and in cell culture, HSC transform into proliferating myofibroblast-like cells that express α-smooth muscle actin (α-sma) and produce excessive amounts of extracellular matrix. During transformation (also known as activation), HSC are depleted of the retinoid stores, and their expression of the endothelin-1 (ET-1) system is increased. ET-1 causes contraction of transformed HSC and is implicated in their proliferation and fibrogenic activity. In order to understand the association between retinoids, ET-1 and the activation of HSC, we investigated the effect of 13-cis-retinoic acid on the transformation of cultured HSC and the expression of ET-1 system.
HSC derived from normal rat liver were maintained for 10–12 days in a medium supplemented with 5% serum and containing 2.5 μM retinoic acid without or with 50 nM ET-1 (ETA+ETB agonist) or sarafotoxin S6c (ETB agonist). In another set of experiments, cells treated for 10–12 days with vehicle (ethanol) or retinoic acid were challenged with ET-1 or sarafotoxin S6c, and various determinations were made at 24 h.
Retinoic acid inhibited transformation and proliferation of HSC as assessed by morphological characteristics, expression of α-sma, bromodeoxyuridine incorporation and cell count. Retinoic acid also prevented upregulation of ETB receptors without affecting ET-1 or ETA expression. Total protein synthesis ([3H]leucine incorporation), collagen α types I mRNA expression and collagen synthesis ([3H]proline incorporation) were lower in retinoic acid-treated cells. Although ET-1-treated cells were morphologically similar to the control cells, their expression of α-smooth muscle actin was significantly inhibited. The presence of retinoic acid in the medium during treatment with ET-1 caused further reduction in the expression of α-smooth muscle actin. ET-1 and sarafotoxin S6c stimulated total protein synthesis in vehicle- and retinoic acid-treated cells, but collagen synthesis only in the latter.
These results showing prevention of HSC activation and negative regulation of ETB receptor expression in them by retinoic acid may have important pathophysiologic implications.
Keywords: Collagen, endothelin, fibrosis, liver, retinoids, stellate cells
Introduction
Physiologically, perisinusoidal hepatic stellate cells (HSC) maintain liver architecture by synthesizing the components of extracellular matrix (ECM) and regulate microvascular tone by contractile activity. HSC are a major storage site of retinoids, which are known to have anti-inflammatory and immunomodulatory properties (Brinckerhoff et al., 1983; Orfanos & Bauer, 1983; Fumarulo et al., 1991). During chronic liver injury and in culture, HSC are depleted of retinoids; this process is associated with their transformation (also known as activation) into highly contractile myofibroblast-like cells that express α-smooth muscle actin (α-sma). Activated HSC play a major role in the pathogenesis and complications of chronic liver disease by depositing excessive amounts of ECM, composition of which is different from that synthesized by the normal HSC (reviewed in Geerts et al., 1994; Friedman, 2000). Exposure of activated HSC to retinol (Davis & Vucic, 1988; Geerts et al., 1989a, 1989b), retinyl palmitate (Pinzani et al., 1992a; Takase et al., 1992), and retinoic acid (Davis et al., 1990; 1991; Pinzani et al., 1992a) inhibits their proliferation, as well as the synthesis of collagen and transforming growth factor-β (TGF-β). Moreover, pretreatment of rats with retinyl palmitate prior to isolation of HSC causes significant decrease in their proliferative capacity and protein synthesis (Shiratori et al., 1986; 1987).
Compelling evidence has accumulated indicating that endothelin-1 (ET-1), a potent constrictor of the liver vasculature (Gandhi et al., 1990) and HSC (Pinzani et al., 1992b; Housset et al., 1993; Kawada et al., 1993; Zhang et al., 1995), plays an important role in the pathophysiology of chronic liver disease and portal hypertension. Gene and protein expression of ET-1 and its receptors increase upon activation of HSC (Gandhi et al., 2000), and ET-1 has been implicated in their transformation and proliferation (Rockey & Chung, 1996). It has been shown that the ET-1 gene is regulated by retinoic acid in other cell types (Hsu & Pfahl, 1998). However, little is known about the reactivity of quiescent HSC to retinoids, and the role of retinoids in the regulation of ET-1 and its receptors in them. The aim of this investigation was to determine whether the presence of retinoic acid in the medium affects activation of HSC induced by culture and the attendant processes, including upregulation of the ET-1 system.
Methods
The following chemicals and reagents were purchased from the indicated sources: Protease type XIV, 5-[N-2,3-dihydroxypropylacetamido-2,4,6-triiodo-N,N′-bis(2,3-dihydroxypropyl)isophthalamide] (Nycodenz), BQ-788 (N-cis-2,6-dimethylpiperidinecarbonyl-L-γMeLeu-D-Trp(COOMe)-D-Nle-ONa) and 13-cis-retinoic acid (Sigma Chemical Co., St Louis, MO, U.S.A.); collagenase type IV (Worthington Biochemical Corporation, Freehold, NJ, U.S.A.); cell culture media and sera (GIBCO-BRL, Grand Island, NY, U.S.A.); ET-1, sarafotoxin S6c and BQ-123 (cyclo(-D-Trp-D-Asp-Pro-D-Val-Leu-)) (American Peptide, Sunnyvale, CA, U.S.A.); [125I]TYR13-endothelin-1 (2200 Ci mmol−1) (Perkin-Elmer-New England Nuclear, Boston, MA, U.S.A.); [Methyl-3H]thymidine (88.7 Ci mmol−1) (Perkin-Elmer Life Sci., Boston, MA, U.S.A.); and L-[2,3,4,5-3H]proline (100 Ci mmol−1) (Amersham-Pharmacia, Piscataway, NJ, U.S.A.). Retinoic acid was dissolved in ethanol at 5 mM concentration and stored protected from light in aliquots under nitrogen. Fresh solution was made every week, and the cell culture work was performed protected from the direct light. The solution of retinoic acid or ethanol was added at 1 μl ml−1 to the cultured cells. When ET-1, sarafotoxin S6c, or the ET receptor antagonists were added to the incubations, equivalent volume of the solvent (phosphate-buffered saline (PBS)) was added to the control cells.
Preparation of stellate cells
The experimental protocols were approved by the University of Pittsburgh IACUC in accordance with the guidelines of the National Institutes of Health. HSC were prepared essentially as described previously (Uemura & Gandhi, 2001). Briefly, the livers of male Sprague–Dawley rats (450–500 g) were digested with protease and collagenase. Hepatocytes and cell debris were removed by low-speed centrifugation (50 × g for 1 min; 2 ×), and the supernatant was centrifuged at 1400 × g for 7 min. The pellet (nonparenchymal cells) of this centrifugation was suspended in Hank's balanced salt solution (HBSS) and subjected to the above steps to remove residual hepatocytes and cell debris. HSC were purified from the other nonparenchymal cells by centrifugation (1400 × g for 20 min) on a 13.14% (w/v) Nycodenz gradient. The cells were suspended in DMEM containing 10% fetal bovine serum (FBS)/10% horse serum and antibiotics, and plated in 24-well or six-well culture plates (0.1 × 10⁶ cells/cm2). The viability of the cells as determined by trypan blue exclusion was greater than 97%. After overnight incubation, the cells were washed and placed in DMEM containing 2.5% FBS/2.5% horse serum with or without 2.5 μM 13-cis-retinoic acid. The medium was renewed every day and experiments were performed between days 10 and 12. The purity of the cells, as determined by vitamin A autofluorescence and immunohistochemical analysis for desmin (Gandhi et al., 2000; Uemura & Gandhi, 2001), was greater than 95%.
Determination of ET-1
ET-1 was extracted from the culture medium, and its concentration determined by ELISA using a commercial kit (Peninsula Laboratories, Belmont, CA, U.S.A.) (Gabriel et al., 1999).
[125I]ET-1 binding assay
Cells were washed with HBSS containing 10 mM HEPES, pH 7.4, and 0.1% bovine serum albumin (HBSS/BSA), and placed in this medium containing 6.25–800 pM [125I]ET-1 in the absence or presence of 1 μM unlabeled ET-1 (saturation binding). In the competition binding assay, cells were incubated with 20 pM [125I]ET-1 in the absence or presence of 1 μM unlabeled ET-1, 10 pM–10 μM ETA antagonist BQ-123 or 10 pM–10 μM ETB agonist sarafotoxin S6c. After incubation at 22°C for 2 h, the cells were washed with HBSS/BSA and digested with 0.75 N NaOH for determination of radioactivity. Specific binding of [I25I]ET-1 was calculated as the difference between cell-associated radioactivity in the presence and absence of 1 μM unlabeled ET-1.
Determination of mRNA expression
Semiquantitative reverse transcriptase–polymerase chain reaction (RT–PCR) was performed to assess the relative mRNA expressions of preproET-1, ET-1 receptors, collagen α type-I, collagen α type-III and TGF-β1 as described previously (Gabriel et al., 1999; Gandhi et al., 2000). The PCR primers specific for preproET-1 cDNA: 5′CCAACTCTGGGCTCTCCATGCT-GG3′ (F) and 5′GAATGGCACTGTGTCTCTG-CTCTC3′ (R) [241 bp]; ETA cDNA: 5′CCCTTCGAATACAAGGGCGA3′ (F) and 5′GAAGAGGGAACCAGCAC3′ (R) [291 bp]; ETB cDNA: 5′GGCTGTTCAGTTTCTAC-TTCTGC3′ (F) and 5′AGAA-TCCTGCTGAGGTGAAGG3′ (R) [210 bp]; TGF-β1 cDNA: 5′AGCTCAGACATTCGGGA-AGCAGTG3′ (F) and 5′GC-AAGGACCTTGCTGTACTG-TGTG3′ (R) [615 bp]; collagen α type-I cDNA: 5′GGTTCTCGGACTATTGAAGGAGC3′ (F) and 5′AGACAA-GAACGAGGTAGTCTTTC3′ (R) [245 bp]; collagen α type-III cDNA: 5′CGAGGTAACAGAGGTGAA-AGA3′ (F) and 5′AACCCAGTATTCTCCGCTCTT3′ (R) [349 bp]; and β-actin cDNA: 5TTCTACAATGAGCTGC-GTGTG3′ (F) and 5′TTCATGGATGCCACAGGATTC3′ (R) [561 bp] were used. The PCR products were resolved in a 1.2% agarose gel (β-actin and TGF-β1) or 1.7% agarose gel (ET-1, ETA, ETB, collagen I and collagen III), and stained with SYBR Green I (FMC Biproduct, Rockland, ME, U.S.A.). The gels were scanned under blue fluorescence light using a phosphorimager and the band intensity was quantified using ImageQuaNT software (Molecular Dynamics, Sunnyvale, CA, U.S.A.). The expression of various mRNAs was normalized with respect to that of β-actin mRNA by calculating the ratio of band intensities.
Morphological analysis
The morphology of the cells was determined by phase-contrast microscopy with an Olympus CK2 microscope. For detailed analysis, single confocal slices were taken with an Olympus Fluoview Confocal microscope (Melview, NY, U.S.A.), and differential interference contrast images were overlayed with the images of the same cells stained with nuclear sytox green (Molecular Probes, Eugene, OR, U.S.A.). For determination of cell size, all measurements of maximum fiberlength were done manually using Metamorph version 6.03 program (Universal Imaging Corp., Downington, PA, U.S.A.). The Metamorph region tools were used to show maximum dimensional length of the cells. This length was then logged and all dimensions were calibrated on the microscope using a linear standard line. This calibration was applied to each image to ensure reproducibility between experiments. Images of 20–30 randomly chosen cells from replicate wells (three experiments for each condition with different batches of cells) were analyzed. The maximum length of individual cell was considered for final determination of average cell length.
Cell counting
Cells were counted in at least eight random fields per well (at least two wells in three separate experiments) in an Olympus CK2 phase contrast microscope aided by an eyepiece equipped with a marked 49 mm2 area.
Bromodeoxyuridine incorporation
The assay was performed to analyze the bromodeoxyuridine (BrDU) incorporation as an index of DNA synthesis using cells plated on glass coverslips. The BrDU incorporation was determined using a 5-bromo-2′-deoxyuridine labeling and detection kit as per the instructions of the manufacture (Roche Diagnostic Corporation, Indianapolis, IN, U.S.A.).
Western blot analysis for α-sma
Cells in six-well plates were washed, placed in 50 μl lysis buffer (0.1 M.NaCl, 10 mM Tris-HCl, 1 mM EDTA) containing 0.5 mM PMSF and 25 μl ml−1 protease inhibitor cocktail (P-8340; Sigma Chemical Co.) for 10 min on ice, and scraped. The lysate was stored in aliquots at –80°C until use. Proteins (15 μg) from HSC lysates were mixed with 2 × loading buffer (5% SDS, 0.125 M Tris-HCl, pH 7.4, 0.03 M EDTA, 20% glycerol, 3% DL-dithiothreitol and 0.01% bromophenol blue) and heated at 100°C for 3 min, then cooled on ice. Proteins were separated by electrophoresis on an 8% SDS–PAGE minigel and transferred onto an Immobilon-P membrane (Millipore Corp., Bedford, MA, U.S.A.) in a Mini-Trans Blot transfer system (Bio-Rad Laboratories). The membrane was rinsed briefly in PBS, and equal loading was confirmed by staining with Ponceau S. The stain was removed from the membrane by a brief wash with water, after which the nonspecific binding was blocked by incubation in 5% nonfat milk in PBS for 2 h. The membrane was then washed in PBS for 15 min (4 ×), incubated overnight at 4°C with a monoclonal anti-α-SMA antibody (Sigma Chemical Co., 1 : 1000 dilution) in 0.1% nonfat milk/PBS, washed with PBS for 15 min (2 ×) and for 5 min (2 ×), incubated for 2 h with rabbit anti-mouse IgG (peroxidase conjugate, Sigma Chemical Co.) (1 : 4000 in 0.1% nonfat milk/PBS). After washing the membrane with PBS for 15 min (4 ×), detection was achieved using an ECL chemiluminescence kit (Amersham-Pharmacia). The intensity of the bands was determined by densitometry using ImageQuaNT software (Molecular Dynamics). To normalize the data, the same amount of protein was separated on another gel and the level of expression of a nonvariant protein Erk 2 was determined using a polyclonal antibody (clone C-14) from Santa Cruz Biotechnology, Inc. (Santa Cruz, CA, U.S.A.).
Protein synthesis
The cells were washed and placed in leucine-free MEM containing 1 μCi ml−1 [3H]leucine. After 4 h, the medium was aspirated and cells washed twice with HBSS. Cells were then treated with 10% trichloroacetic acid (TCA) on ice for 10 min, and washed with TCA followed by 90% ethanol. Cell-associated radioactivity was determined following digestion in 5% SDS. Total DNA was determined in additional wells using Hoechst reagent (Rago et al., 1990).
Analysis of TGF-β1
The concentration of TGF-β1 in the culture medium was determined by ELISA as per the instructions of the manufacturer (Promega Corp., Madison, WI, U.S.A.).
Collagen synthesis
The synthesis of collagen was determined by the procedure described previously (Shina et al., 1989; Gandhi et al., 2000). Cells were washed and placed in DMEM/0.1% BSA containing 5 μCi ml−1 [3H]proline and various agents at concentrations indicated in the figure legends. After incubation for 24 h at 37°C, the medium was aspirated, mixed with chick embryo extract (GibcoBRL) (50 μl ml−1) and proteins were precipitated with 10% TCA. After centrifugation, the pellet was washed twice with 10% TCA and dissolved in 0.6 ml 0.2 N NaOH. An aliquot (0.2 ml) of this solution was neutralized with HCl, mixed with 0.1 ml 50 mM Tris-Cl, pH 7.4, containing 5 mM CaCl2 and 10 mM N-ethylmaleimide, and the reaction was stimulated with 20 U ml−1 collagenase (type VII from Clostridium histolyticum, Sigma Chemical Co.). The total volume of the reaction mixture was 0.5 ml. After incubation for 3 h at 37°C, 50 μl of 10 mg ml−1 BSA and 50 μl of 100% TCA were added to each tube. After centrifugation, an aliquot of the supernatant was aspirated for determination of radioactivity. Negative controls (i.e. without enzyme) were used in each assay for determination of nonspecific release of [3H]proline.
Statistical analysis
The results are expressed as averages of at least three determinations±s.e.m. Each experiment was repeated at least three times. Student's t-test was performed for determination of statistical significance between the groups. A P-value of <0.05 was considered statistically significant.
Results
We used 13-cis-retinoic acid because it is an active in vivo metabolite of all-trans retinoic acid (Tang & Russell, 1990) and is a potent inhibitor of the proliferation of activated HSC and their expression of collagen (Davis et al., 1990; Takase et al., 1992). Initial experiments were performed to determine optimum serum and retinoic acid concentrations required for maintenance of HSC in culture. Serum deprivation during the early culture period caused substantial loss of cells, which was even more pronounced in the presence of retinoic acid. The cells were maintained best in a medium supplemented with 5% serum (2.5% FBS and 2.5% horse serum) and 2.5 μM retinoic acid. This condition was, therefore, employed in all of the experiments. This assay system also reflects the in vivo situation, including the presence of unknown factors more than a system without serum. We also note that in these experiments 50 nM ET-1 was used. Although HSC synthesize and release ET-1, its concentration in the culture medium over a 24 h period is in low pM range and therefore much lower to elicit biological responses (Gabriel et al., 1999). The local concentration of ET-1 in vivo, particularly under pathological conditions, are likely to rise to nano molar range because of its increased production by HSC, endothelial cells as well as hepatocytes (Kuddus et al., 2000).
Effect of retinoic acid on ET-1 and its receptors
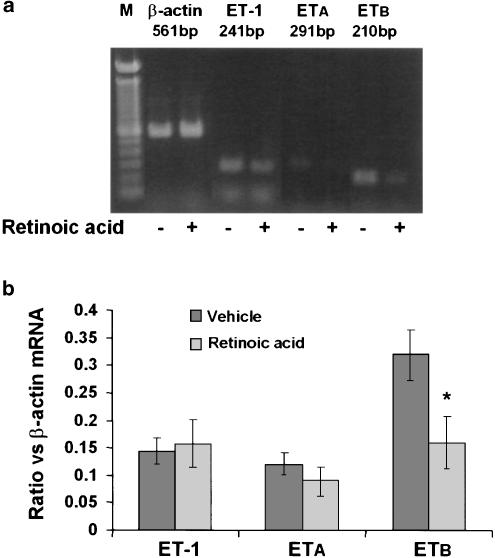
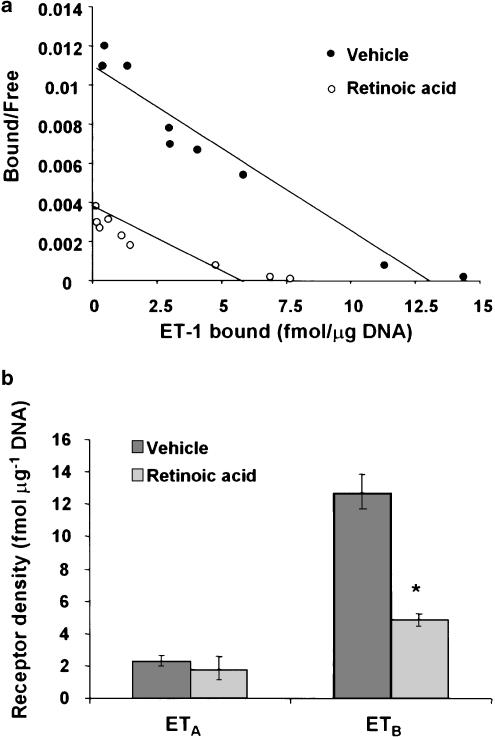
RT–PCR analysis was performed to determine the relative mRNA expression of ET-1, ET-1 receptors, TGF-β1 and collagen I and III. Although this assay is not quantitative, expression of β-actin (a nonvariant mRNA) was determined in an identical manner for normalization. Retinoic acid treatment did not affect the mRNA expression in (Figure 1) or the secretion of ET-1 (155±20 pg μg−1 DNA, control and 145±15 pg μg−1 DNA, retinoic acid-treated) by HSC. ET-1 receptor density was significantly lower in retinoic acid-treated than in vehicle-treated HSC (Bmax 13.8±1.7 vs 6.9±1.3 fmol μg−1 DNA; P<0.05) (Figure 2a). This effect of retinoic acid was observed primarily in the ETB subtype (both mRNA expression (Figure 1) and the density (Figure 2b), which constitutes the major fraction of ET-1 receptors in rat HSC (Gabriel et al., 1999). No significant difference in the mRNA expression (Figure 1) or the density of ETA receptor (Figure 2b) was observed between vehicle and retinoic acid-treated cells.
Figure 1.
Effect of retinoic acid on the mRNA expression of ET-1 and its receptors in HSC. Cells were incubated with retinoic acid (2.5 μM) or the vehicle (ethanol, 1 μl ml−1) for 10–12 days, after which RNA was extracted and the mRNA expression of preproET-1, ETA and ETB was determined by RT–PCR. (a) mRNA expression of various transcripts from a representative experiment. (b) mRNA expression of the respective transcripts normalized with respect to the expression of β-actin mRNA. Values are means of six separate determinations±s.e.m. *P<0.05 vs vehicle.
Figure 2.
Effect of retinoic acid on ET-1 receptors. After 10–12 days of incubation with 2.5 μM retinoic acid or the vehicle (ethanol, 1 μl ml−1), ET-1 binding assay was performed as described in the Methods section. (a) Scatchard plot of the saturation binding data. (b) Results of the competition binding analysis. *P<0.01 vs vehicle.
Effect of retinoic acid and ET-1 on transformation and proliferation of stellate cells
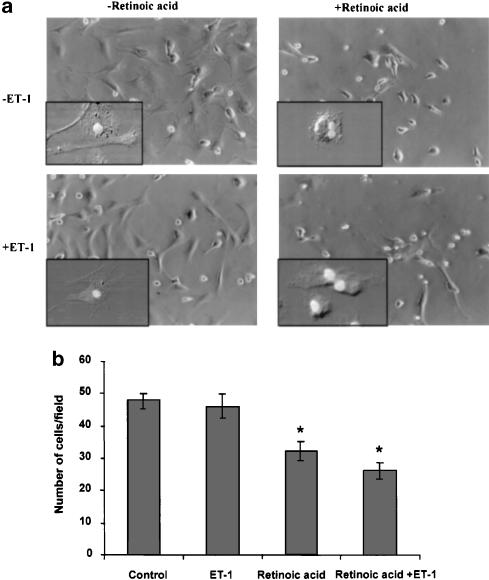
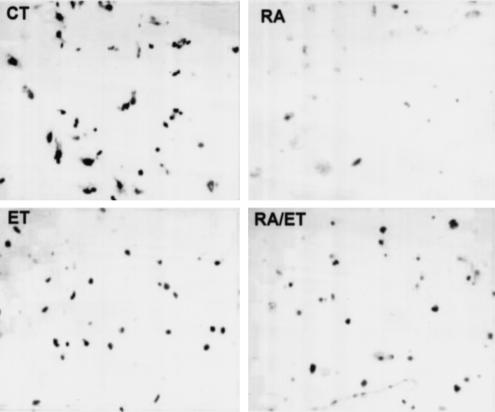
Morphological analysis showed myofibroblast-like phenotype of cells treated with the vehicle (ethanol) (Figure 3a; see inset). Upon retinoic acid treatment, very few cells exhibited such transformation. In fact, most of them exhibited the phenotype of early culture (i.e., round shape with fat deposits; see inset of Figure 3a) and their number was also lower than in control wells (48±2 vs 32±4 cells per field P<0.01). ET-1-treated cells were not much different from the control cells morphologically (Figure 3a; also see inset) or by density (46±3 cells per field). Most of the cells incubated in the presence of retinoic acid and ET-1 were morphologically similar to those incubated with retinoic acid alone, but a significant number exhibited an intermediate phenotype (Figure 3a; also see inset); they were fewer in number than in control wells (26±3 cells per field; P<0.01 vs control). BrDU incorporation assay was performed to confirm the effect of various conditions on the DNA synthesis. As shown in Figure 4, very few retinoic acid-treated cells were labeled with BrDU as compared to the control cells. The total number of BrDU positive cells under various conditions were: 78±7% (control); 25±5% (retinoic acid-treated); 57±5% (ET-1-treated); and 40±3% (retinoic acid and ET-1-treated). The average length of the cells was 46±6 μm (control), 17±2 μm (retinoic acid-treated), 41±3 μm (ET-1-treated), and 30±3.4 μm (retinoic acid and ET-1-treated).
Figure 3.
Effect of retinoic acid and ET-1 on the morphology and cell count of HSC. HSC were treated with retinoic acid (2.5 μM) or the vehicle (ethanol, 1 μl ml−1) without or with 50 nM ET-1 for 10–12 days. (a) Photomicrographs were taken using a phase-contrast microscope. Insets show images of individual representative cells developed using confocal microscopy. (b) The cell number was determined using an eyepiece equipped with 49 mm2 area at × 20 magnification. At lease eight random areas per well were counted in at least two wells from three separate experiments. *P<0.01 vs vehicle.
Figure 4.
BrDu incorporation in retinoic acid-treated cells. HSC were plated on glass coverslips and treated with retinoic acid (2.5 μM) or the vehicle (ethanol, 1 μl ml−1) in the absence or presence of ET-1 (50 nM) for 10–12 days, and BrDU labeling assay was then performed as described in the Methods section. The number of BrDU-positive cells was counted in a total of 100 cells in at least four views per coverslip in at least three experiments each performed in triplicate. The values are stated in the text.
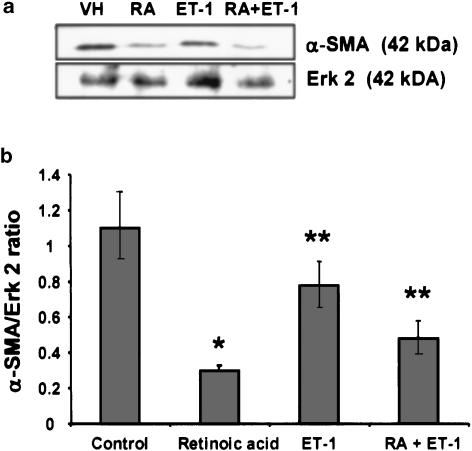
As determined by Western blot analyses (Figure 5), the expression of α-SMA was much lower in retinoic acid-treated cells relative to the control cells. Cell incubated with ET-1 also had significantly reduced expression of α-SMA than the control cells. The presence of retinoic acid in the medium during treatment of cells with ET-1 caused further inhibition of the expression of α-SMA (Figure 5).
Figure 5.
Western analysis of α-SMA. After treatment with retinoic acid (2.5 μM) or the vehicle (ethanol, 1 μl ml−1) without or with 50 nM ET-1 for 10–12 days, cells were lysed and Western blotting analysis for α-SMA was performed. (a) A representative blot showing the effect of various conditions on α-SMA expression. As a nonvariant protein the expression of Erk 2 was determined in equal amount of total protein. (b) Densitometric analysis of the intensity of the α-SMA bands is presented as a ratio against the intensity of Erk 2 bands. Averages of three determinations±s.e.m. *P<0.001 and **P<0.01 vs vehicle. RA, retinoic acid.
Effect of retinoic acid and ET-1 on protein synthesis
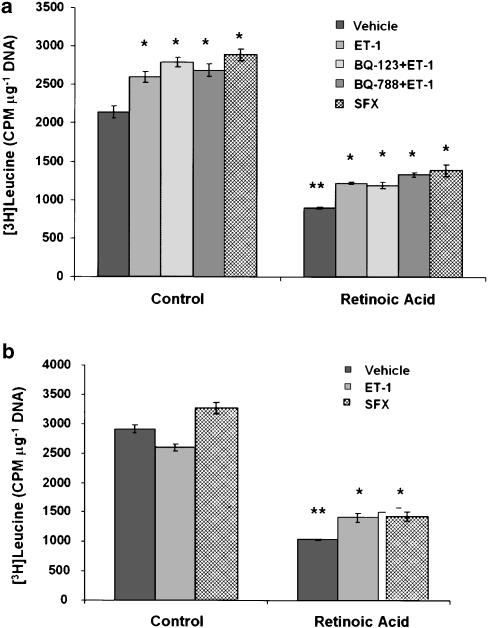
In order to test whether retinoic acid influences the overall protein synthesis in the absence or presence of ET-1, incorporation of [3H]leucine in cells maintained in the presence of retinoic acid with or without ET-1 or sarafotoxin S6c was determined. The protein synthesis was much lower in retinoic acid-treated cells than in vehicle-treated cells (Figure 6). The presence of ET-1 or sarafotoxin S6c during the entire time period of culture caused a modest increase in protein synthesis in both vehicle- and retinoic acid-treated cells (Figure 6a). Interestingly, the effect of ET-1 was not affected by BQ-123 or BQ-788. When challenged with ET-1 or sarafotoxin S6c after 10–12 days of treatment with vehicle (ethanol) or retinoic acid, there was a modest increase in the overall protein synthesis only in the latter (Figure 6b).
Figure 6.
Effect of retinoic acid and ET-1 or sarafotoxin S6c on protein synthesis. (a) HSC were incubated with 2.5 μM retinoic acid or the vehicle (ethanol, 1 μl ml−1) in the absence or presence of ET-1 (50 nM) or sarafotoxin S6c (SFX) (50 nM) for 10–12 days. In additional wells, cell were incubated with ET-1 and 10 μM BQ-123 or BQ-788. [3H]leucine incorporation and DNA measurements were made as described in the Methods section. *P<0.01 vs vehicle; **P<0.001 vs control. (b) HSC were incubated with retinoic acid or vehicle alone for 10–12 days. ET-1 or sarafotoxin S6c were then added and 24 h later DNA synthesis ([3H]leucine incorporation) and DNA concentration (Hoechst's reaction) were measured. *P<0.01 vs vehicle; **P<0.001 vs control. SFX, sarafotoxin S6c.
Effect of retinoic acid and ET-1 on TGF-β and collagen synthesis
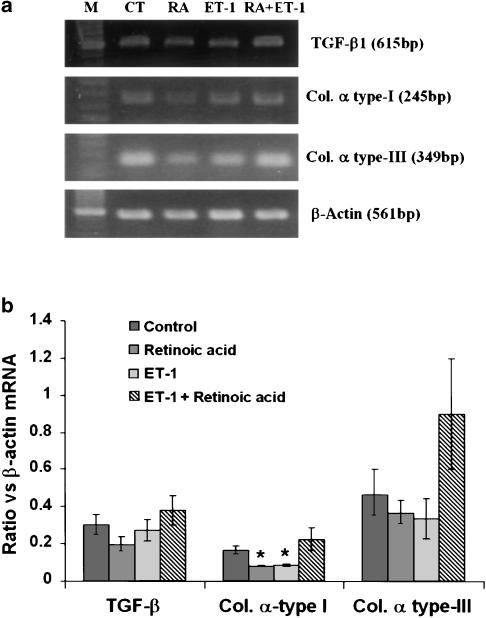
Although the mRNA expression of the fibrogenic agent TGF-β1 was lower in retinoic acid-treated cells, the difference was not statistically significant (Figure 7). No difference between ET-1- or retinoic acid and ET-1-treated and vehicle-treated cells was observed with respect to TGF-β1 mRNA expression. The mRNA expression of collagen α type-I was significantly lower in retinoic acid- and in ET-1-treated cells than in vehicle-treated cells (Figure 7). Paradoxically, however, the mRNA expression of collagen α type-I was not different in retinoic acid and ET-1-treated cells from the vehicle-treated cells. Although a similar trend was also shown by collagen α type-III mRNA upon various treatments, the extent of expression was not significantly different from that in vehicle-treated cells (Figure 7).
Figure 7.
Effect of retinoic acid and ET-1 on the mRNA expression of TGF-β1, collagen I and collagen III. HSC were incubated with 2.5 μM retinoic acid or the vehicle (ethanol, 1 μl ml−1) without or with ET-1 (50 nM) for 10–12 days. RNA was then extracted and RT–PCR was performed as described in the Methods section. For normalization, β-actin mRNA expression was determined. (a) Representative expression of various mRNA transcripts from five to seven separate experiments. (b) Ratio of the expression of different mRNA transcripts against that of β-actin. *P<0.05 vs control. CT, control; RA, retinoic acid.
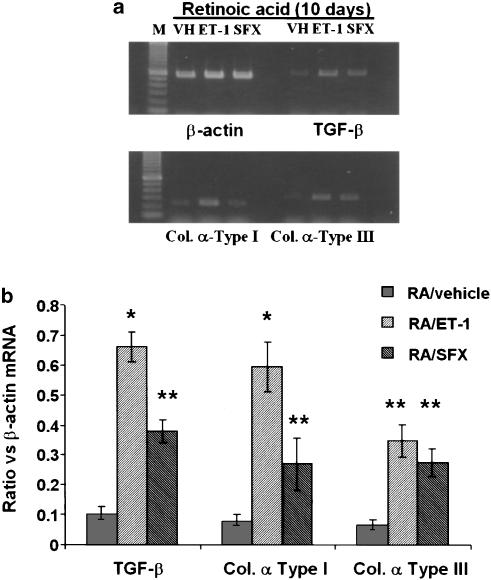
Previously we have shown that ET-1 stimulates the synthesis of TGF-β1 and collagen in quiescent but not in activated HSC (Gandhi et al., 2000). The effect of ET-1 on the synthesis of TGF-β1 and collagen is mediated by ETA and ETB receptors, respectively (Gandhi et al., 2000). Since cells treated with retinoic acid appear to retain quiescent phenotype, we examined the effect of ET-1 and sarafotoxin S6c on TGF-β1 and collagen synthesis in HSC treated for 10–12 days with or without retinoic acid. Incubation of these cells with ET-1 or sarafotoxin S6c for 24 h demonstrated that ET-1, and to a smaller extent sarafotoxin S6c, stimulated mRNA expression of TGF-β1 and collagen α type-I in retinoic acid-treated cells (Figure 8). However, both agonists stimulated the expression of collagen α type III to the same extent.
Figure 8.
Effect of ET-1 and sarafotoxin S6c on mRNA expression of TGF-β1, collagen I and collagen III in retinoic acid-treated cells. HSC were incubated with 2.5 μM retinoic acid for 10–12 days. ET-1 (50 nM) or sarafotoxin S6c (SFX) (50 nM) were then added and 24 h later mRNA expressions of TGF-β1, collagen I and collagen III were determined by RT–PCR. For normalization, β-actin mRNA expression was determined. (a) Various mRNA transcripts from a representative of three experiments. (b) Ratio of the expression of different mRNA transcripts against that of β-actin. *P<0.01 and **P<0.05 vs vehicle. VH, vehicle (PBS); RA, retinoic acid; SFX, sarafotoxin S6c.
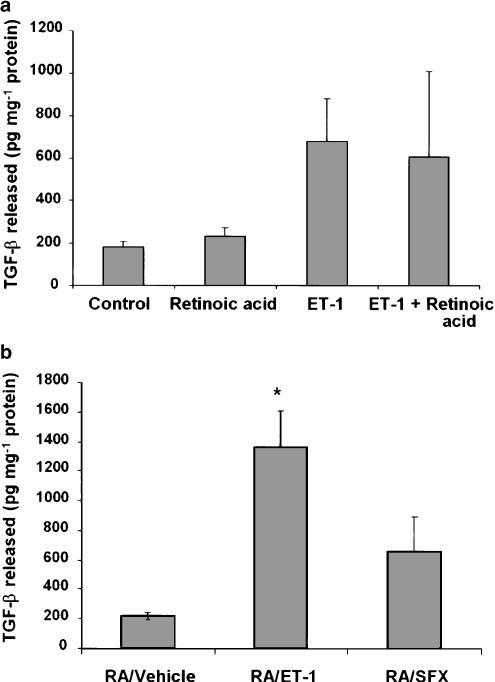
Retinoic acid treatment did not affect TGF-β1 synthesis as determined by its concentration in the culture medium (Figure 9a). Although, the presence of ET-1, with or without retinoic acid, during the entire culture period stimulated TGF-β1 synthesis, the effect was statistically not significant (Figure 9a). On the other hand, TGF-β1 synthesis was stimulated upon challenging retinoic acid-treated cells with ET-1 for 24 h (Figure 9b). Sarafotoxin S6c did not exert significant effect on TGF-β1 synthesis in retinoic acid-treated cells.
Figure 9.
Effect of retinoic acid and ET-1 or sarafotoxin S6c on TGF-β1 synthesis. (a) HSC were incubated with 2.5 μM retinoic acid or the vehicle (ethanol, 1 μl ml−1) without or with ET-1 (50 nM) for 10–12 days. The medium was changed every day and TGF-β1 released in the medium during the last 24 h was determined. (b) HSC were incubated with retinoic acid for 10–12 days. ET-1 or sarafotoxin S6c (50 nM) were then added and 24 h later TGF-β1 in the medium was determined. *P<0.01 vs vehicle. RA, retinoic acid; SFX, sarafotoxin S6c.
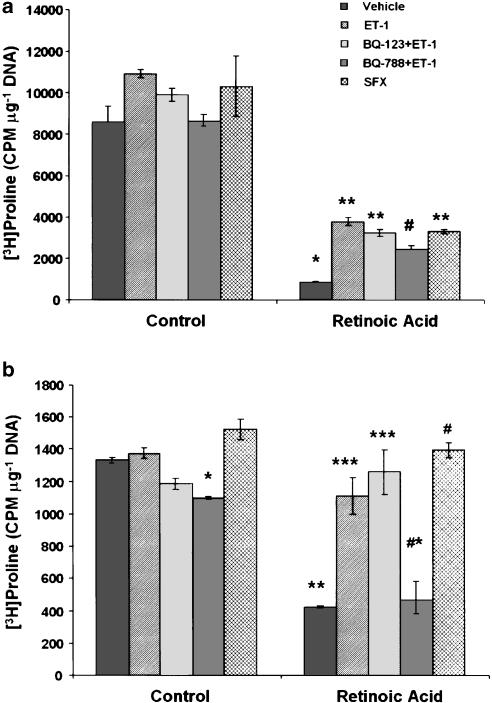
Total collagen synthesis was determined by measuring [3H]proline incorporation into the cellular protein pool and collagenase-releasable radioactivity from the secreted proteins. The incorporation of [3H]proline in the cellular (Figure 10a) and secreted (Figure 10b) proteins was much less in retinoic acid- than in vehicle-treated cells. The presence of ET-1 and sarafotoxin S6c, during the entire culture period, did not affect [3H]proline incorporation into the cellular proteins in control cells. However, significant increase was observed in cellular as well as secreted protein pools of cultures containing retinoic acid and ET-1 or sarafotoxin S6c (Figure 10). ET-1-induced incorporation of [3H]proline was inhibited when BQ-788 (ETB antagonist) was present in the medium (Figure 10a and b).
Figure 10.
Effect of retinoic acid and ET-1 or sarafotoxin S6c on collagen synthesis. (a) HSC were incubated with 2.5 μM retinoic acid or the vehicle (ethanol, 1 μl ml−1) without or with ET-1 (50 nM) or sarafotoxin S6c (SFX) (50 nM) for 10–12 days. Incubations were also performed with ET-1 in the presence of 10 μM BQ-123 or BQ-788. [3H]proline incorporation into the cellular proteins (a) or collagenase-sensitive secreted proteins (b) was determined. Cellular DNA concentration was measured in separate wells by Hoechst's method. (a) *P<0.001 vs control; **P<0.001 vs vehicle; #P<0.01 vs vehicle and <0.02 vs ET-1. (b) *P<0.02 vs vehicle; **P<0.001 vs control; ***P<0.01 vs vehicle; #P<0.001 vs vehicle; *#P<0.05 vs ET-1.
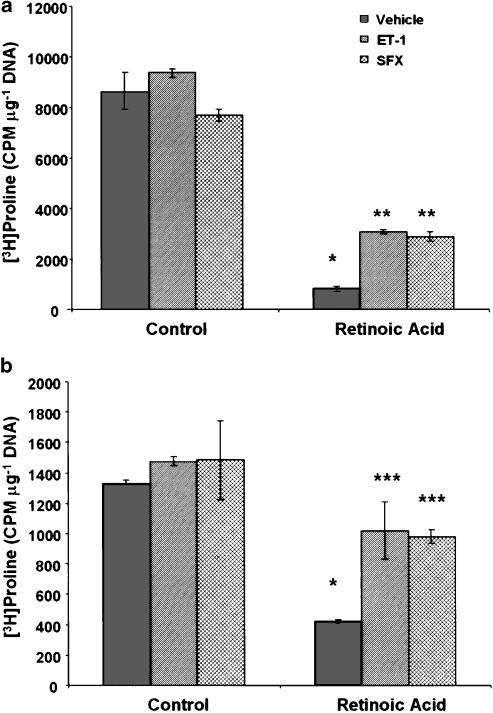
When the cell treated with the vehicle (ethanol) for 10–12 days were challenged with ET-1 or sarafotoxin S6c for 24 h, no significant change in [3H]proline incorporation into the cellular or secreted proteins was observed (Figure 11a and b). On the other hand, both agonists stimulated [3H]proline incorporation into cellular and secreted proteins in retinoic acid-treated cells.
Figure 11.
Effect of ET-1 and sarafotoxin S6c on collagen synthesis in retinoic acid-treated cells. HSC were incubated with 2.5 μM retinoic or the vehicle (ethanol, 1 μl ml−1) for 10–12 days. ET-1 (50 nM) or sarafotoxin S6c (SFX) (50 nM) were then added and at 24 h, [3H]proline incorporation into the cellular proteins (a) or collagenase-sensitive secreted proteins (b) was determined. Cellular DNA concentration was measured in separate wells by Hoechst's method. *P<0.001 vs control; **P<0.01 vs vehicle; ***P<0.05 vs vehicle. SFX, sarafotoxin S6c.
Discussion
This investigation demonstrates that the presence of retinoic acid in the culture medium prevents upregulation of ETB receptor and minimizes the transformation (activation) of HSC. Pinzani et al. (1992a) reported a direct relation between the loss of stored retinoids and activation of HSC. We have shown that hepatic gene expression and protein contents of ET-1 and its receptors are increased in cirrhosis (Gandhi et al., 1996a, 1996b; 1998; Anselmi et al., 2002) and in HSC isolated from the cirrhotic liver (Gandhi et al., 2000). It is known that HSC are depleted of the stored retinoids in the injured liver and during cell culture (Geerts et al., 1994; Friedman, 2000). Therefore, we hypothesized that the loss of retinoids may be a trigger for the upregulation of the ET-1 system and that this mechanism may have pathophysiological importance, particularly in hepatic fibrosis, in view of the strong evidence indicating the role of ET-1 in fibrosis in various organ systems (Weber et al., 1994; Hocher et al., 1997; Benigni, 2000; Teder & Noble, 2000). However, the presence of retinoic acid in the culture medium did not affect the expression of ET-1 and ETA receptor. In contrast, retinoic acid prevented up regulation of the expression of ETB receptor (mRNA as well as the density). Thus, it appears that retinoids regulate the expression of ETB receptor specifically in HSC.
ETB forms the major portion of total ET-1 receptors in rat HSC (Gabriel et al., 1999). The importance of ETB in HSC function is evidenced by its properties of causing contraction of HSC (Rockey, 1995) and stimulation of collagen synthesis in them (Gandhi et al., 2000). ETB also forms a significant proportion of ET-1 receptors in human HSC, activation of which inhibits PDGF- and serum-induced growth via cAMP-mediated mechanism (Mallat et al., 1996). In contrast, ETA activation stimulates mitogenic acivity via increase in cytosolic calcium in human HSC (Pinzani et al., 1996). Although the number of cells and their morphology in the presence and absence of ET-1 were found to be similar in the present study, the transformation of HSC (as determined by α-SMA and collagen α type-I expression) was lower in the presence of ET-1 suggesting that ET-1 may limit the activation of HSC in culture.
Retinoic acid inhibited strongly the overall protein synthesis ([3H]leucine incorporation) and collagen synthesis ([3H]proline incorporation). The presence of ET-1 or sarafotoxin S6c during the entire time of culture induced a modest increase in the protein synthesis in HSC, suggesting their involvement in the synthesis of noncollagenous proteins. Equally interesting is the observation that a short-term exposure to ET-1 or sarafotoxin S6c did not affect protein synthesis in culture-activated HSC, but stimulated this process in the retinoic acid-treated cells. ET-1-induced protein synthesis was not inhibited by ETA or ETB antagonist, indicating the possibility of the presence of a non-A-non-B ET-1 receptor in HSC. Previously, we have shown that ET-1, via ETA and ETB receptors, respectively, stimulates TGF-β1 and collagen synthesis in control but not in activated HSC (Gandhi et al., 2000). Consistent with this observation, ET-1, but not sarafotoxin S6c, stimulated TGF-β1 synthesis in retinoic acid-treated cells. ET-1 and sarafotoxin S6c did not affect [3H]proline incorporation into activated HSC, but stimulated it in retinoic acid-treated cells, which retain the normal phenotype. Previously, it was shown that the mRNA expression of collagen I is much greater in activated than in quiescent HSC; collagen III is expressed by both cells types (Pinzani & Abboud, 1991; Geerts et al., 1994). No significant difference in the expression of collagen III mRNA was observed between vehicle- and retinoic acid-treated cells under the present experimental conditions although that of collagen I was lower in the latter. However, ET-1-induced stimulation of the mRNA expression of both collagen types as well as overall collagen synthesis ([3H]proline incorporation) in retinoic acid-treated cells suggest its important role in the maintenance of the hepatic architecture in physiology.
Earlier work demonstrated that incubation of passaged (fully activated) HSC with retinoids results in its intracellular uptake and the concomitant depression of cell proliferation, collagen and TGF-β1 production, and reversal of morphological and phenotypical changes (Shiratori et al., 1987; Davis, 1988; Davis & Vucic, 1988, 1989; Friedman & Blaner, 1989; Geerts et al., 1989a, 1989b; Davis et al., 1990; Pinzani et al., 1992a). However, the effects of retinoids on quiescent HSC have not been investigated although hypervitaminosis A causes hepatic fibrosis in human subjects (Leo & Lieber, 1988), and pretreatment of rats with vitamin A reduces the number of HSC and decreases cellular collagen production (Shiratori et al., 1987; Davis et al., 1988). We found that the number of cells maintained in the medium supplemented with retinoic acid was low. It should be noted that a small number of cells in incubations containing retinoic acid exhibited the morphology of activated HSC and expressed α-SMA as determined by Western analysis. These results suggest the presence of at least two subpopulations of HSC in the liver, that is, retinoic acid-resistant and -sensitive cells. The pathophysiological significance of the two subpopulations of HSC in the liver remains to be determined.
In summary, this investigation demonstrates that retinoic acid exerts negative regulatory control on the expression and function of ETB receptors in HSC. The depletion of retinoic acid from HSC leads to the loss of such regulation, and the maintenance of their quiescent phenotype. Specific molecular mechanisms and pathophysiological significance of these processes remain to be investigated.
Acknowledgments
This work was supported by a grant from NIH (DK 54411) and a VA Merit award.
Abbreviations
- BrDU
bromodeoxyuridine
- BSA
bovine serum albumin
- ECM
extracellular matrix
- ET
endothelin
- FBS
fetal bovine serum
- HSC
hepatic stellate cells
- HBSS
Hank's balanced salt solution
- PBS
phosphate-buffered saline
- PMSF
phenylmethylsulfonyl fluoride
- RT–PCR
reverse transcriptase–polymerase chain reaction
- TCA
trichloroacetic acid
References
- ANSELMI K., SUBBOTIN V.M., NEMOTO E., GANDHI C.R. Accelerated reversal of carbon tetrachloride-induced cirrhosis in rats by endothelin receptor antagonist TAK-044. J. Gastroenterol. Hepatol. 2002;17:589–597. doi: 10.1046/j.1440-1746.2002.02705.x. [DOI] [PubMed] [Google Scholar]
- BENIGNI A. Endothelin antagonists in renal disease. Kidney Int. 2000;57:1778–1794. doi: 10.1046/j.1523-1755.2000.00023.x. [DOI] [PubMed] [Google Scholar]
- BRINCKERHOFF C.E., COFFEY J.W., SULLIVAN A.C. Inflammation and collagenase production in rats with adjuvant arthritis reduced with 13-cis-retinoic acid. Science. 1983;221:756–758. doi: 10.1126/science.6308759. [DOI] [PubMed] [Google Scholar]
- DAVIS B.H. Transforming growth factor β responsiveness is modulated by the extracellular collagen matrix during hepatic Ito cell culture. J. Cell. Physiol. 1988;136:547–553. doi: 10.1002/jcp.1041360323. [DOI] [PubMed] [Google Scholar]
- DAVIS B.H., PRATT B.M., MADRI J. Retinol and extracellular collagen matrices modulate hepatic Ito cell collagen phenotype and cellular retinol binding protein levels. J. Biol. Chem. 1988;262:10280–10286. [PubMed] [Google Scholar]
- DAVIS B., VUCIC A. The effect of retinol on Ito cell proliferation in vitro. Hepatology. 1988;8:788–793. doi: 10.1002/hep.1840080416. [DOI] [PubMed] [Google Scholar]
- DAVIS B., VUCIC A. Modulation of vitamin A metabolism during hepatic and intestinal cell culture. Biochim. Biophys. Acta. 1989;1010:318–324. doi: 10.1016/0167-4889(89)90055-4. [DOI] [PubMed] [Google Scholar]
- DAVIS B.H., KRAMER R.T., DAVIDSON N.O. Retinoic acid modulates rat Ito cell proliferation, collagen and transforming growth factor β production. J. Clin. Invest. 1990;86:2062–2070. doi: 10.1172/JCI114943. [DOI] [PMC free article] [PubMed] [Google Scholar]
- DAVIS B.H., RAPP U.R., DAVIDSON N.O. Retinoic acid and transforming growth factor β differentially inhibit platelet-derived growth factor-induced Ito-cell activation. Biochem. J. 1991;278:43–47. doi: 10.1042/bj2780043. [DOI] [PMC free article] [PubMed] [Google Scholar]
- FRIEDMAN S.L. Molecular regulation of hepatic fibrosis, an integrated cellular response to tissue injury. J. Biol. Chem. 2000;275:2247–2250. doi: 10.1074/jbc.275.4.2247. [DOI] [PubMed] [Google Scholar]
- FRIEDMAN S.L., BLANER W.S. Activation of cultured lipocytes by Kupffer cell medium (KCM) is accompanied by release of retinol. Gastroenterology. 1989;96:A598. [Google Scholar]
- FUMARULO R., CONESE M., RICCARDI S., GIORDANO D., MONTEMURO P., GOLUCCI M., SEMERARO N. Retinoids inhibit the respiratory burst and degranulation of stimulated human polymorphonuclear leukocytes. Agents Actions. 1991;34:339–342. doi: 10.1007/BF01988726. [DOI] [PubMed] [Google Scholar]
- GABRIEL A., KUDDUS R.H., RAO A.S., GANDHI C.R. Down-regulation of endothelin receptors by transforming growth factor β1 in hepatic stellate cells. J. Hepatol. 1999;30:440–450. doi: 10.1016/s0168-8278(99)80103-2. [DOI] [PubMed] [Google Scholar]
- GANDHI C.R., KANG Y., MADARIAGA J., AGGARWAL S., DE WOLF A., SCOTT V., FUNG J. Altered endothelin homeostasis in patients undergoing liver transplantation. Liver Transplant. Surg. 1996a;2:362–369. doi: 10.1002/lt.500020506. [DOI] [PubMed] [Google Scholar]
- GANDHI C.R., KUDDUS R.H., UEMURA T., RAO A.S. Endothelin stimulates transforming growth factor-β1 and collagen synthesis in stellate cells from control but not cirrhotic rat liver. Eur. J. Pharmacol. 2000;406:311–318. doi: 10.1016/s0014-2999(00)00683-x. [DOI] [PubMed] [Google Scholar]
- GANDHI C.R., NEMOTO E.M., WATKINS S.C., SUBBOTIN V.M. An endothelin receptor antagonist TAK- 044 ameliorates carbon tetrachloride-induced acute liver injury and portal hypertension in rats. Liver. 1998;18:39–48. doi: 10.1111/j.1600-0676.1998.tb00125.x. [DOI] [PubMed] [Google Scholar]
- GANDHI C.R., SPROAT L.A., SUBBOTIN V.M. Increased hepatic endothelin-1 levels and endothelin receptor density in cirrhotic rats. Life Sci. 1996b;58:55–62. doi: 10.1016/0024-3205(95)02255-4. [DOI] [PubMed] [Google Scholar]
- GANDHI C.R., STEPHENSON K., OLSON M.S. Endothelin, a potent peptide agonist in the liver. J. Biol. Chem. 1990;265:17432–17435. [PubMed] [Google Scholar]
- GEERTS A., DEBLESER P., HAUTEKEETE M.L., NIKI T., WISSE E.Fat-storing (Ito) cell biology The Liver: Biology and Pathobiology 1994New York: Raven Press, Ltd; 819–838.ed. Arias, I.M., Boyer, J.L., Fasuto, N., Jakoby, W.B., Schachter, D.L. & Shafritz, D.A. pp [Google Scholar]
- GEERTS A., VRIJSEN R., RAUTERBERG A., BURT P., SCHELLINCK P., WISSE E. In vitro differentiation of fat-storing cells parallels marked increase of collagen synthesis and secretion. J. Hepatol. 1989a;9:59–68. doi: 10.1016/0168-8278(89)90076-7. [DOI] [PubMed] [Google Scholar]
- GEERTS A., VRIJSEN R., SCHELLINCK P., WISSE E.Retinol affects the phenotype and protein synthesis of fat-storing cell derived myofibroblasts in vitro Cells of Hepatic Sinusoids 1989b2Rijswijk, The Netherlands: Kupffer Cell Foundation; 20–24.ed. Wisse, E., Knook, D. & Decker, K. Vol [Google Scholar]
- HOCHER B., THONE-REINEKE T., ROHMEISS P., SCHMAGER F., SLOWINSKI T., BURST V., SIEGMUND F., QUERTERMOUS T., BAUER C., NEUMAYER H., SCHLEUNING W., THEURING F. Endothelin-1 transgenic mice develop glomerulosclerosis, interstitial fibrosis, and renal cysts but not hypertension. J. Clin. Invest. 1997;99:1380–1389. doi: 10.1172/JCI119297. [DOI] [PMC free article] [PubMed] [Google Scholar]
- HOUSSET C., ROCKEY D.C., BISSELL D.M. Endothelin receptors in rat liver: lipocytes as a contractile target for endothelin 1. Proc. Natl. Acad. Sci. U.S.A. 1993;90:9266–9270. doi: 10.1073/pnas.90.20.9266. [DOI] [PMC free article] [PubMed] [Google Scholar]
- HSU J.-Y., PFAHL M. ET-1 expression and growth inhibition of prostrate cancer cells: a retinoid target with novel specificity. Cancer Res. 1998;58:4817–4822. [PubMed] [Google Scholar]
- KAWADA N., TRAN-THI T.A., KLEIN H., DECKER K. The contraction of hepatic stellate (Ito) cells stimulated with vasoactive substances. Possible involvement of endothelin 1 and nitric oxide in the regulation of the sinusoidal tonus. Eur. J. Biochem. 1993;213:815–823. doi: 10.1111/j.1432-1033.1993.tb17824.x. [DOI] [PubMed] [Google Scholar]
- KUDDUS R.H., NALESNIK M.A., SUBBOTIN V.M., RAO A.S., GANDHI C.R. Enhanced synthesis and reduced metabolism of endothelin-1 (ET-1) by hepatocytes: a mechanism of increased ET-1 levels in cirrhosis. J. Hepatol. 2000;33:725–732. doi: 10.1016/s0168-8278(00)80302-5. [DOI] [PubMed] [Google Scholar]
- LEO M.A., LIEBER C.S. Hypervitaminosis A: a liver lover's lament. Hepatology. 1988;8:412–417. doi: 10.1002/hep.1840080237. [DOI] [PubMed] [Google Scholar]
- MALLAT A., PREAUX A.M., SERRADEIL-LE GAL C., RAUFASTE D., GALLOIS C., BRENNER D.A., BRADHAM C., MACLOUF J., IOURGENKO V., FOUASSIER L., DHUMEAUX D., MAVIER P., LOTERSZTAJN S. Growth inhibitory properties of endothelin-1 in activated human hepatic stellate cells: a cyclic adenosine monophosphate-mediated pathway. Inhibition of both extracellular signal-regulated kinase and c-Jun kinase and upregulation of endothelin B receptors. J. Clin. Invest. 1996;98:2771–2778. doi: 10.1172/JCI119103. [DOI] [PMC free article] [PubMed] [Google Scholar]
- ORFANOS C.E., BAUER R. Evidence for antiinflammatory activities of oral synthetic retinoids: experimental findings and clinical experience. Br. J. Dermatol. 1983;S25:55–60. [PubMed] [Google Scholar]
- PINZANI M., ABBOUD H.E.Liver fat-storing cells, polypeptide growth factors and the progression of chronic liver inflammation and fibrosis Experimental and Clinical Hepatology 1991Amsterdam: Elsevier; 63–75.ed. Gentilini, P. & Dianzani, M.U. pp [Google Scholar]
- PINZANI M., GENTILINI P., ABBOUD H.E. Phenotypical modulation of fat-storing cells by retinoids. Influence on unstimulated and growth factor-induced cell proliferation. J. Hepatol. 1992a;14:211–220. doi: 10.1016/0168-8278(92)90160-q. [DOI] [PubMed] [Google Scholar]
- PINZANI M., FAILLI P., RUOCCO C., CASINI A., MILANI S., BALDI E., GIOTTI A., GENTILINI P. Fat-storing cells as liver-specific pericytes. Spatial dynamics of agonist-stimulated intracellular calcium transients. J. Clin. Invest. 1992b;90:642–646. doi: 10.1172/JCI115905. [DOI] [PMC free article] [PubMed] [Google Scholar]
- PINZANI M., MILANI S., DE FRANCO R., GRAPPONE C., CALIGIURI A., GENTILINI A., TOSTI-GUERRA C., MAGGI M., FAILLI P., RUOCCO C., GENTILINI P. Endothelin 1 is overexpressed in human cirrhotic liver and exerts multiple effects on activated hepatic stellate cells. Gastroenterology. 1996;110:534–548. doi: 10.1053/gast.1996.v110.pm8566602. [DOI] [PubMed] [Google Scholar]
- RAGO R., MITCHEN J., WILDING G. DNA fluorometric assay in 96-well tissue culture plates using Hoechst 33258 after cell lysis by freezing in distilled water. Anal. Biochem. 1990;191:31–34. doi: 10.1016/0003-2697(90)90382-j. [DOI] [PubMed] [Google Scholar]
- ROCKEY D.C. Characterization of endothelin receptors mediating rat hepatic stellate cell contraction. Biochem. Biophys. Res. Commun. 1995;207:725–731. doi: 10.1006/bbrc.1995.1247. [DOI] [PubMed] [Google Scholar]
- ROCKEY D.C., CHUNG J.J. Endothelin antagonism in experimental hepatic flbrosis. Implications for endothelin in the pathogenesis of wound healing. J. Clin. Invest. 1996;98:1381–1388. doi: 10.1172/JCI118925. [DOI] [PMC free article] [PubMed] [Google Scholar]
- SHINA S., SHIRATORI Y., KAWASE T., SUGIMOTO T.Increased collagen synthesis by fat-storing cells exposed to superoxide- possible mechanism of hepatic fibrosis during inflammation Cells of Hepatic Sinusoids 19892Rijswijk, The Netherlands: Kupffer Cell Foundation; 52–56.ed. Wisse, E., Knook, D.L. & Decker, K. Vol [Google Scholar]
- SHIRATORI Y., GEERTS A., ICHIDA T., KAWASE T., WISSE E. Kupffer cells from CCl4-induced fibrotic livers stimulate proliferation of fat-storing cells. J. Hepatol. 1986;3:294–303. doi: 10.1016/s0168-8278(86)80481-0. [DOI] [PubMed] [Google Scholar]
- SHIRATORI Y., ICHIDA T., GEERTS A., WISSE E. Modulation of collagen synthesis by fat-storing cells, isolated from CCl4- or vitamin A-treated rats. Dig. Dis. Sci. 1987;32:1281–1289. doi: 10.1007/BF01296379. [DOI] [PubMed] [Google Scholar]
- TAKASE S., ENYAMA K., TAKADA A., TSUTSUMI M. Effects of vitamin A on collagen metabolism by cultured rat liver cells. Gastroenterol. Jpn. 1992;27:354–363. doi: 10.1007/BF02777754. [DOI] [PubMed] [Google Scholar]
- TANG G.W., RUSSELL R.M. 13-cis-retinoic acid is an endogenous compound in human serum. J. Lipid Res. 1990;31:175–182. [PubMed] [Google Scholar]
- TEDER P., NOBLE P.W. A cytokine reborn? Endothelin-1 in pulmonary inflammation and fibrosis. Am. J. Respir. Cell. Mol. Biol. 2000;23:7–10. doi: 10.1165/ajrcmb.23.1.f192. [DOI] [PubMed] [Google Scholar]
- UEMURA T., GANDHI C.R. Inhibition of DNA synthesis in cultured hepatocytes by endotoxin-conditioned medium of activated stellate cells is transforming growth factor-β- and nitric oxide-independent. Br. J. Pharmacol. 2001;133:1125–1133. doi: 10.1038/sj.bjp.0704151. [DOI] [PMC free article] [PubMed] [Google Scholar]
- WEBER K.T., SUN Y., GUARDA E. Structural remodeling in hypertensive heart disease and the role of hormones. Hypertension. 1994;23:869–877. doi: 10.1161/01.hyp.23.6.869. [DOI] [PubMed] [Google Scholar]
- ZHANG J.X., BAUER M., CLEMENS M.G. Vessel- and target cell-specific actions of endothelin-1 and endothelin-3 in rat liver. Am. J. Physiol. 1995;269:G269–G277. doi: 10.1152/ajpgi.1995.269.2.G269. [DOI] [PubMed] [Google Scholar]


