Abstract
Glycerol trinitrate (GTN) has been used in therapy for more than 100 years. Biological effects of GTN are due to the release of the biomediator nitric oxide (NO). However, the mechanism by which GTN provides NO, in particular in liver, is still unknown. In this study, we provide experimental evidence showing that cytoplasm, endoplasmic reticulum, and mitochondria are required for the release of NO from GTN in the liver.
NO and nitrite (NO2−) were determined using low-temperature electron paramagnetic resonance and the Griess reaction, respectively.
The first step of GTN biotransformation is the release of NO2−. This step is performed in cytoplasm and catalyzed by glutathione-S-transferase. The second step is the rate-limiting step where NO2− is slowly reduced to NO. This is mainly catalyzed by cytochrome P-450. The second phase can be significantly enhanced by decreasing the pH value, a situation which occurs during ischemia. At high NADPH concentrations exceeding physiological values, cytochrome P-450 catalyzes GTN biotransformation without the involvement of cytoplasmic glutathione-S-transferase.
In conclusion, our data show that NO2− derived from the first step of biotransformation of GTN in the liver is the precursor of NO but not a product of NO degradation; consequently, NO2− levels are not likely to be a marker of NO release from GTN as earlier suggested.
Keywords: Nitric oxide, glycerol trinitrate biotransformation, nitroglycerin, nitrite, liver, electron paramagnetic resonance
Introduction
It was found empirically that glycerol trinitrate (GTN) is beneficial in the treatment of angina pectoris, congestive heart failure, and myocardial infarction. It is now clear that GTN affects these cardiac diseases via vasodilatation by means of nitric oxide (NO). The latter was found to stimulate guanylyl cyclase, thereby upregulating the vasodilatory second messenger, cGMP. This signaling pathway leads to the relaxation of vascular smooth muscles. The exact mechanism whereby NO is generated from GTN is, however, still unknown (Ahlner et al., 1991; Fung et al., 1992; Harrison & Bates, 1993; Parker & Parker, 1998; Doel et al., 2001).
A variety of hypotheses on the mechanism of NO generation from GTN have been forwarded. The oldest hypothesis suggests that the enzyme responsible for GTN transformation is the ‘glutathione-dependent organic nitrate reductase' (Needleman & Hunter Jr, 1976). Later on, this enzyme was recognized as glutathione-S-transferase, existing in the form of various isoenzymes and localized in the cytoplasm (Keen et al., 1976; Taylor et al., 1989). Ten years ago, this mechanism of GTN bioactivation was rejected (Kurz et al., 1993; Salvemini et al., 1993) and, instead, cytochrome P-450 was suggested to catalyze the transformation of GTN to NO (Servent et al., 1989; Schroder, 1992; Delaforge et al., 1993; Yuan et al., 1997). Moreover, it has been shown that CYP3A, an enzyme that is responsible for more than 50% of the cytochrome P-450-dependent xenobiotic metabolism, has particularly high activity in GTN metabolism in rat liver (Delaforge et al., 1993) and in other tissues (Yuan et al., 1997; Minamiyama et al., 1999). Recently, a new hypothesis appeared suggesting xanthine oxidoreductase as the enzyme responsible for GTN bioactivation. Xanthine oxidoreductase has been reported to catalyze the transformation of GTN to nitrite (NO2−) and further NO2− to NO (Millar et al., 1998; Doel et al., 2001). Although the latter studies were performed with purified enzymes without testing cells or subcellular fractions, the authors suggest that biotransformation of GTN should proceed via two steps, where NO2− is an intermediate (Doel et al., 2001). Previously NO2− was considered as an oxidative product of NO metabolism and used to quantitate NO coming from GTN (Salvemini et al., 1992; Hasegawa et al., 1999; Minamiyama et al., 1999). It has been recently shown that the transformation of NO2− to NO is catalyzed by the bc1 complex of mitochondria (Kozlov et al., 1999). Thus, four enzymatic systems, namely glutathione-S-transferase, cytochrome P-450, xanthine oxidoreductase, and the bc1 complex of mitochondria have to be taken into account when searching for the mechanism of NO release from GTN.
The exact mechanism of GTN activation leading to NO release was reported to vary from tissue to tissue. It has been shown that ‘organic-nitrate-reductase' activity in liver is mainly present in the cytoplasm, in contrast to heart where nitrate reductase is assumed to be associated with mitochondria (Taylor et al., 1989). Xanthine oxidoreductase activity resulting from proteolytic transformation of xanthine dehydrogenase is more pronounced in postischemic tissues (MCCord, 1985). Cytochrome P-450 enzymes are located preferentially in liver. Thus, it is not likely that an identical mechanism of NO release from GTN occurs in all tissues.
Long-term therapy with GTN develops the tolerance to this organic nitrate. It has been shown that the insufficient response is not at the level of guanylyl cyclase. Therefore, it is of major interest to analyze the metabolic steps by which GTN finally provides NO.
Methods
Chemicals
Glutathione (GSH), myxothiazol, reduced nicotinamide adenine dinucleotide (NADH), reduced nicotinamide adenine dinucleotide phosphate (NADPH), troleandomycin (oleandomycin triacetate) were obtained from Sigma Chemical Co St Louis, MO, U.S.A.. Gluthatione trinitrate (GTN), acetonitril, potassium nitrite (KNO2) were received from Merck Co Darmstadt, Germany. NO gas was obtained from AGA Co. (Austria). Other chemicals were of analytical grade purity. Hemoglobin (Hb) was prepared from bovine red blood cells, as described before (Kozlov et al., 1996).
Preparation of rat liver homogenate and subcellular fractions
Adult male Sprague–Dawley rats weighing 250–300 g (Animal Research Laboratories, Himberg, Austria) were used in this study. The animals were starved overnight. Immediately after decapitation, the portal vein was cannulated and liver was perfused with an ice-cold saline solution. Then, the liver was removed to a beaker with ice-cold sucrose buffer (0.25 M sucrose, 10 mM Tris-HCl, 1 mM EDTA, 0.1% ethanol, pH=7.4), cut into small pieces and washed with the same buffer to remove the remaining blood. After drying with paper, the weight of the liver pieces was determined and the same buffer was added in a ratio of 1 : 6 liver/buffer (w/v). The liver was homogenized using Potter–Elvehjem homogenizer. The obtained homogenate was filtrated through three layers of surgical gauze, divided into portions of 1 ml, and frozen in liquid nitrogen. Another portion of liver homogenate was used for preparation of subcellular fractions.
Subcellular fractions were prepared as previously described (de Duve, 1983; Briggs & Pritsos, 1999). Briefly, the liver homogenate was centrifuged for 10 min at 600 × g to pellet the nuclear fraction. The resulting supernatant was centrifuged for 10 min at 3000 × g to pellet the heavy mitochondrial fraction. The resulting supernatant was centrifuged at 25,000 × g for 10 min to obtain a light mitochondrial pellet. The supernatant was removed from the light mitochondrial pellet and centrifuged at 100,000 × g for 35 min to obtain the microsomal pellet. The supernatant constituted the cytoplasmic fraction. Light mitochondrial fraction obtained using this way of preparation contains also lysosomes and peroxisomes.
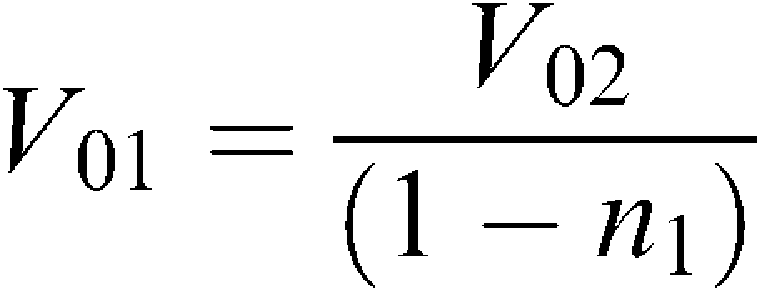
Each pellet was carefully removed with a known amount of buffer and the volume of the fraction was determined for further calculation of homogenate volume corresponding to the volume of fraction obtained. Considering that V0=VS+VFR and VFR=n × V0, where V0, VS, and VFR are the volumes before centrifugation, supernatant volume, and pellet volume, respectively; n – a coefficient indicating a volume portion of a fraction in original homogenate, we have arrived at the following equations:
 |
 |
 |
where V01, V02, V03, and V04 are the volumes used to spin down the nuclear pellet, heavy mitochondria, light mitochondria, and microsomes, respectively. n1, n2, and n3 are the volume portion of nuclear, heavy mitochondrial, light mitochondrial fractions, respectively, obtained after corresponding centrifugation. Using these formula, we recalculated the homogenate volume corresponding to each fraction volume.
Protein concentrations in liver homogenate and subcellular fractions were measured by the Biuret method, using albumin as a reference protein. Then the amount of protein was adjusted as it would be obtained from 1 ml of original homogenate (Table 1 ). The results presented in Table 1 show the distribution of protein concentrations in the fractions studied. These concentrations were used to reconstruct the liver homogenate using subcellular fractions.
Table 1.
Protein content in different subcellular fractions adjusted to 1 ml of original homogenate
| Protein amount ml−1 of homogenate | Concentrations (mg protein ml−1) used in experiments | |
|---|---|---|
| Fraction | ||
| Liver homogenate (1 : 6 w v−1) | 25.4±2.5 | 10 |
| Nuclear* | 8.12±1.8 | Not studied |
| Heavy mitochondria | 1.86±0.76 | 0.73 |
| Light mitochondria** | 1.30±0.19 | 0.51 |
| Microsomal | 2.29±0.34 | 0.90 |
| Cytoplasm | 10.52±0.77 | 4.14 |
| Sum | 24.09*** | 9.48 |
The data are based on five independent preparations.
Contains up to 10% of nondestroyed cells.
Contains also lysosomes and peroxisomes.
Approx. 5% of protein was lost during preparation.
Experimental design
Liver homogenate or subcellular fractions were incubated in a buffer mixture containing 50% of sucrose buffer and 50% phosphate buffer (154 mM KCl, 20 mM Tris, 4 mM KH2PO4, 1 mM EDTA, 2 mM MgCl2, pH=7.35). After the addition of all reagents except GTN or NO2−, this sample was kept under a flow of nitrogen for 20 min on a shaking table to provide gentle mixing of samples with nitrogen. Afterwards, 10 μl of GTN or NO2− were injected into the samples under anaerobic conditions. The samples were aspirated in a syringe without exposure to oxygen and kept at 20±2°C inside a home-made anaerobic chamber. After incubation, the samples were either frozen in liquid nitrogen for following electron paramagnetic resonance (EPR) measurements or they were taken for NO2− assay. The final concentrations of reagents used were GSH, 2.5 mM; NADPH, 0.5 mM; NADH, 0.5 mM; allopurinol, 0.3 mM; myxothiazol, 0.1 mM; metyrapone, 0.2 mM; GTN, 0.2 mM, NO2−, 0.2 mM; Hb, 0.6 mM.
NO2− assay
NO2− was determined using the Griess reaction. The samples were placed in cutoff microfiltration tubes (30,000 kDa) under argon centrifuged for 15 min at 10,000 × g, 200 μl of filtrate was mixed with 200 μl of water and 500 μl of Griess reagent containing 4% sulfanilamide, 0.2% naphtylethylenediamine dihydrochloride in 10% phosphoric acid. The absorbance was measured with a Milton Roy, MR 3000 spectrophotometer at 543 nm using 493 and 593 nm to correct baseline. The calibration was made using standard NO2− solutions.
EPR detection of NO
EPR allows to detect NO in nontransparent samples such as tissues and tissue homogenates. Here we used a method based on a reaction between NO and Hb approaching the diffusion limit (Gow & Stamler, 1998; Gow et al., 1999). This reaction yields the nitrosyl complex of hemoglobin (NO-Hb) that is rather stable and exhibits a particular EPR signal, sufficient for quantification of NO at nanomolar concentrations (Henry et al., 1993; Kozlov et al., 1996). Formation of NO-Hb complexes has already been demonstrated in vivo upon treatment of animals with GTN (Kohno et al., 1995) and in vitro system for detection of NO derived from mitochondria (Kozlov et al., 1999). The samples for EPR spectroscopy were placed in 1 ml syringes (B. Braun Melsungen AG) and frozen in liquid nitrogen. Then the samples were pressed out of the syringes and moved to a finger-tip liquid nitrogen dewar for EPR measurements. The EPR spectra were recorded at liquid nitrogen temperature with a Bruker EMX EPR spectrometer (the general settings were: microwave frequency 9.431 GHz, modulation frequency 100 kHz, microwave power 20 mW, modulation amplitude 4 G; gain 105). The calibration of NO-Hb signals was performed as described previously (Kozlov et al., 1996) using aqueous solutions of NO, and using NO2− solutions reduced by dithionite as described by Tsuchiya et al. (1996). Both calibrations gave identical results.
GSH assay
Quantitation of reduced GSH was carried out by high-performance liquid chromatography (HPLC) with ortho-phthalaldehyde (OPA) precolumn derivatization as described previously (Cereser et al., 2001). The HPLC separation of GSH–OPA adducts was achieved on a C-18 reversed-phase RT 125-4 column (5 μM particle size) using LC Module I Waters HPLC system (Milford, U.S.A.) equipped with a fluorescence detector. Derivatives were eluted using an acetonitrile gradient (0–50% of acetonitrile) in a 50 mM sodium acetate buffer, pH 6.2. The flow rate during elution was 1 ml min−1. Integration of chromatograms was performed using Waters Millenium software (Milford, U.S.A.). Standard GSH solution was used to build up a calibration curve.
Statistic
Statistical parameters were calculated using ANOVA (Exel 5.0 software, Microsoft Inc.). The data are presented as mean±SEM; if not specified in the figure legend, the number of experiments (n) was 3.
Results
Kinetics of NO and NO2− release from GTN in liver homogenate
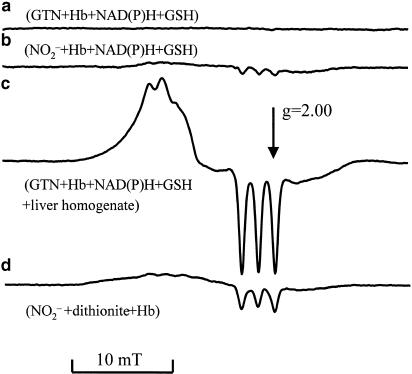
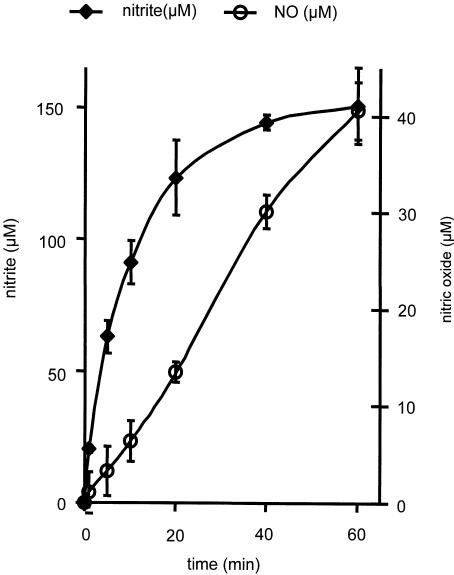
NO release was followed by the NO-Hb complex formation and identified by EPR spectroscopy. Addition of GTN to liver homogenates resulted in the appearance of an EPR signal with the triplet splitting characteristic of the NO-Hb complex (Figure 1). The intensity of this signal increased as a function of time (Figure 2). In order to evaluate the metabolic link of NO formation to NO2−, we followed the kinetics of both metabolites. GTN-derived NO2− appeared in the homogenate much earlier than NO and accumulated to higher values (Figure 2). NO2− concentration was found to linearly increase within the first 10 min and reached a steady state after 25–30 min. In contrast, NO concentration grows linearly at a much lower level up to 60 min without reaching a steady state.
Figure 1.
EPR spectra observed in the following samples after they were incubated for 40 min with GTN or NO2−: (a) 200 μM GTN+650 μM Hb+500 μM NADPH+500 μM NADH+2.5 mM GSH +5 mM succinate; (b) the same as (a), but 100 μM NO2− was added instead of 200 μM GTN; (c) the same as (a), but liver homogenate (4 mg protein ml−1) was added additionally; (d) standard NO-Hb signal obtained in the presence of 1 M dithionite, 3 mM Hb, and 10 μM NO2−.
Figure 2.
Time courses of NO2− and NO release from GTN in rat liver homogenate. Experimental conditions: NO generation was followed in a mixture containing 10 mg protein ml−1 of liver homogenate, 200 μM GTN, 600 μM Hb, and 2.5 mM GSH. NO2− generation was followed in the same mixture, but Hb was omitted. Typical EPR spectra of NO-Hb complex observed in this experiment are presented in Figure 1. EPR settings: microwave frequency 9.431 GHz; modulation frequency 100 kHz; microwave power 20 mW; modulation amplitude 4 G; gain 105.
Consequently, NO2− levels after 10 min of incubation were taken as a measure for the rate of NO2− release from GTN, while the rate of NO formation was estimated after 40 min of incubation with GTN. Figure 1 shows that the EPR spectra of the NO-Hb complexes observed during incubation of GTN with liver homogenate do not originate from a direct interaction between Hb and GTN or NO2−. A weak signal of the NO-Hb complexes was also obtained when Hb alone was incubated with NO2− (Figure 1b), but not with GTN (Figure 1a). This signal, however, was of marginal significance because the rate of NO generation was much higher when GTN was added to liver homogenates (Figure 1c).
Effect of pH and reducing agents on the formation of NO and NO2−
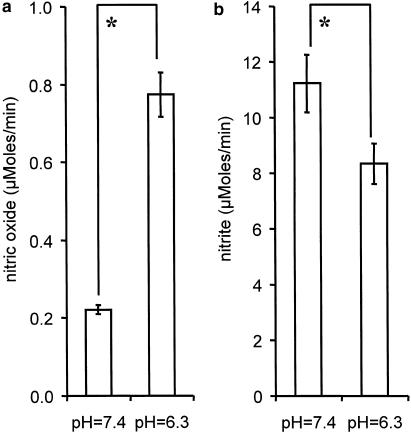
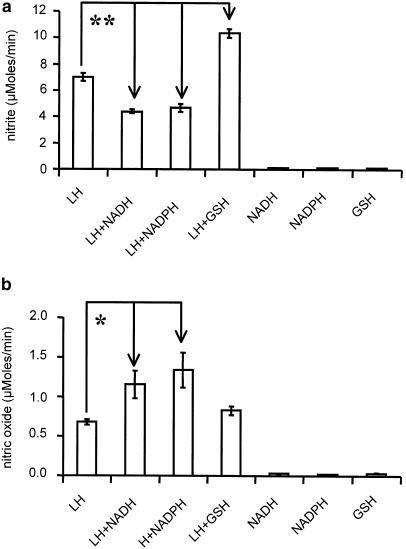
Reducing agents and pH values were found to affect NO and NO2− levels differentially. Acid pH values (pH=6.3) characteristic for ischemic tissues were found to increase the rate of NO release by a factor of three (Figure 3a), while NO2− levels were significantly decreased as compared to the corresponding values at pH=7.4 (Figure 3b). The presence of NADH or NADPH decreased NO2− levels (Figure 4a), while NO release was elevated (Figure 4b). GSH increased significantly NO2− levels (Figure 4a), but did not influence NO levels (Figure 4b). None of those reducing agents was capable of releasing either NO or NO2− from GTN in the absence of liver homogenate (Figure 4a,b).
Figure 3.
Effect of acid pH values on the rate of NO and NO2− release from GTN in rat liver homogenate. (a) NO levels were detected after 40 min incubation of samples containing 200 μM GTN, 600 μM Hb, 2.5 mM GSH, and liver homogenate (10 mg protein ml−1); (b) NO2− levels were detected after 10 min incubation of samples prepared as described in (a), but without Hb. The release rates for NO2− and NO were calculated considering that the concentrations of NO2− and NO were linearly increasing in first 10 and 40 min of the incubation, respectively. *P<0.02; n=6.
Figure 4.
Effect of enzyme substrates on the release of NO2− (a) and NO (b) from GTN in rat liver homogenates. Experimental conditions for NO2− and NO detection were as indicated in Figure 3. The enzyme substrates were added at the following concentrations: 2.5 mM GSH, 0.5 mM NADPH, 0.5 mM NADH. *P<0.04; **P<0.0005.
NO2− release in different subcellular fractions
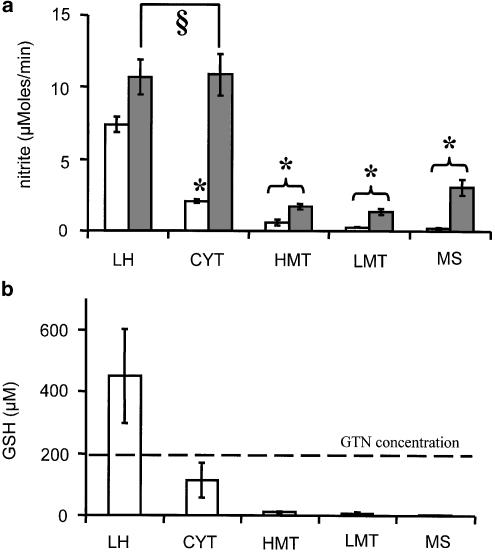
Addition of GTN to the various subcellular fractions did not result in NO2− release comparable to that observed in homogenate (Figure 5a). However, a distinct release of NO2− was observed in the cytoplasm. As shown in Figure 5b, the release of NO2− in subcellular fractions was limited by the availability of GSH which definitely dropped down during preparation procedures. Determination of GSH levels was performed in all fractions. Cytoplasm contained the highest level of GSH, but the stoichiometry to GTN was in favor of the latter (Figure 5b). Addition of GSH to GTN-supplemented cytoplasm resulted in a drastic increase of NO2− release, approaching rates observed in the homogenate. None of the other fractions transformed GTN to NO2− with a rate comparable to that of homogenate and cytoplasm to which GSH was added.
Figure 5.
(a) Effect of GSH on the NO2− release from GTN in the presence of rat liver homogenate or subcellular fractions: opened bars – without GSH; closed bars–with 2.5 mM GSH. (b) GSH concentrations in liver homogenate and subcellular fractions. Abbreviations: LH–liver homogenate; HMT–heavy mitochondria; LMT–light mitochondrial fraction (includes lysosomes and peroxisomes); MS–microsomal fraction (endoplasmic reticulum); CYT–cytoplasm. Experimental conditions for NO2− detection were as indicated in Figure 3. The subcellular fractions were taken in accordance with protein concentrations as shown in Table 1. §Not significant; *significant to the corresponding LH values (P< 0.007), n=5.
Relative rate of NO2− and NO release in cytoplasm
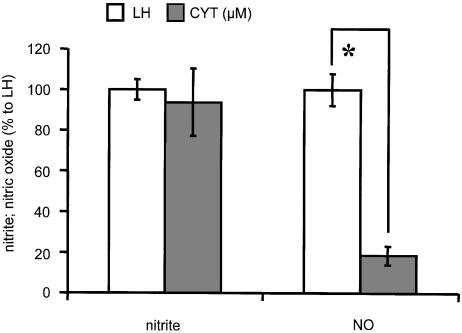
Although NO2− was readily released at relatively high rates from GTN in GSH-containing cytoplasm (Figure 5), the rate of NO release in cytoplasm was rather low as compared to homogenates (Figure 6). This indicates that NO2− and NO are formed in different subcellular compartments.
Figure 6.
The comparison of release rates of NO and NO2− from GTN in liver homogenate and cytoplasm. Experimental conditions were as indicated in Figure 4. Liver homogenate (LH) and cytoplasm (CYT) were taken in accordance with protein concentrations as shown in Table 1. *P<0.0001, n=5 for CYT; n=10 for LH.
Release of NO from GTN and NO2− in subcellular fractions
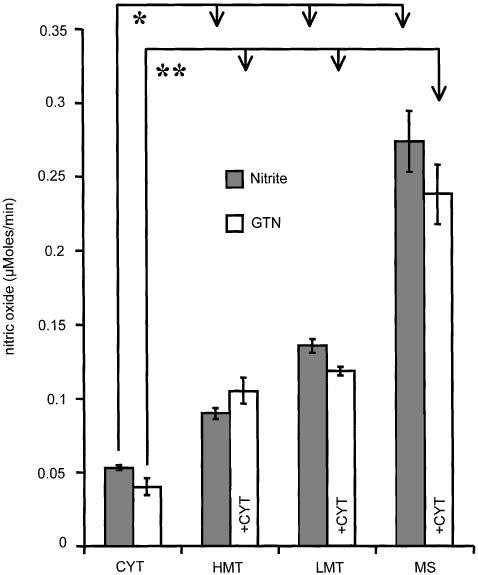
Incubation of subcellular fractions with inorganic NO2− revealed that both mitochondria and microsomes are able to reduce NO2− to NO, but the capacity of microsomes was higher (Figure 7, closed bars). In another set of experiments, we added successively light and heavy mitochondria, and also microsomes to the cytoplasm, in order to functionally assign the cooperative activity of these fractions to the metabolic pathway by which NO is ultimately formed from GTN (Figure 7 open bars). It can be seen (compare Figure 7 closed and opened bars) that both mitochondrial and microsomal fractions facilitate NO generation from NO2− and also from GTN in the presence of cytoplasm (Figure 7).
Figure 7.
The release rates of NO from GTN and from NO2− in the presence and absence of cytoplasm, respectively. Experimental conditions for NO detection were as indicated in Figure 2. The samples contained the following substances: 2.5 mM GSH, 0.5 mM NADPH, 0.5 mM NADH, 0.2 mM GTN, 0.6 mM Hb, and either 0.2 mM NO2− (closed bars) or 0.2 mM GTN (open bars). Abbreviations are indicated in Figure 5. *P<0.002; **P<0.003, n=5.
Effect of NADPH as a substrate for microsomal NO formation from GTN-derived NO2− in cytoplasm
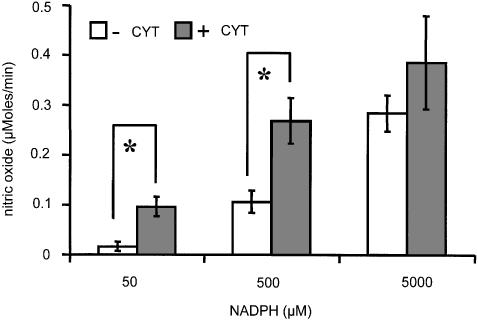
To get insight into the mechanism by which cytochrome P-450 generates NO from GTN, we incubated microsomes with different amounts of NADPH, a cytochrome P-450 substrate, in the presence and in the absence of cytoplasm. Figure 8 shows that at low NADPH concentrations NO is only formed when both cytoplasm and microsomes are present. However, at higher concentrations of NADPH exceeding physiological levels, the presence of cytoplasm was not critical.
Figure 8.
Effect of NADPH and cytoplasm on the release of NO from GTN by endoplasmic reticulum. Open and closed bars are used for samples without and with cytoplasm, respectively. Experimental conditions for NO detection were as indicated in Figure 2, except that GTN concentration was 40 μM, and NADPH was added at the concentrations as indicated. *P<0.01.
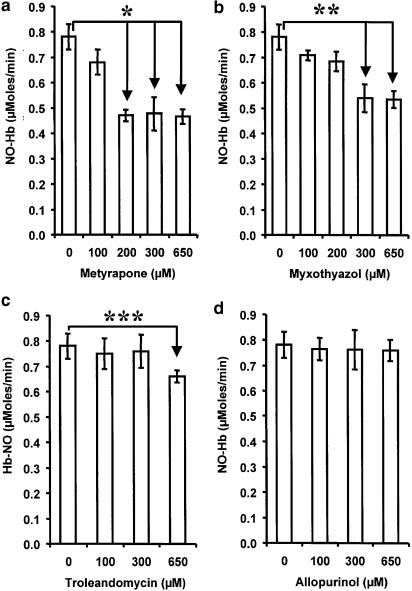
Effect of inhibitors of xanthine oxidoreductase (allopurinol), mitochondrial respiration (myxothiazol), and cytochrome P-450 (metyrapone, troleandomycin) on NO release from GTN in liver homogenate
The results presented in Figure 9 show that increasing concentrations of metyrapone, myxothiazol, and troleandomycin inhibit the release of NO from GTN. In contrast, allopurinol did not influence NO production at various concentrations. Metyrapone had the strongest effect.
Figure 9.
Effects of metyrapone (a), myxothiazol (b), troleandomycin (c), and allopurinol (d) on NO release from GTN in rat liver homogenate. Experimental conditions were as indicated in Figure 2. All samples contained enzyme substrates at the following concentrations: 2.5 mM GSH, 0.5 mM NADPH, and 0.5 mM NADH. The inhibitors were solved in DMSO, control samples contained the same amount of DMSO but without inhibitors. *P<0.004; **P<0.02; ***P<0.002; n=5.
Discussion
Our data suggest that biotransformation of GTN in the liver involves the release of NO2− as the first metabolic step followed by the transformation to NO
The assumption that NO2− is an intermediate in GTN biotransformation in liver has been recently suggested by our group (Kozlov et al., 2002). Some months later, our suggestion was supported by an article of Chen et al. (2002) who found that NO2− is an obligate intermediate in the generation of NO from GTN in aorta rings. Chen et al. observed that mitochondrial aldehyde dehydrogenase catalyzes the transformation of GTN to NO2−. The transformation of NO2− to NO was, however, not studied by Chen et al. The assumption that mitochondria catalyze the second step of GTN transformation is based on the recent publication of our group, where we demonstrated that the bc1 complex of mitochondria is able to reduce NO2− to NO (Kozlov et al., 1999). In the present study, we have found that cytochrome P-450 catalyzes the transformation of NO2− to NO as well. The latter mechanism was not considered by Chen et al.
Consequently, it is not clear whether mitochondria or other subcellular structures are responsible for biotransformation of NO2− to NO in aorta rings. In the present study, we have shown that NO2− generation from GTN occur prior to NO generation, indicating that NO2− is a precursor of NO and not its oxidation product (see Figure 2) as earlier suggested (Salvemini et al., 1993). It was earlier reported that the generation of NO from NO2− proceeds faster at low pH values (Zweier et al., 1995,1999). Under our experimental conditions (pH=6.3), we observed a higher rate for NO formation but lower rates for NO2− generation as compared to physiological pH values (Figure 3). This suggests that at pH 6.3 an additional portion of NO2− has been transformed to NO. Another fact earlier reported in the literature is the stimulating effect of reducing biomolecules in the transformation of NO2− to NO (Vanin et al., 1977; Kozlov et al., 1999). This may explain our finding that both NADPH and NADH promote NO formation at the expense of NO2− (Figure 4). Our data elicit that NO2− is derived both from the metabolic transformation of GTN to NO and as the oxidation product of the latter.
The relatively fast formation of NO2− from GTN and a much slower generation of NO occurring simultaneously (see Figure 2) may be explained on the following basis. The NO release from GTN includes quick transformation of GTN to NO2− as the first step and a slow transformation of NO2− to NO as the second step. Consequently, the formation of NO from NO2− is not a function of NO2− concentration when an excess of NO2− is present. This explains, in particular, increasing NO production at times in which NO2− levels are stable (Figure 2). This is also supported by our observation that stimulation of NO2− release from GTN in the presence of GSH remains without effect on NO generation kinetics (Figure 4). Since both NO2− release from GTN and NO2− transformation to NO are enzymatically catalyzed, the respective enzymes are expected to significantly differ in their Km and Vmax values.
NO2− release from GTN in liver requires the presence of cytoplasmic enzymes (tentatively glutathione-S-transferase)
The reaction of organic nitrate esters with constituents of the tissue was earlier described to yield inorganic NO2− (Hunter Jr & Ford, 1955; Needleman & Hunter Jr, 1976) and attributed to the activity of glutathione-S-transferase, an enzyme comprising a number of isoenzymes and localized in the cytoplasmic fraction of liver cells (Keen et al., 1976; Taylor et al., 1989). It has been earlier suggested that GSH alone is able to initiate GTN biotransformation (Feelish et al., 1988), while 4 years later the same group reported that GSH alone does not initiate GTN biotransformation (Schroder, 1992). The data concerning the involvement of glutathione-S-transferases in GTN transformation are equivocal. The main contradiction is that inhibitors of glutathione-S-transferases clearly reduce the release of both NO2− (Hill et al., 1992) and glyceryldinitrate (Delaforge et al., 1993; Simon et al., 1993,1996; Nigam et al., 1996) release from GTN, but do not always affect the activity of guanylyl cyclase as expected. There are some reports that glutathione-S-transferase inhibitors attenuate cGMP levels and vasodilatation (Simon et al., 1996; Matsuzaki et al., 2002), but more data in the literature claim that inhibitors of glutathione-S-transferases do not influence cGMP levels and vasodilatation (Schroder, 1992; Salvemini et al., 1993; Yuan et al., 1997). It is becoming clear from our studies that glutathione-S-transferase alone is not able to activate guanylyl cyclase because it transforms GTN only to NO2−. Further reduction of NO2− to NO requires cytochrome P-450 or mitochondria. Moreover, the transformation of NO2− to NO but not the transformation of GTN to NO2− is the rate-limiting step in GTN activation in liver. This fact explains also why glutathione-S-transferase inhibitors are not efficient inhibitors which also prevent GTN-dependent guanylyl cyclase activation.
Both endoplasmic reticulum and mitochondria are involved in the transformation of NO2− to NO in liver
Our experiments with subcellular fractions demonstrated that both microsomal and mitochondrial fractions are able to catalyze the transformation of NO2− to NO (Figure 7). The involvement of mitochondrial fraction has already been demonstrated; moreover, it has been shown that the bc1 complex is responsible for the NO2− transformation to NO (Kozlov et al., 1999; Nohl et al., 2000). Similar results were obtained by testing respective enzyme inhibitors in liver homogenate (Figure 9). We used myxothiazol, an inhibitor of NO2− transformation in mitochondria, two cytochrome P-450 inhibitors, metyrapone and troleandomycin selective towards CYP2B and CYP3A, respectively, and an inhibitor of xanthine oxidoreductase, allopurinol. These experiments show that metyrapone, myxothiazol, and troleandomycin partially inhibit NO release. Troleandomycin, however, had an effect only at very high concentrations, which may be explained on the basis of a nonspecific effect. These data suggest that CYP2B of cytochrome P-450 and bc1 complex of mitochondria are responsible for the second step of GTN transformation, in terms of reduction of NO2− to NO.
Two pathways of GTN transformation at cytochrome P-450
Figure 8 shows that there are two mechanisms of GTN bioactivation operating at cytochrome P-450. Under physiological conditions (low NADPH concentration), NO release from GTN requires both cytoplasm and microsomes. First NO2− is released in the cytoplasm, then NO2− diffuses to the endoplasmic reticulum and is reduced to NO by cytochrome P-450. At higher NADPH levels, both pathways may be equally active. At high nonphysiological concentrations of NADPH, GTN can be reduced to NO without the involvement of cytoplasm. Alternatively, NADPH effects can be explained by approaching a Vmax in terms of cytochrome P-450-mediated NO2− reduction. However, both mechanisms are not relevant for in vivo conditions due to low physiological NADPH levels in the living cells.
Xanthine oxidoreductase is not involved in GTN metabolism in liver
Xanthine oxidoreductase has recently been reported to catalyze the anaerobic reduction of GTN to inorganic NO2− using xanthine or NADH as reducing substrates (Millar et al., 1998; Doel et al., 2001). Our data demonstrate that NADH facilitates the transformation of NO2− to NO. Xanthine oxidoreductase can be excluded to be involved in the transformation of NO2− to NO. One argument supporting this assumption is the fact that xanthine oxidoreductase is located in the cytoplasm, whereas the transformation of NO2− to NO proceeds in mitochondrial and microsomal fractions. The second reason is that allopurinol, an inhibitor of xanthine oxidoreductase, has no effect on NO release from GTN (Figure 9). It is more likely that NADH stimulates GTN bioactivation via mitochondria, because NADH is also a mitochondrial substrate.
Biological relevance of the pathway of GTN transformation in liver
Our data presented in this study are in unison with a recent report of Chen et al. Both, Chen's paper and our data suggest that NO2− is an intermediate in the biotransformation of GTN both in aorta and liver. It is likely that bioactivation of GTN takes place in aorta rings and GTN deactivation in liver. This means that both activation and breakdown of GTN include NO2− as an intermediate. The reasonable question is why in aorta such transformation of GTN results in vasodilatation, while it has no effect in the liver or during direct NO2− infusion in blood. We assume that in organs where GTN is activated via the release of NO2− from GTN and subsequent reduction to NO, those metabolic steps are located in the same subcellular compartment (like mitochondria in aorta as reported by Chen et al.), so that nearly all NO2− formed from GTN is immediately transformed into NO. In liver where GTN breakdown takes place, these two steps occur at different subcellular structures. The reaction GTN→NO2− takes place in the cytoplasm and NO2−→NO in the mitochondria or endoplasmic reticulum. Consequently, we propose that in liver the main part of NO2− formed from GTN diffuses back into the blood and only a small part of NO2− reaches the mitochondria or cytochrome P-450 being transformed to NO. This could explain the lack of a physiological response to GTN in liver. One cannot exclude that NO levels are also reduced by complementary mechanisms operating in the liver. In blood, NO2− cannot be activated to NO due to the lack of both cytochrome P-450 and mitochondria. This explains why infusions of NO2− have a poor vasorelaxation effect.
Acknowledgments
We thank Dr B. Fink and Professor E. Bassenge for stimulating discussion on the mechanisms of GTN activation at the Freiburg University (Germany) and P. Martinek and G. Marik for assistance in carrying out a number of experiments. This study was partially supported by FWF grant (Austria).
Abbreviations
- CYT
cytoplasm
- EPR
electron paramagnetic resonance
- GSH
glutathione
- GTN
glycerol trinitrate nitroglycerin
- Hb
hemoglobin
- HMT
heavy mitochondrial fraction
- LH
liver homogenate
- LMT
light mitochondrial fraction
- MS
microsomal fraction
- NADH
nicotinamide adenine dinucleotide
- NADPH
nicotinamide adenine dinucleotide phosphate
- NO
nitric oxide, nitric monoxide
- NO2−
nitrite
- NO-Hb
nitrosyl complex of hemoglobin
References
- AHLNER J., ANDERSSON R.G., TORFGARD K., AXELSSON K.L. Organic nitrate esters: clinical use and mechanisms of actions. Pharmacol. Rev. 1991;43:351–423. [PubMed] [Google Scholar]
- BRIGGS L.A., PRITSOS C.A. Relative contributions of mouse liver subcellular fractions to the bioactivation of mitomycin C at various pH levels. Biochem. Pharmacol. 1999;58:1609–1614. doi: 10.1016/s0006-2952(99)00254-3. [DOI] [PubMed] [Google Scholar]
- CERESER C., GUICHARD J., DRAI J., BANNIER E., GARCIA I., BOGET S., PARVAZ P., REVOL A. Quantitation of reduced and total glutathione at the femtomole level by high-performance liquid chromatography with fluorescence detection: application to red blood cells and cultured fibroblasts. J. Chromatogr. B Biomed. Sci. Appl. 2001;752:123–132. doi: 10.1016/s0378-4347(00)00534-x. [DOI] [PubMed] [Google Scholar]
- CHEN Z., ZHANG J., STAMLER J.S. Identification of the enzymatic mechanism of nitroglycerin bioactivation. Proc. Natl. Acad. Sci. U.S.A. 2002;99:8306–8311. doi: 10.1073/pnas.122225199. [DOI] [PMC free article] [PubMed] [Google Scholar]
- DE DUVE C. Microbodies in the living cell. Sci. Am. 1983;248:74–84. doi: 10.1038/scientificamerican0583-74. [DOI] [PubMed] [Google Scholar]
- DELAFORGE M., SERVENT D., WIRSTA P., DUCROCQ C., MANSUY D., LENFANT M. Particular ability of cytochrome P-450 CYP3A to reduce glyceryl trinitrate in rat liver microsomes: subsequent formation of nitric oxide. Chem. Biol. Interact. 1993;86:103–117. doi: 10.1016/0009-2797(93)90115-f. [DOI] [PubMed] [Google Scholar]
- DOEL J.J., GODBER B.L., EISENTHAL R., HARRISON R. Reduction of organic nitrates catalysed by xanthine oxidoreductase under anaerobic conditions. Biochim. Biophys. Acta. 2001;1527:81–87. doi: 10.1016/s0304-4165(01)00148-9. [DOI] [PubMed] [Google Scholar]
- FEELISH M., NOACK E., SCHRODER H. Explanation of the discrepancy between the degree of organic nitrate decomposition, nitrite formation and guanylate cyclase stimulation. Eur. Heart. J. 1988;9 Suppl A:57–62. doi: 10.1093/eurheartj/9.suppl_a.57. [DOI] [PubMed] [Google Scholar]
- FUNG H.L., CHUNG S.J., BAUER J.A., CHONG S., KOWALUK E.A. Biochemical mechanism of organic nitrate action. Am. J. Cardiol. 1992;70:4B–10B. doi: 10.1016/0002-9149(92)90588-p. [DOI] [PubMed] [Google Scholar]
- GOW A.J., LUCHSINGER B.P., PAWLOSKI J.R., SINGEL D.J., STAMLER J.S. The oxyhemoglobin reaction of nitric oxide. Proc. Natl. Acad. Sci. U.S.A. 1999;96:9027–9032. doi: 10.1073/pnas.96.16.9027. [DOI] [PMC free article] [PubMed] [Google Scholar]
- GOW A.J., STAMLER J.S. Reactions between nitric oxide and haemoglobin under physiological conditions. Nature. 1998;391:169–173. doi: 10.1038/34402. [DOI] [PubMed] [Google Scholar]
- HARRISON D.G., BATES J.N. The nitrovasodilators. New ideas about old drugs. Circulation. 1993;87:1461–1467. doi: 10.1161/01.cir.87.5.1461. [DOI] [PubMed] [Google Scholar]
- HASEGAWA K., TANIGUCHI T., TAKAKURA K., GOTO Y., MURAMATSU I. Possible involvement of nitroglycerin converting step in nitroglycerin tolerance. Life Sci. 1999;64:2199–2206. doi: 10.1016/s0024-3205(99)00171-x. [DOI] [PubMed] [Google Scholar]
- HENRY Y., LEPOIVRE M., DRAPIER J.C., DUCROCQ C., BOUCHER J.L., GUISSANI A. EPR characterization of molecular targets for NO in mammalian cells and organelles. FASEB J. 1993;7:1124–1134. doi: 10.1096/fasebj.7.12.8397130. [DOI] [PubMed] [Google Scholar]
- HILL K.E., HUNT R.W., JR, JONES R., HOOVER R.L., BURK R.F. Metabolism of nitroglycerin by smooth muscle cells. Involvement of glutathione and glutathione S-transferase. Biochem. Pharmacol. 1992;43:561–566. doi: 10.1016/0006-2952(92)90579-8. [DOI] [PubMed] [Google Scholar]
- HUNTER F.E., JR, FORD L. Nitrite formation by enzymatic reaction of mannitol hexanitrate with glutathione. J. Pharmacol. Exp. Ther. 1955;113:186–191. [PubMed] [Google Scholar]
- KEEN J.M., HABIG W.H., JACOBY W.B. Mechanism of the several activities of the glutathione-S-transferases. J. Biol. Chem. 1976;251:6183–6188. [PubMed] [Google Scholar]
- KOHNO M., MASUMIZU T., MORI A. ESR demonstration of nitric oxide production from nitroglycerin and sodium nitrite in the blood of rats. Free Radic. Biol. Med. 1995;18:451–457. doi: 10.1016/0891-5849(94)00165-g. [DOI] [PubMed] [Google Scholar]
- KOZLOV A.V., BINI A., IANNONE A., ZINI I., TOMASI A. Electron paramagnetic resonance characterization of rat neuronal nitric oxide production ex vivo. Methods Enzymol. 1996;268:229–236. doi: 10.1016/s0076-6879(96)68025-2. [DOI] [PubMed] [Google Scholar]
- KOZLOV A.V., DIETRICH B., NOHL H. Metabolism of glycerol trinitrate to nitric oxide in liver includes two steps and involves two intracellular compartments. Naunyn Schmiedeberg's Arch. Pharmacol. 2002;365:11. [Google Scholar]
- KOZLOV A.V., STANIEK K., NOHL H. Nitrite reductase activity is a novel function of mammalian mitochondria. FEBS Lett. 1999;454:127–130. doi: 10.1016/s0014-5793(99)00788-7. [DOI] [PubMed] [Google Scholar]
- KURZ M.A., BOYER T.D., WHALEN R., PETERSON T.E., HARRISON D.G. Nitroglycerin metabolism in vascular tissue: role of glutathione S-transferases and relationship between NO and NO2− formation. Biochem. J. 1993;292:545–550. doi: 10.1042/bj2920545. [DOI] [PMC free article] [PubMed] [Google Scholar]
- MATSUZAKI T., SAKANASHI M., NAKASONE J., NOGUCHI K., MIYAGI K., KUKITA I., ANIYA Y. Effects of glutathione S-transferase inhibitors on nitroglycerin action in pig isolated coronary arteries. Clin. Exp. Pharmacol. Physiol. 2002;29:1091–1095. doi: 10.1046/j.1440-1681.2002.03776.x. [DOI] [PubMed] [Google Scholar]
- MCCORD J.M. Oxygen-derived free radicals in postischemic tissue injury. N. Engl. J. Med. 1985;312:159–163. doi: 10.1056/NEJM198501173120305. [DOI] [PubMed] [Google Scholar]
- MILLAR T.M., STEVENS C.R., BENJAMIN N., EISENTHAL R., HARRISON R., BLAKE D.R. Xanthine oxidoreductase catalyses the reduction of nitrates and nitrite to nitric oxide under hypoxic conditions. FEBS Lett. 1998;427:225–228. doi: 10.1016/s0014-5793(98)00430-x. [DOI] [PubMed] [Google Scholar]
- MINAMIYAMA Y., TAKEMURA S., AKIYAMA T., IMAOKA S., INOUE M., FUNAE Y., OKADA S. Isoforms of cytochrome P450 on organic nitrate-derived nitric oxide release in human heart vessels. FEBS Lett. 1999;452:165–169. doi: 10.1016/s0014-5793(99)00612-2. [DOI] [PubMed] [Google Scholar]
- NEEDLEMAN P., HUNTER F.E., JR Organic nitrate metabolism. Ann. Rev. Pharmacol. Toxicol. 1976;16:81–93. doi: 10.1146/annurev.pa.16.040176.000501. [DOI] [PubMed] [Google Scholar]
- NIGAM R., ANDERSON D.J., LEE S.F., BENNETT B.M. Isoform-specific biotransformation of glyceryl trinitrate by rat aortic glutathione S-transferases. J. Pharmacol. Exp. Ther. 1996;279:1527–1534. [PubMed] [Google Scholar]
- NOHL H., STANIEK K., SOBHIAN B., BAHRAMI S., REDL H., KOZLOV A.V. Mitochondria recycle nitrite back to the bioregulator nitric monoxide. Acta Biochim. Pol. 2000;47:913–921. [PubMed] [Google Scholar]
- PARKER J.D., PARKER J.O. Nitrate therapy for stable angina pectoris. N. Engl. J. Med. 1998;338:520–531. doi: 10.1056/NEJM199802193380807. [DOI] [PubMed] [Google Scholar]
- SALVEMINI D., PISTELLI A., MOLLACE V., ANGGARD E., VANE J. The metabolism of glyceryl trinitrate to nitric oxide in the macrophage cell line J774 and its induction by Escherichia coli lipopolysaccharide. Biochem. Pharmacol. 1992;44:17–24. doi: 10.1016/0006-2952(92)90032-e. [DOI] [PubMed] [Google Scholar]
- SALVEMINI D., PISTELLI A., VANE J. Conversion of glyceryl trinitrate to nitric oxide in tolerant and non-tolerant smooth muscle and endothelial cells. Br. J. Pharmacol. 1993;108:162–169. doi: 10.1111/j.1476-5381.1993.tb13457.x. [DOI] [PMC free article] [PubMed] [Google Scholar]
- SCHRODER H. Cytochrome P-450 mediates bioactivation of organic nitrates. J. Pharmacol. Exp. Ther. 1992;262:298–302. [PubMed] [Google Scholar]
- SERVENT D., DELAFORGE M., DUCROCQ C., MANSUY D., LENFANT M. Nitric oxide formation during microsomal hepatic denitration of glyceryl trinitrate: involvement of cytochrome P-450. Biochem. Biophys. Res. Commun. 1989;163:1210–1216. doi: 10.1016/0006-291x(89)91106-6. [DOI] [PubMed] [Google Scholar]
- SIMON W.C., ANDERSON D.J., BENNETT B.M. Inhibition of the pharmacological actions of glyceryl trinitrate after the electrophoretic delivery of a glutathione S-transferase inhibitor. J. Pharmacol. Exp. Ther. 1996;279:1535–1540. [PubMed] [Google Scholar]
- SIMON W.C., RAPTIS L., PANG S.C., BENNETT B.M. Comparison of liposome fusion and electroporation for the intracellular delivery of nonpermeant molecules to adherent cultured cells. J. Pharmacol. Toxicol. Methods. 1993;29:29–35. doi: 10.1016/1056-8719(93)90048-j. [DOI] [PubMed] [Google Scholar]
- TAYLOR I.W., IOANNIDES C., PARKE D.V. Organic nitrate reductase: reassessment of its subcellular localization and tissue distribution and its relationship to the glutathione transferases. Int. J. Biochem. 1989;21:67–71. doi: 10.1016/0020-711x(89)90028-1. [DOI] [PubMed] [Google Scholar]
- TSUCHIYA K., TAKASUGI M., MINAKUCHI K., FUKUZAWA K. Sensitive quantitation of nitric oxide by EPR spectroscopy. Free Radic. Biol. Med. 1996;21:733–737. doi: 10.1016/0891-5849(96)00221-3. [DOI] [PubMed] [Google Scholar]
- VANIN A.F., KILADZE S.V., KUBRINA L.N. Factors influencing formation of dinitrosyl complexes of non-heme iron in the organs of animals in vivo. Biofizika. 1977;22:850–855. [PubMed] [Google Scholar]
- YUAN R., SUMI M., BENET L.Z. Investigation of aortic CYP3A bioactivation of nitroglycerin in vivo. J. Pharmacol. Exp. Ther. 1997;281:1499–1505. [PubMed] [Google Scholar]
- ZWEIER J.L., SAMOUILOV A., KUPPUSAMY P. Non-enzymatic nitric oxide synthesis in biological systems. Biochim. Biophys. Acta. 1999;1411:250–262. doi: 10.1016/s0005-2728(99)00018-3. [DOI] [PubMed] [Google Scholar]
- ZWEIER J.L., WANG P., SAMOUILOV A., KUPPUSAMY P. Enzyme-independent formation of nitric oxide in biological tissues. Nat. Med. 1995;1:804–809. doi: 10.1038/nm0895-804. [DOI] [PubMed] [Google Scholar]


