Abstract
This study investigated the possibility that adenosine receptors modulate the α1-adrenoceptor-mediated contractility of human cultured prostatic stromal cells (HCPSC).
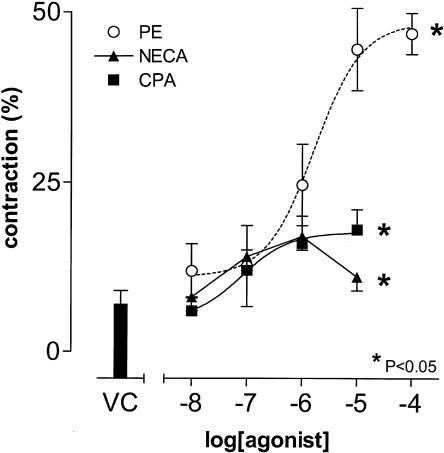
The nonselective adenosine receptor agonist, 5′-N-ethylcarboxamido-adenosine (NECA; 10 nM–10 μM), and the A1 adenosine receptor selective agonist, cyclopentyladenosine (CPA; 10 nM–10 μM), elicited significant contractions in HCPSC, with maximum contractile responses of 18±3% and 17±2% reduction in initial cell length, respectively.
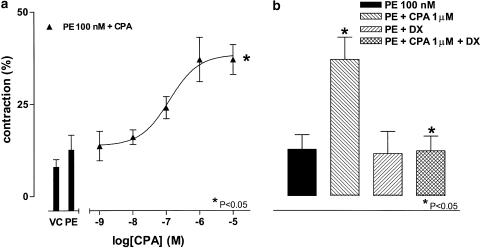
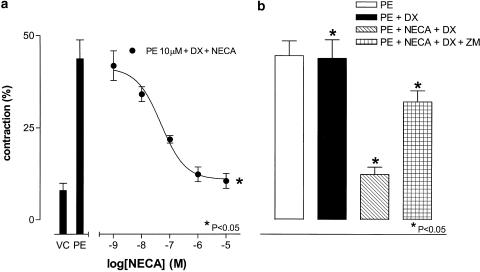
In the presence of a threshold concentration of phenylephrine (PE) (100 nM), CPA (1 nM–10 μM) caused contractions, with an EC50 of 124±12 nM and maximum contractile response of 37±4%. The A1 adenosine receptor-selective antagonist 8-cyclopentyl-1,3-dipropylxanthine (DPCPX 100 nM) blocked this effect. In the presence of DPCPX (100 nM), NECA (1 nM–10 μM) inhibited contractions elicited by a submaximal concentration of PE (10 μM), with an IC50 of 48±2 nM. The A2A adenosine receptor-selective antagonist 4-(2-[7-amino-2-{furyl}{1,2,4}triazolo{2,3-α}{1,3,5,}triazin-5-yl amino]ethyl)phenol (Zm241385 100 nM) blocked this effect.
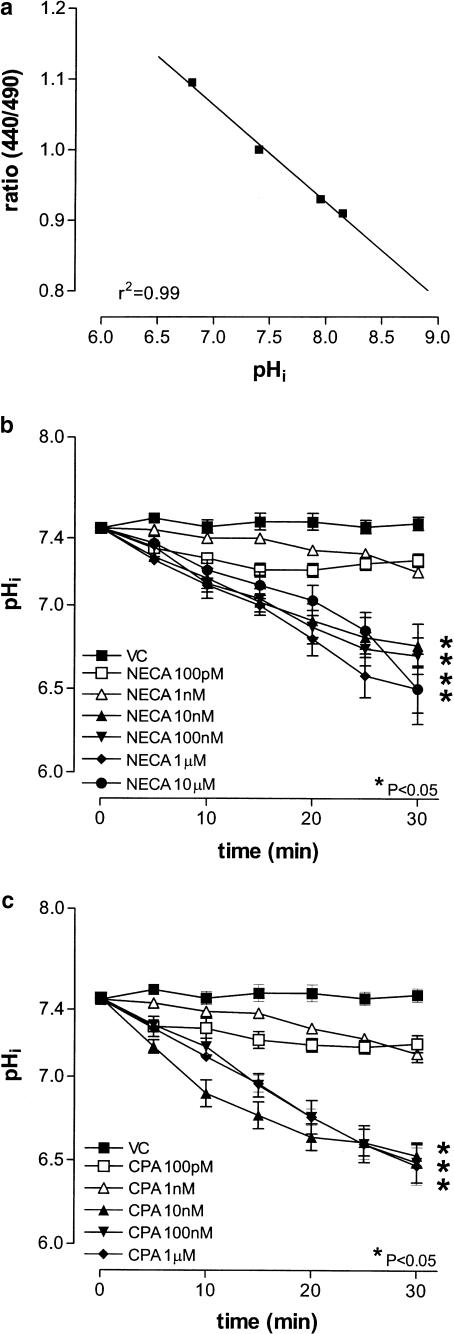
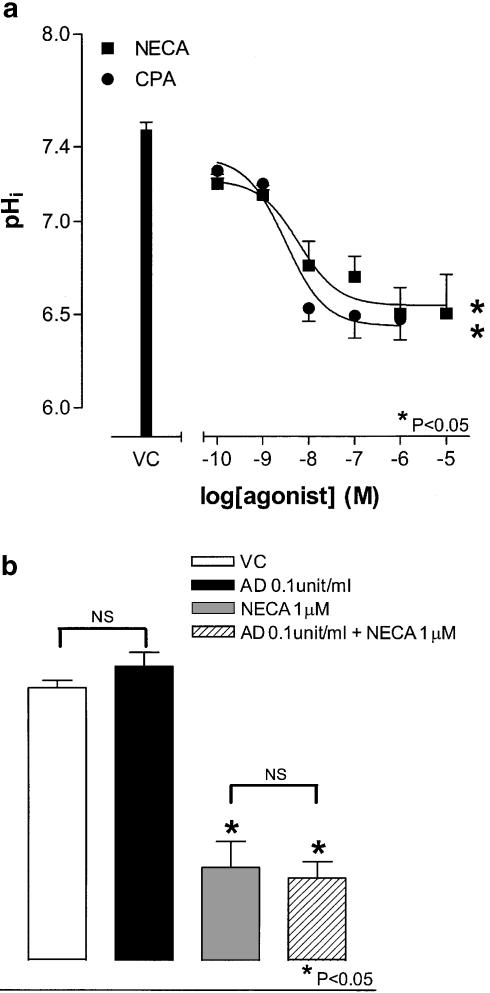
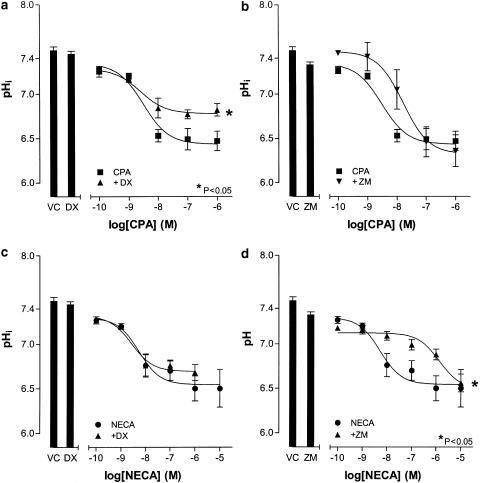
In BCECF-AM (10 μM)-loaded cells, both CPA (100 pM–1 μM) and NECA (100 pM–10 μM) elicited concentration-dependent decreases in intracellular pH (pHi), with EC50 values of 3.1±0.3 and 6.0±0.3 nM, respectively. The response to NECA was blocked by Zm241385 (100 nM; apparent pKB of 9.4±0.4), but not by DPCPX (100 nM). The maximum response to CPA was blocked by DPCPX (100 nM), and unaffected by Zm241385 (100 nM).
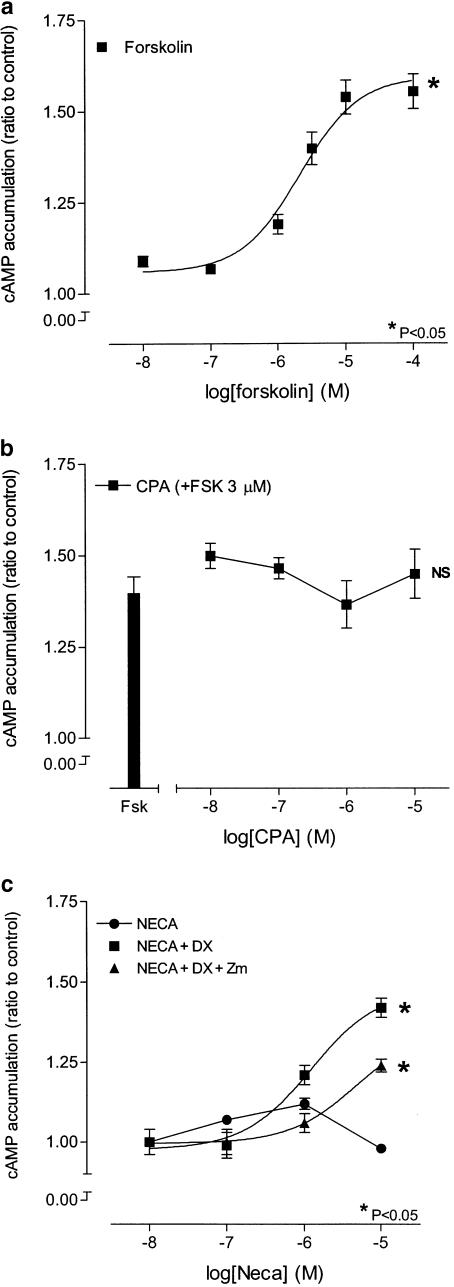
NECA (10 nM–10 μM) alone did not increase [3H]-cAMP in HCPSC. In the presence of DPCPX (100 nM), NECA (10 nM–10 μM) caused a concentration dependent increase in [3H]-cAMP, with an EC50 of 1.2±0.1 μM. This response was inhibited by Zm241385 (100 nM). CPA (10 nM–10 μM) had no effect on cAMP, in the presence or absence of forskolin (1 μM).
These findings are consistent with a role for adenosine receptors in the modulation of adrenoceptor-mediated contractility in human prostate-derived cells.
Keywords: A1 adenosine receptor, A2A adenosine receptor, cAMP, human cultured prostatic stromal cells, pH
Introduction
Previous studies from this laboratory have demonstrated that human cultured prostatic stromal cells (HCPSC) exhibit many of the characteristics of human prostatic tissue (Haynes et al., 2001; Cook et al., 2002; Preston & Haynes, 2003). Namely, that HCPSC express functional α1-adrenoceptors capable of mediating cellular contraction, and that such contractile responses are blocked by α1-adrenoceptor selective antagonists (Preston & Haynes, 2003), by L-type Ca2+ channel blockers (Haynes et al., 2001; Preston & Haynes, 2003) and by activation of K+ channels (Cook et al., 2002). These findings are consistent with studies of human acutely dissociated and cultured prostatic stromal cells (Eckert et al., 1995; Corvin et al., 1998) and whole tissue (Hieble et al., 1985; Lepor et al., 1991; Lepor et al., 1993; Marshall et al., 1995).
The endogenous purine adenosine has been shown to play a role in the modulation of various cellular functions including smooth muscle contraction and/or relaxation (Farmer et al., 1988; Haynes et al., 1998a,1998b; Ford & Broadley, 1999; Haynes et al., 1999; Sawmiller et al., 1996; Prentice et al., 2002; Talukder et al., 2002), and K+ channel conductance (Hadjkaddour et al., 1996; Gopalakrishnan et al., 1999; Haynes, 2000; Marian et al., 2002). Although four G-protein-coupled adenosine receptors have currently been identified, A1, A2A, A2B and A3 (Fredholm et al., 2000; Klotz, 2000; Fredholm et al., 2001), the vast majority of functional responses are mediated by the A1 and A2A adenosine receptors, coupled to Gi and Gs, respectively (Fredholm et al., 2000). In urogenital tissues, the presence of A1 and A2 adenosine receptors has been variously established in the rat (Haynes, 2000; Preston et al., 2000) and guinea-pig (Haynes et al., 1998a,1998b). In these systems, prejunctional A1 adenosine receptors inhibit electrically evoked contractile responses in the isolated rat prostate via inhibition of noradrenaline release (Preston et al., 2000), while A2 adenosine receptors studied on rat epididymal smooth muscle inhibit α1-adrenoceptor-mediated contractile responses (Haynes, 2000). In contrast, postjunctional A1 adenosine receptors in the guinea-pig vas deferens and cauda epididymis potentiate α1-adrenoceptor-mediated contractile responses (Haynes et al., 1998b). Similar results have been shown in other systems including guinea-pig aorta (Ford & Broadley, 1999), cat oesophageal smooth muscle cells (Shim et al., 2002), mouse heart, aorta and carotid artery (Prentice et al., 2002; Talukder et al., 2002) and rat myocardial tissue (Sawmiller et al., 1996).
In contrast to animal studies, there is very little evidence of adenosine receptor presence or function in the human prostate. In this study, we now determine whether functional adenosine receptors exist on HCPSC, and use the previously demonstrated contractile response to α1-adrenoceptor agonists in these cells to investigate the possibility that prostatic adenosine receptors modulate α1-adrenoceptor-mediated contractility.
Methods
Human prostatic tissue
Human prostatic tissue was obtained from patients (mean age 68 years) undergoing transurethral resection of the prostate to treat benign prostatic hyperplasia (BPH). Immediately following surgery, tissue was immersed in MCDB 131 medium containing penicillin (50 IU ml−1) and streptomycin (50 μg ml−1). The tissue was then chopped into 1–2 mm2 pieces in preparation for explant culture.
Primary explant cell culture
Initially, cells were grown on tissue culture dishes in MCDB 131 medium supplemented with foetal calf serum (10% v v−1), HEPES (10 mM), penicillin (50 IU ml−1) and streptomycin (50 μg ml−1) at 37°C (under 5% CO2). Both epithelial and stromal cells grew from the primary explant cultures. Following the first passage, however, the epithelial cells failed to reattach to the culture flask and were thus discarded. After the first passage, cells were grown in MCDB 131 medium supplemented as above, with the addition of insulin (5 μg ml−1), MEM-EAGLE solution of nonessential amino acids (2% v v−1), and ether-stripped horse serum (10% v v−1) was substituted for the foetal calf serum (Zhang et al., 1997). Prior to use, confluent cells were detached from the tissue culture vessel (using trypsin 10% in versene). Cells were plated into tissue culture-treated dishes and incubated in MCDB containing bovine serum albumin (BSA) (0.1% w v−1) (SF) for 48–96 h. To minimise the effect of phenotypic change during long-term culture, cells were not used after passage 6. Using monoclonal antibodies to smooth muscle myosin and prolyl-4-hydroxylase, our primary cell cultures have been shown to contain a mixed population of mainly smooth muscle cells, myofibroblasts and fibroblasts (Haynes et al., 2002).
Contractility studies
As described previously (Preston & Haynes, 2003), confluent cells were trypsinised and plated into 24-well plates coated with cell-tak® (5 μg cm−1, Becton Dickinson Inc., U.S.A.) as reported by Corvin et al. (1998), and incubated in SF media for 48 h. On the day of use, cells were washed with HEPES buffer (mM: NaCl 145; KCl 5; MgSO4 1; HEPES 10; D-glucose 10; CaCl2 2.5) at 37°C, pH 7.4, containing BSA (0.1% w v−1), and were then kept in 1 ml of this buffer for the duration of the experiment. Cells were viewed on an Olympus IX70 microscope, and video images were obtained with a Sony CCD-IRIS monochrome video camera attached to the microscope. Recording and analysis of images was via Metamorph® (Universal Imaging, U.S.A.). Fields of view were selected such that a minimum of five cells was clearly distinguishable at × 20 magnification. Once selected, a series of images were taken at 2 min intervals and a single concentration of agonist or vehicle was added after 10 min, with images acquired for a further 30–40 min. Antagonists and blockers were added to the cells 45–60 min prior to the equilibration period. Contractions were measured from the single cell providing the greatest response. Initial cell length was measured before agonist addition, and final cell length measured after 30 min exposure to the agonist. These results were then expressed as percentage reduction in initial cell length (i.e. percentage contraction).
Intracellular pH (pHi) imaging studies
Confluent cells were trypsinised (as above), plated onto 9.2 cm2. culture dishes and incubated in SF media for 48 h. The fluorophore BCECF (Molecular Probes, U.S.A.) was diluted in HEPES buffer to a final concentration of 10 μM. Cells were incubated with the BCECF solution for 10 min at room temperature and washed twice before a final incubation for 30 min in HEPES buffer at 37°C (to remove the acetoxymethylester). Cells were viewed with a Nikon TE2000 microscope equipped with a Sensicam (PCO, GmbH) low-light camera. A Lambda-DG4 lamp and filter set (Sutter Instrument Company, U.S.A.) was used to illuminate cells with light at 440 and 490 nm. Cell temperature was maintained at 37°C with a heated microscope stage. MetaFluor® Imaging System (Universal Imaging, U.S.A.) was used to analyse the video images. Cell fluorescence emission at 535 nm was recorded over 5 s exposure every 60 s for the duration of the experiment. A single concentration of agonist was added after 5 min equilibration period, and remained in the well for 30 min. Antagonists and blockers were added to the well 45–60 min prior to drug addition. Average emission ratios were calculated over a 2 min period at 5, 10, 15, 20, 25 and 30 min after agonist addition. These data were standardised as a fraction of the average emission ratio during the 5 min period immediately preceding drug addition. A standard curve was prepared by incubation of cells with the proton ionophore nigericin (25 μM) for 20 min, followed by stepwise addition of a modified HEPES buffer (mM: KCl 150; MgSO4 1.0; HEPES 10; D-glucose 10; CaCl2 2.5) at pH values 6.8, 7.4, 7.95 and 8.15. The values of pHi were calculated from the equation for the constructed standard curve.
cAMP assays
This method is essentially a modification of that of Cooper et al. (1997). Cultured cells were seeded into 24-well culture plates, and when 50–75% confluent, rendered quiescent by incubation in SF media for 48 h. On the day of use, cells were incubated for 4 h in SF media containing [3H]adenine, equivalent to 0.5 μCiwell−1, at 37°C, 95% O2, 5% CO2. This medium was then replaced with fresh SF medum containing the phosphodiesterase inhibitor rolipram (30 μM) along with antagonist drugs where indicated. After 45–60 min, agonist drugs were then added, according to individual protocols, before a further 30 min incubation. The reaction was terminated by the addition of 250 μl of HCl (1 M), and cells were frozen overnight at −70°C. Once thawed, [3H]cAMP was separated out of the samples via anion exchange chromatography, in columns packed with acidic alumina. Free [3H]adenine was removed with 8 ml HCL (5 mM), and total [3H]cAMP eluted with 4 ml of ammonium acetate (100 mM, pH 7.0). Radioactivity was quantified by liquid scintillation counting.
Statistics
All results are presented as mean±s.e.m. from the cells of four to eight individuals (unless otherwise stated). Statistical analysis was performed on the raw data using Prism v3.0 (GraphPad Software, U.S.A.). Regression curves were fitted to concentration–response data with a P<0.05 (one-way ANOVA). For some experiments, data were analysed by one-way ANOVA with a post hoc Dunnett's or Bonferroni's test as appropriate. In all cases, P<0.05 was considered significant. Apparent pKB values were determined using the Gaddum equation:
 |
Drugs and chemicals
Drugs and chemicals used were: adenosine deaminase, phenylephrine (PE), MCDB 131 medium, insulin, nigericin (Sigma, St Louis, U.S.A.). Cyclopentyladenosine (CPA), 8-cyclopentyl-1,3-dipropylxanthine (DPCPX), 5′-N-ethylcarboxamido-adenosine (NECA), 4-(2-[7-amino-2-{furyl}{1,2,4}triazolo{2,3-a}{1,3,5,}triazin-5-yl-amino]ethyl)phenol (Zm241385) (RBI Biochemicals, U.S.A.). 2′,7-bis-(2-carboxyethyl)-5-(and-6)-carboxyfluorescein acetoxymethyl ester (BCECF-AM) (Molecular Probes, U.S.A.). All other chemicals were of analytical grade.
Results
Contractility studies
As shown previously (Preston & Haynes, 2003), HCPSC exhibited very little spontaneous contractile activity. In the absence of any stimulus, cells spontaneously reduced by 8±2% of initial cell length (n=8). This spontaneous activity was unaffected by incubation with either DPCPX (100 nM) or Zm241385 (100 nM).
The nonselective adenosine receptor agonist, NECA (10 nM–10 μM), and the A1 adenosine receptor selective agonist, CPA(10 nM to 10 μM) elicited significant contractions in HCPSC, with maximal contractile responses of 18±3 and 17±2%, respectively (P<0.05, one-way ANOVA, n=6; Figure 1), compared to the maximal response to PE of 47±3% (Figure 1).
Figure 1.
Effects of CPA and NECA on HCPSC contractility. The concentration response curve to PE described previously (Preston & Haynes, 2003) is included for comparison. The results are expressed as percentage reduction in initial cell length (n=5–8).*Significant when compared to vehicle control (VC) (P<0.05; one-way ANOVA).
When applied 10 min before addition of a threshold concentration of PE (100 nM), CPA (10 nM–10 μM) caused significant concentration-dependent contractions, with an EC50 of approximately 124±12 nM and maximal response of 37±4% (P<0.05, Bonferroni's test, n=5; Figure 2a). The A1 adenosine receptor antagonist DPCPX (100 nM) blocked this effect (P<0.05, Bonferroni's test, n=4; Figure 2b).
Figure 2.
Effects of CPA on contractile responses to PE in HCPSC. Panel(a) shows the potentiation of a threshold concentration of PE (100 nM; PE) by CPA (n=6). Panel(b) shows the blockade of the observed potentiation by DPCPX (100 nM; DX) (n=5).*Significant when compared to PE (100 nM; PE) (P<0.05; one-way ANOVA). +Significant when compared to PE (100 nM)+CPA (1 μM) (PE+CPA 1 μM) (P<0.05; Bonferroni's test).
When applied 10 min before addition of a submaximal concentration of PE (10 μM), in the presence of DPCPX (100 nM), NECA (1 nM–10 μM) inhibited the PE -induced contraction, with an IC50 of approximately 48±2 nM (P<0.05, one-way ANOVA, n=6; Figure 3a). The A2A adenosine receptor-selective antagonist Zm241385 (100 nM) blocked this effect (P<0.05, Bonferroni's test, n=5; Figure 3b).
Figure 3.
Effect of NECA on contractile responses to PE in HCPSC. NECA (1 μM), in the presence of DPCPX (100 nM; DX), inhibits the contractile response to a submaximal concentration of PE (10 μM) (n=6). Zm241385 (100 nM; ZM) blocks the observed inhibition of the PE response (n=5). +Significantly different when compared to vehicle control (VC) (P<0.05; Dunnett's test). *Significantly different when compared to PE 10 μM (P<0.05; Bonferroni's test). ⧫Significantly different when compared to PE 10 μM+NECA 1 μM+DPCPX 100 nM (PE+NECA+DPCPX) (P<0.05; Bonferroni's test).
pHi imaging studies
In nigericin (25 μM)-treated cells, fluorescence emission intensity was linear and correlated with pHi (r2=0.99, n=4; Figure 4a). In the absence of any stimulus, HCPSC exhibited very little spontaneous change in pHi (Figure 4b,c). Both CPA (100 pM–1 μM) and NECA (100 pM–10 μM) caused a concentration-dependent decreases in pHi in HCPSC (P<0.05, one-way ANOVA, n=6 for both; Figure 4b,c). At 30 min after agonist addition, the EC50 values of these responses were 3.1±0.3 and 6.0±0.3 nM, respectively (P<0.05, one-way ANOVA, n=6 for both; Figure 5a). The concentration response curve to CPA (100 pM–1 μM) was significantly shifted to the right by DPCPX (100 nM) (P<0.05, two-way ANOVA, n=5; Figure 6a), but not by Zm241385 (100 nM, n=5; Figure 6b). Conversely, the concentration response curve to NECA (100 pM–10 μM) was unaffected by DPCPX (100 nM, n=5; Figure 6c), but significantly shifted to the right by Zm241385 (100 nM) (P<0.05, two-way ANOVA, n=5; Figure 6d), with an apparent pKB of 9.4±0.4. Adenosine deaminase (0.1 U ml−1) had no effect on either basal pHi or the pHi change in response to NECA (1 μM) (n=4; Figure 5b).
Figure 4.
Effects of NECA and CPA on pHi in HCPSC. Cells were incubated with the BCECF-AM (10 μM) prior to the addition of either agonist. Panel (a) shows the constructed standard curve, relating ratio to pHi (n=5). Panel (b) shows mean changes in pHi in response to NECA (n=6). Panel (c) shows mean changes in pHi in response to CPA (n=6). *Significantly different when compared to vehicle control (VC) (P<0.05; one-way ANOVA).
Figure 5.
Effects of NECA and CPA on pHi in HCPSC. Cells were incubated with the BCECF-AM (10 μM) prior to the addition of either agonist. Panel (a) shows the concentration response curves to NECA and CPA, measuring changes in pHi (30 min after agonist addition, n=6). Panel (b) shows the effect of adenosine deaminase (0.1 U ml−1) on the control pHi and the response to NECA (1 μM) (n=4 for both). *Significantly different when compared to vehicle control (VC) (P<0.05; one-way ANOVA). +Significantly different when compared to adenosine deaminase (AD 0.1 .U ml−1) (P<0.05, Bonferroni's test). NS, not significant.
Figure 6.
Effects of DPCPX and Zm241385 on pHi changes elicited by NECA and CPA in HCPSC. Cells were incubated with either DPCPX (100 nM; DX), Zm241385 (100 nM; ZM) or vehicle control (VC) prior to the addition of NECA (100 pM–10 μM) or CPA (100 pM–1 μM). In all cases n=5. Panel (a) shows the effect of DPCPX (100 nM) on the concentration response curve to CPA (100 pM–1 μM). Panel (b) shows the effect of Zm241385 (100 nM) on the concentration response curve to CPA (100 pM–1 μM). Panel (c) shows the effect of DPCPX (100 nM) on the concentration response curve to NECA (100 pM–10 μM). Panel (d) shows the effect of Zm241385 (100 nM) on the concentration response curve to NECA (100 pM–10 μM) +Significantly different when compared to CPA (100 pM–1 μM) (P<0.05; two-way ANOVA). *Significantly different when compared to NECA (100 pM–10 μM) (P<0.05; two-way ANOVA). NS, not significant.
cAMP assays
The diterpene forskolin (10 nM–100 μM) caused a concentration-dependent increase in cAMP accumulation in HCPSC (P<0.05,. one-way ANOVA, n=5; Figure 7a). The response to forskolin (1 μM) was unaffected by CPA (10 nM–10 μM) (n=5; Figure 7b). NECA (10 nM–10 μM) alone was unable to elicit a significant accumulation of cAMP in HCPSC (n=5; figure 7c). In the presence of the A1 adenosine receptor-selective antagonist DPCPX (100 nM), NECA caused a concentration-dependent accumulation of cAMP, with an EC50 of 1.2±0.17 μM (P<0.05, one-way ANOVA, n=5; Figure 7c). Addition of the A2A adenosine receptor-selective antagonist Zm241385 (100 nM) significantly blocked the response to NECA (P<0.05, two-way ANOVA, n=5; Figure 7c).
Figure 7.
Effects of forskolin, CPA and NECA on cAMP accumulation. Panel (a) shows the concentration response curve to forskolin. Panel (b) shows the effect of CPA on the cAMP accumulation elicited by a submaximal concentration of forskolin. Panel (c) shows the effect of NECA in the presence and absence of DPCPX (100 nM; DX) and/or Zm241385 (100 nM; ZM), in human cultured prostatic stromal cells. In all cases n=5. *Significant when compared to vehicle control (VC) (P<0.05; one-way ANOVA). +Significant when compared to NECA+DPCPX (P<0.05; two-way ANOVA). NS, not significant.
Discussion
This study has examined the functional responses of adenosine receptors in cultures of human prostatic stromal cells in modulating changes in pHi and cAMP production, as well as the modulation of α1-adrenoceptor-mediated contractile responses.
In this study, both NECA and CPA alone elicited small, significant contractile responses. These responses to CPA and NECA alone are consistent with evidence in the literature regarding the ability of adenosine analogues to produce small contractions in their own right (Haynes et al., 1998b; Fredholm et al., 2000). In other studies, A1 adenosine receptor activation has been shown to potentiate, and A2 adenosine receptor activation to inhibit, α1-adrenoceptor-mediated contractility (Prentice et al., 1997; Haynes et al., 1998b; Gopalakrishnan et al., 1999; Haynes, 2000; Talukder et al., 2002). In a recent study, we have demonstrated that the α1-adrenoceptor agonist PE elicits contractile responses of HCPSC (Preston & Haynes, 2003). In this study, CPA concentration-dependently potentiated the contractile response to a threshold concentration of PE, an effect abolished by the A1 adenosine receptor-selective antagonist DPCPX. Conversely, in the presence of DPCPX, the nonselective adenosine receptor agonist NECA concentration-dependently inhibited the contractile response to a submaximal concentration of PE and this inhibition was reversed by the A2A adenosine receptor-selective antagonist Zm241385. Taken together, these findings suggest that stimulation of A1 adenosine receptors causes potentiation of, while stimulation of A2A adenosine receptors causes inhibition of, α1-adrenoceptor-mediated contractility. This hypothesis is consistent with our finding that contractile responses to NECA alone were somewhat bell shaped. These observations are also consistent with previous studies using tissues from guinea-pig (Haynes et al., 1998b; Gopalakrishnan et al., 1999), mouse (Talukder et al., 2002) and rat (Prentice et al., 1997; Haynes, 2000).
To confirm the presence of functional adenosine receptor subtypes on HCPSC, we measured changes in pHi, using the fluorophore BCECF (Rink et al., 1982), as a direct indicator of adenosine receptor activation. Microphysiometry studies have established that cellular proton efflux is modulated by various metabolic events, including the activation of G-protein-coupled receptors (McConnell et al., 1992; Ikeda et al., 1999; Kobayashi et al., 2001) and subsequent effects on adenylyl cyclase activity (Ng et al., 1999). This increase in proton efflux is a result of the breakdown of ATP to ADP with the subsequent release of Pi and H+ (McConnell et al., 1992). Thus, in this study, we have measured changes in pHi as a function of cellular metabolism. This provides an additional ‘functional' response of potential value for classification of receptors in cultured cell populations. In this study, both CPA and NECA caused a concentration-dependent reduction in pHi with EC50 values of 3.1±0.2 and 5.2±0.3 nM, respectively. Neither basal pHi nor the pHi response to a maximal concentration of NECA were affected by incubation with adenosine deaminase, suggesting that endogenous adenosine plays no part in the observed responses. This is in contrast to evidence in the literature suggesting that cells and tissues can produce endogenous adenosine under conditions of acidification, or in response to receptor stimulation (Sedaa et al., 1990; McConnell et al., 1992; Shinozuka et al., 1994; Hoque et al., 2000; Kobayashi et al., 2001). Endogenous adenosine may well be produced by HCPSC; however, we believe that the observed lack of effect of endogenous adenosine in HCPSC may be due to the relatively low concentration of adenosine produced by the cells given the volume of buffer that they are incubated in during the experiments.
Interestingly, the EC50 for pHi change by CPA was approximately 40 times less than the EC50 observed for potentiation of PE -induced contractile responses. Similarly, the EC50 for pHi change by NECA was approximately eight times less than the IC50 for inhibition of PE -induced contractions. At present, we believe that these differences in EC50 values are most likely due to the differences between the functional responses measured. The observed change in pHi is a direct result of adenosine receptor activation by a ligand and subsequent energy use via ATP breakdown in the second messenger cascade. In contrast, the observed adenosine receptor-mediated changes in contractile response are the result of interactions between numerous second messenger processes. Thus, the EC50 for pHi changes should effectively be more like a functional measurement of agonist binding to receptor, and should therefore be closer to the radioligand binding Ki value than the EC50 for contractile responses. Upon comparison, our observed EC50 for CPA of 3.1±0.2 nM for pHi change is relatively close to the published Ki of 0.8 nM for CPA acting at A1 adenosine receptors (Smith et al., 1997), in contrast to the EC50 of 124 nM observed for potentiation of α1-adrenoceptor-mediated contractility. Different EC50 values for the same agonist, measured via different functional responses, have also been observed in other systems. For example, in DDT1 MF-2 cells, stimulation of A1 adenosine receptors results in an EC50 of 1.4 nM for inhibition of cAMP accumulation, compared to an EC50 of 7.8 nM for [35S]GTPγS binding (Baker et al., 2000). That the decrease in pHi elicited by CPA was blocked by DPCPX but not by Zm241385 is again indicative of an A1 adenosine receptor response. Similarly, the decrease in pHi elicited by NECA was significantly blocked by Zm241385 with an apparent pKB of 9.4±0.4, but was unaffected by DPCPX. The observed pKB in this system is consistent with that reported in the literature for Zm241385 at A2A adenosine receptors (Ongini et al., 1999; Poucher et al., 1995), indicating a predominance of A2A adenosine receptors mediating the observed response.
Having established the presence of both A1 and A2A adenosine receptors on HCPSC, we further investigated the mechanism by which these receptors operate, by examining their effects on cAMP production. Both the A1 and A2A adenosine receptors are known to modulate adenylyl cyclase activity, with the A1 adenosine receptor coupled negatively to adenylyl cyclase to decrease cAMP production, while the A2A adenosine receptor is coupled positively to adenylyl cyclase to increase cAMP production (Dalziel & Westfall, 1994; Fredholm et al., 2000). The diterpene forskolin elicited a concentration-dependent increase in cAMP accumulation in HCPSC; however, this response was unaffected by CPA. One possible explanation for this finding may be that A1 adenosine receptors are expressed at very low levels in our stromal cell cultures. Thus in this population of cells, A1 adenosine receptor activation cannot appreciably inhibit the forskolin-stimulated cAMP accumulation, resulting in a nonfinding. Alternatively, it is possible that A1 adenosine receptors on HCPSC are coupled, not to adenylyl cyclase, but to phospholipase C, resulting in IP3 and DAG production as has been shown in the smooth muscle cell line DDT1MF-2 (Gerwins & Redholm, 1992; Dickenson & Hill, 1993) and rabbit airway smooth muscle (Abebe & Mustafa, 1998). A third possibility that we considered is that CPA may be acting, not as an A1 adenosine receptor agonist, but as an allosteric modulator of α1-adrenoceptors. However, given our finding that the pHi change in response to CPA is blocked by DPCPX, this latter possibility is fairly remote. Although the majority of literature suggests that the observed potentiation of α1-adrenoceptor contractility is likely to be mediated via reduction of [cAMP]i (Jonzon et al., 1985; Dalziel & Westfall, 1994; Xia et al., 1997; Ferre et al., 1998; Cordeaux et al., 2000; Fredholm et al., 2000), we have not directly established this in HCPSC. However, we think that the negative coupling of A1 adenosine receptors to adenylyl cyclase is more likely than coupling to PLC. This is due to our finding that NECA alone had no significant effect on cAMP accumulation, while in the presence of the A1 adenosine receptor antagonist DPCPX, NECA elicited a concentration-dependent increase in cAMP accumulation. This indicates that NECA is only able to elicit an increase in cAMP by activating A2A adenosine receptors when A1 adenosine receptors are blocked. Thus, when both receptors are available for activation, the increase in cAMP elicited by A2A adenosine receptor activation is cancelled out by an inhibition of cAMP accumulation by A1 adenosine receptor activation.
The finding that in the presence of DPCPX, NECA elicited a concentration-dependent increase in cAMP accumulation is typical of an A2 adenosine receptor coupling positively to adenylyl cyclase (Dalziel & Westfall, 1994; Fredholm et al., 2000). The concentration response curve to NECA, in the presence of DPCPX, was blocked by Zm241385, which is consistent with that previously found of the A2A adenosine receptor subtype (Poucher et al., 1995; Ongini et al., 1999). We think that these findings show that the observed inhibition of α1-adrenoceptor-mediated contractility by A2A adenosine receptor activation is mediated via stimulation of adenylyl cyclase to increase cAMP accumulation in HCPSC.
In summary, this study has shown that HCPSC express functional adenosine receptors of both the A1 and A2A subtypes. Activation of A1 adenosine receptors potentiates the contractile response to α1-adrenoceptor stimulation, an effect that may be linked to inhibition of adenylyl cyclase. Activation of A2A adenosine receptors both inhibits α1-adrenoceptor-mediated contractility and stimulates adenylyl cyclase, indicating that increased cAMP accumulation may be involved in the inhibition of contractility. These findings are consistent with a role for adenosine receptors in the modulation of adrenoceptor-mediated contractility in human prostate-derived cells.
Acknowledgments
We thank the staff of Monash Medical Centre, Moorabbin for their cooperation. This work was approved by the Southern Healthcare Network Human Ethics and Experimentation Committee, and supported by the National Health and Medical Research Council (Grant ID 118611), the MAWA Trust and the William Buckland Foundation.
Abbreviations
- BCECF-AM
2′,7-bis-(2-caroxyethyl)-5-(and-6)-carboxyfluorescein acetoxymethyl ester
- BPH
benign prostatic hyperplasia
- cAMP
adenosine 3′,5′-cyclic monophosphate
- CPA
cyclopentyladenosine
- DPCPX
8-cyclopentyl-1,3-dipropylxanthine
- HCPSC
human cultured prostatic stromal cells
- NECA
5′-N-ethylcarboxamido-adenosine
- PE
phenylephrine
- Zm241385
4-(2-[7-amino-2-{furyl}{1,2,4}triazolo{2,3-α}{1,3,5,}triazin-5-yl amino]ethyl)phenol
References
- ABEBE W., MUSTAFA S.J. A1 adenosine receptor-mediated Ins(1,4,5)P3 generation in allergic rabbit airway smooth muscle. Am. J. Physiol. 1998;275:L990–L997. doi: 10.1152/ajplung.1998.275.5.L990. [DOI] [PubMed] [Google Scholar]
- BAKER S.P., SCAMMELLS P.J., BELARDINELLI L. Differential A(1)-adenosine receptor reserve for inhibition of cyclic AMP accumulation and G-protein activation in DDT(1) MF-2 cells. Br. J. Pharmacol. 2000;130:1156–1164. doi: 10.1038/sj.bjp.0703405. [DOI] [PMC free article] [PubMed] [Google Scholar]
- COOK A.L., FRYDENBERG M., HAYNES J.M. Protein kinase G activation of K(ATP) channels in human-cultured prostatic stromal cells. Cell Signal. 2002;14:1023–1029. doi: 10.1016/s0898-6568(02)00050-5. [DOI] [PubMed] [Google Scholar]
- COOPER J., HILL S.J., ALEXANDER S.P. An endogenous A2B adenosine receptor coupled to cyclic AMP generation in human embryonic kidney (HEK 293) cells. Br. J. Pharmacol. 1997;122:546–550. doi: 10.1038/sj.bjp.0701401. [DOI] [PMC free article] [PubMed] [Google Scholar]
- CORDEAUX Y., BRIDDON S.J., MEGSON A.E., MCDONNELL J., DICKENSON J.M., HILL S.J. Influence of receptor number on functional responses elicited by agonists acting at the human adenosine A(1) receptor: evidence for signaling pathway-dependent changes in agonist potency and relative intrinsic activity. Mol. Pharmacol. 2000;58:1075–1084. doi: 10.1124/mol.58.5.1075. [DOI] [PubMed] [Google Scholar]
- CORVIN S., BOSCH S.T., EDER I., THURNHER M., BARTSCH G., KLOCKER H. Videoimaging of prostatic stromal-cell contraction: an in vitro model for studying drug effects. Prostate. 1998;37:209–214. doi: 10.1002/(sici)1097-0045(19981201)37:4<209::aid-pros1>3.0.co;2-u. [DOI] [PubMed] [Google Scholar]
- DALZIEL H.H., WESTFALL D.P. Receptors for adenine nucleotides and nucleosides: subclassification, distribution, and molecular characterization. Pharmacol. Rev. 1994;46:449–466. [PubMed] [Google Scholar]
- DICKENSON J.M., HILL S.J. Adenosine A1-receptor stimulated increases in intracellular calcium in the smooth muscle cell line, DDT1MF-2. Br. J. Pharmacol. 1993;108:85–92. doi: 10.1111/j.1476-5381.1993.tb13444.x. [DOI] [PMC free article] [PubMed] [Google Scholar]
- ECKERT R.E., SCHREIER U., DRESCHER P., MADSEN P.O., DEROUET H., BECHT E., STEFFENS J., ZIEGLER M. Regulation of prostatic smooth muscle contractility by intracellular second messengers: implications for the conservative treatment of benign prostatic hyperplasia. Urol. Int. 1995;54:6–21. doi: 10.1159/000282685. [DOI] [PubMed] [Google Scholar]
- FARMER S.G., CANNING B.J., WILKINS D.E. Adenosine receptor-mediated contraction and relaxation of guinea-pig isolated tracheal smooth muscle: effects of adenosine antagonists. Br. J. Pharmacol. 1988;95:371–378. doi: 10.1111/j.1476-5381.1988.tb11655.x. [DOI] [PMC free article] [PubMed] [Google Scholar]
- FERRE S., TORVINEN M., ANTONIOU K., IRENIUS E., CIVELLI O., ARENAS E., FREDHOLM B.B., FUXE K. Adenosine A1 receptor-mediated modulation of dopamine D1 receptors in stably cotransfected fibroblast cells. J. Biol. Chem. 1998;273:4718–4724. doi: 10.1074/jbc.273.8.4718. [DOI] [PubMed] [Google Scholar]
- FORD W.R., BROADLEY K.J. Effects of adenosine receptor agonists on induction of contractions to phenylephrine of guinea-pig aorta mediated via intra- or extracellular calcium. Gen. Pharmacol. 1999;33:143–150. doi: 10.1016/s0306-3623(98)00279-1. [DOI] [PubMed] [Google Scholar]
- FREDHOLM B.B., AP I.J., JACOBSON K.A., KLOTZ K.N., LINDEN J. International Union of Pharmacology XXV. Nomenclature and classification of adenosine receptors. Pharmacol. Rev. 2001;53:527–552. [PMC free article] [PubMed] [Google Scholar]
- FREDHOLM B.B., ARSLAN G., HALLDNER L., KULL B., SCHULTE G., WASSERMAN W. Structure and function of adenosine receptors and their genes. Naunyn Schmiedebergs Arch. Pharmacol. 2000;362:364–374. doi: 10.1007/s002100000313. [DOI] [PubMed] [Google Scholar]
- GERWINS P., FREDHOLM B.B. Stimulation of adenosine A1 receptors and bradykinin receptors, which act via different G proteins, synergistically raises inositol 1,4,5-trisphosphate and intracellular free calcium in DDT1 MF-2 smooth muscle cells. Proc. Natl. Acad. Sci. USA. 1992;89:7330–7334. doi: 10.1073/pnas.89.16.7330. [DOI] [PMC free article] [PubMed] [Google Scholar]
- GOPALAKRISHNAN M., WHITEAKER K.L., MOLINARI E.J., DAVIS-TABER R., SCOTT V.E., SHIEH C.C., BUCKNER S.A., MILICIC I., CAIN J.C., POSTL S., SULLIVAN J.P., BRIONI J.D. Characterization of the ATP-sensitive potassium channels (KATP) expressed in guinea pig bladder smooth muscle cells. J. Pharmacol. Exp. Ther. 1999;289:551–558. [PubMed] [Google Scholar]
- HADJKADDOUR K., MICHEL A., LAURENT F., BOUCARD M. Smooth muscle relaxant activity of A1- and A2-selective adenosine receptor agonists in guinea pig trachea: involvement of potassium channels. Fundam. Clin. Pharmacol. 1996;10:269–277. doi: 10.1111/j.1472-8206.1996.tb00306.x. [DOI] [PubMed] [Google Scholar]
- HAYNES J.M. A(2A) adenosine receptor mediated potassium channel activation in rat epididymal smooth muscle. Br. J. Pharmacol. 2000;130:685–691. doi: 10.1038/sj.bjp.0703323. [DOI] [PMC free article] [PubMed] [Google Scholar]
- HAYNES J.M., ALEXANDER S.P., HILL S.J. A1 adenosine receptor modulation of electrically evoked contractions in the bisected vas deferens and cauda epididymis of the guinea-pig. Br. J. Pharmacol. 1998a;124:964–970. doi: 10.1038/sj.bjp.0701909. [DOI] [PMC free article] [PubMed] [Google Scholar]
- HAYNES J.M., ALEXANDER S.P., HILL S.J. A1 and A2 adenosine receptor modulation of contractility in the cauda epididymis of the guinea-pig. Br. J. Pharmacol. 1998b;125:570–576. doi: 10.1038/sj.bjp.0702095. [DOI] [PMC free article] [PubMed] [Google Scholar]
- HAYNES J.M., FRYDENBERG M., MAJEWSKI H. Testosterone- and phorbol ester-stimulated proliferation in human cultured prostatic stromal cells. Cell Signal. 2001;13:703–709. doi: 10.1016/s0898-6568(01)00205-4. [DOI] [PubMed] [Google Scholar]
- HAYNES J.M., IANNAZZO L., MAJEWSKI H. Phorbol ester-induced contractility and Ca2+ influx in human cultured prostatic stromal cells. Biochem. Pharmacol. 2002;64:385–392. doi: 10.1016/s0006-2952(02)01211-x. [DOI] [PubMed] [Google Scholar]
- HAYNES J.M., SELBIE L.A., HILL S.J. Gi-Protein alpha-subunit mRNA antisense oligonucleotide inhibition of Gi-coupled receptor contractile activity in the epididymis of the guinea-pig. Br. J. Pharmacol. 1999;127:85–90. doi: 10.1038/sj.bjp.0702515. [DOI] [PMC free article] [PubMed] [Google Scholar]
- HIEBLE J.P., CAINE M., ZALAZNIK E. In vitro characterization of the alpha-adrenoceptors in human prostate. Eur. J. Pharmacol. 1985;107:111–117. doi: 10.1016/0014-2999(85)90048-2. [DOI] [PubMed] [Google Scholar]
- HOQUE N., COOK M.A., KARMAZYN M. Inhibition of alpha(1)-adrenergic-mediated responses in rat ventricular myocytes by adenosine A(1) receptor activation: role of the K(ATP) channel. J. Pharmacol. Exp. Ther. 2000;294:770–777. [PubMed] [Google Scholar]
- IKEDA K., KOBAYASHI S., SUZUKI M., MIYATA K., YAMADA T., HONDA K. Ca2+ mobilization and activation of extracellular acidification by carbachol in acutely dispersed cells from guinea pig detrusor: Fura 2 fluorometry and microphysiometry using the cytosensor. Life Sci. 1999;65:1569–1577. doi: 10.1016/s0024-3205(99)00402-6. [DOI] [PubMed] [Google Scholar]
- JONZON B., NILSSON J., FREDHOLM B.B. Adenosine receptor-mediated changes in cyclic AMP production and DNA synthesis in cultured arterial smooth muscle cells. J. Cell Physiol. 1985;124:451–456. doi: 10.1002/jcp.1041240314. [DOI] [PubMed] [Google Scholar]
- KLOTZ K.N. Adenosine receptors and their ligands. Naunyn Schmiedebergs Arch. Pharmacol. 2000;362:382–391. doi: 10.1007/s002100000315. [DOI] [PubMed] [Google Scholar]
- KOBAYASHI S., IKEDA K., MIYATA K., YAMADA T., HONDA K. A method for measurement of muscarinic receptor-mediated responses in dissociated single colon longitudinal smooth muscle cells. J. Pharmacol. Toxicol. Methods. 2001;45:199–205. doi: 10.1016/s1056-8719(01)00149-6. [DOI] [PubMed] [Google Scholar]
- LEPOR H., GUP D.I., BAUMANN M., SHAPIRO E. Comparison of alpha 1 adrenoceptors in the prostate capsule of men with symptomatic and asymptomatic benign prostatic hyperplasia. Br. J. Urol. 1991;67:493–498. doi: 10.1111/j.1464-410x.1991.tb15193.x. [DOI] [PubMed] [Google Scholar]
- LEPOR H., TANG R., MERETYK S., SHAPIRO E. Alpha 1 adrenoceptor subtypes in the human prostate. J. Urol. 1993;149:640–642. doi: 10.1016/s0022-5347(17)36170-0. [DOI] [PubMed] [Google Scholar]
- MARIAN T., RUBOVSZKY B., SZENTMIKLOSI A.J., TRON L., BALKAY L., BOROS I., GASPAR R., SZEKELY A., KRASZNAI Z. A1 and A2 adenosine receptor activation inversely modulates potassium currents and membrane potential in DDT1 MF-2 smooth muscle cells. Jpn. J. Pharmacol. 2002;89:366–372. doi: 10.1254/jjp.89.366. [DOI] [PubMed] [Google Scholar]
- MARSHALL I., BURT R.P., CHAPPLE C.R. Noradrenaline contractions of human prostate mediated by alpha 1A- (alpha 1c-) adrenoceptor subtype. Br. J. Pharmacol. 1995;115:781–786. doi: 10.1111/j.1476-5381.1995.tb15001.x. [DOI] [PMC free article] [PubMed] [Google Scholar]
- MCCONNELL H.M., OWICKI J.C., PARCE J.W., MILLER D.L., BAXTER G.T., WADA H.G., PITCHFORD S. The cytosensor microphysiometer: biological applications of silicon technology. Science. 1992;257:1906–1912. doi: 10.1126/science.1329199. [DOI] [PubMed] [Google Scholar]
- NG S.S., PANG R.T., CHOW B.K., CHENG C.H. Real-time evaluation of human secretin receptor activity using cytosensor microphysiometry. J. Cell Biochem. 1999;72:517–527. [PubMed] [Google Scholar]
- ONGINI E., DIONISOTTI S., GESSI S., IRENIUS E., FREDHOLM B.B. Comparison of CGS 15943, ZM 241385 and SCH 58261 as antagonists at human adenosine receptors. Naunyn Schmiedebergs Arch. Pharmacol. 1999;359:7–10. doi: 10.1007/pl00005326. [DOI] [PubMed] [Google Scholar]
- POUCHER S.M., KEDDIE J.R., SINGH P., STOGGALL S.M., CAULKETT P.W., JONES G., COLL M.G. The in vitro pharmacology of ZM 241385, a potent, non-xanthine A2a selective adenosine receptor antagonist. Br. J. Pharmacol. 1995;115:1096–1102. doi: 10.1111/j.1476-5381.1995.tb15923.x. [DOI] [PMC free article] [PubMed] [Google Scholar]
- PRENTICE D.J., KELLY M.D., LEDENT C., HOURANI S.M. Relaxation of the mouse isolated aorta and carotid artery in response to adenosine analogues in genetically modified mice lacking the adenosine A(2A) receptor. Naunyn Schmiedebergs Arch. Pharmacol. 2002;366:127–133. doi: 10.1007/s00210-002-0581-7. [DOI] [PubMed] [Google Scholar]
- PRENTICE D.J., PAYNE S.L., HOURANI S.M. Activation of two sites by adenosine receptor agonists to cause relaxation in rat isolated mesenteric artery. Br. J. Pharmacol. 1997;122:1509–1515. doi: 10.1038/sj.bjp.0701524. [DOI] [PMC free article] [PubMed] [Google Scholar]
- PRESTON A., HAYNES J.M. Alpha(1)-adrenoceptor effects mediated by protein kinase C alpha in human cultured prostatic stromal cells. Br. J. Pharmacol. 2003;138:218–224. doi: 10.1038/sj.bjp.0705021. [DOI] [PMC free article] [PubMed] [Google Scholar]
- PRESTON A., LAU W.A., PENNEFATHER J.N., VENTURA S. Effects of adenine nucleosides and nucleotides on neuromuscular transmission to the prostatic stroma of the rat. Br. J. Pharmacol. 2000;131:1073–1080. doi: 10.1038/sj.bjp.0703652. [DOI] [PMC free article] [PubMed] [Google Scholar]
- RINK T., TSIEN R., POZZAN T. Cytoplasmic pH and free Mg2+ in lymphocytes. J. Cell Biol. 1982;95:189–196. doi: 10.1083/jcb.95.1.189. [DOI] [PMC free article] [PubMed] [Google Scholar]
- SAWMILLER D.R., FENTON R.A., DOBSON J.G., JR Myocardial adenosine A1 and A2 receptor activities during juvenile and adult stages of development. Am. J. Physiol. 1996;271:H235–43. doi: 10.1152/ajpheart.1996.271.1.H235. [DOI] [PubMed] [Google Scholar]
- SEDAA K.O., BJUR R.A., SHINOZUKA K., WESTFALL D.P. Nerve and drug-induced release of adenine nucleosides and nucleotides from rabbit aorta. J. Pharmacol. Exp. Ther. 1990;252:1060–1067. [PubMed] [Google Scholar]
- SHIM J.O., SHIN C.Y., LEE T.S., YANG S.J., AN J.Y., SONG H.J., KIM T.H., HUH I.H., SOHN U.D. Signal transduction mechanism via adenosine A1 receptor in the cat esophageal smooth muscle cells. Cell Signal. 2002;14:365–372. doi: 10.1016/s0898-6568(01)00270-4. [DOI] [PubMed] [Google Scholar]
- SHINOZUKA K., HASHIMOTO M., MASUMURA S., BJUR R.A., WESTFALL D.P., HATTORI K. In vitro studies of release of adenine nucleotides and adenosine from rat vascular endothelium in response to alpha 1-adrenoceptor stimulation. Br. J. Pharmacol. 1994;113:1203–1208. doi: 10.1111/j.1476-5381.1994.tb17125.x. [DOI] [PMC free article] [PubMed] [Google Scholar]
- SMITH A.D., CHEEK D.J., BUXTON I.L., WESTFALL D.P. Competition of adenine nucleotides for a 1,3-[3H]-dipropyl-8-cyclopentylxanthine binding site in rat vas deferens. Clin. Exp. Pharmacol. Physiol. 1997;24:492–497. doi: 10.1111/j.1440-1681.1997.tb01233.x. [DOI] [PubMed] [Google Scholar]
- TALUKDER M.A., MORRISON R.R., MUSTAFA S.J. Comparison of the vascular effects of adenosine in isolated mouse heart and aorta. Am. J. Physiol. Heart Circ. Physiol. 2002;282:H49–57. doi: 10.1152/ajpheart.2002.282.1.H49. [DOI] [PubMed] [Google Scholar]
- XIA Y., FERTEL R.H., WOOD J.D. Suppression of cAMP formation by adenosine in myenteric ganglia from guinea-pig small intestine. Eur. J. Pharmacol. 1997;320:95–101. doi: 10.1016/s0014-2999(96)00881-3. [DOI] [PubMed] [Google Scholar]
- ZHANG J., HESS M.W., THURNHER M., HOBISCH A., RADMAYR C., Cronauer M.V., HITTMAIR A., CULIG Z., BARTSCH G., KLOCKER H. Human prostatic smooth muscle cells in culture: estradiol enhances expression of smooth muscle cell-specific markers. Prostate. 1997;30:117–129. doi: 10.1002/(sici)1097-0045(19970201)30:2<117::aid-pros7>3.0.co;2-l. [DOI] [PubMed] [Google Scholar]


