Abstract
In many cancer patients, 5-fluorouracil (5-FUra) treatment is toxic and even causes death. Nevertheless, all patients are subjected to a standard therapy regimen because there is no reliable way to identify beforehand those patients who are predisposed to 5-FUra-induced toxicity. In this study, we identified the dihydrouracil/uracil (UH2/Ura) ratio in plasma or urine as a potential biomarker reflecting the activity of dihydropyrimidine dehydrogenase (DPD), the rate-limiting enzyme in 5-FUra metabolism.
UH2/Ura ratios were measured by high-performance liquid chromatography tandem triple quadrupole mass spectrometry (HPLC-MS/MS) in both healthy subjects (n=55) and in patients (n=20) diagnosed with grade I/II gestational trophoblastic tumours. In addition, rats (n=18) were used as an animal model to verify a correlation between UH2/Ura ratios and DPD levels in the liver.
A significant circadian rhythm was observed in UH2/Ura ratios in healthy subjects, whereas a disrupted rhythm occurred in cancer patients who were continuously infused with a high dose of 5-FUra. In rats, UH2/Ura ratios, liver DPD levels and PBMC DPD levels showed a definite circadian rhythm. Significant linear correlations with liver DPD levels were demonstrated for plasma UH2/Ura ratios (r=0.883, P<0.01), urine UH2/Ura ratios (r=0.832, P<0.01) and PBMC DPD levels (r=0.859, P<0.01).
The UH2/Ura ratio in biological fluid was significantly correlated with liver DPD levels; hence, this ratio could be a potential biomarker to identify patients with a deficiency in DPD.
Keywords: Dihydrouracil/uracil ratio, circadian rhythm, 5-fluorouracil, dihydropyrimidine dehydrogenase, potential biomarker
Introduction
Intensive 5-fluorouracil (5-FUra) chemotherapy regimes are currently used to treat grade I/II gestational trophoblastic tumours (Yingna et al., 2002), a common malignant disease in China. 5-FUra also shows potential as an effective treatment for patients suffering from cancers of the gastrointestinal tract, breast, head and neck (Milano & Mcleod, 2000; Singh et al., 2002; Chau et al., 2003; Martin et al., 2003). However, 5-FUra-associated toxicities (Beuzeboc et al., 1996; Milano et al., 1999; Delval & Klastersky, 2002; Van Kuilenburg et al., 2003), such as gastrointestinal toxicity, haematological toxicity, neurotoxicity, flu-like symptoms and even death, become more prevalent as the dose is increased, which gives it a narrow therapeutic range, especially in patients with partial or complete dihydropyrimidine dehydrogenase (DPD) deficiency (Lu et al., 1998).
The metabolism of pyrimidines (uracil, thymine, etc.) involves three consecutive steps in humans. DPD (EC 1.3.1.2) is the initial and rate-limiting enzyme responsible for metabolizing pyrimidine to 5,6-dihydropyrimidine. Dihydropyrimidinase (DHP, EC 3.5.2.2) is the second enzyme involved in pyrimidine base degradation, and catalyses the reversible hydrolysis of dihydropyrimidine to form ring-opening metabolites, such as the conversion of 5,6-dihydrouracil to N-carbamyl-β-alanine. β-Ureidopropionase (UP, EC 3.5.1.6), the last of the pyrimidine degradative enzymes, catalyses the metabolism of pyrimidine to its final polar metabolites, β-alanine, ammonia and CO2 (Naguib et al., 1985).
DPD is mainly expressed in the liver, but is also present in such tissues as PBMCs, bone marrow, intestinal mucosa and the spleen (Zhang et al., 1993). 5-FUra is a pyrimidine base, which is initially catabolized to 5-fluoro-dihydrouracil by DPD, as the chemical structure of 5-FUra is similar to that of Ura. Pharmacokinetic data on 5-FUra clearance showed that 60–90% of the 5-FUra administered are metabolized by DPD in the liver (Heggie et al., 1987; Chazal et al., 1996), suggesting that liver DPD is of critical importance in determining 5-FUra toxicity. Thus, measuring liver DPD levels before 5-FUra treatment so that an individual's dose could be adjusted is a possible strategy to reduce 5-FUra-related toxicity. In previous experiments, however, DPD activity was measured in PBMCs instead of the liver (Lu et al., 1993; Etienne et al., 1994), as PBMCs are much more accessible than a liver biopsy. But, the method of detecting PBMC DPD activity was found to be time-consuming and expensive. More importantly, PBMC DPD levels were not significantly correlated to 5-FUra systemic clearance (Milano & Etienne, 1996), casting doubt on the reliability of PBMC DPD levels as a marker for liver DPD levels.
Since 5-FUra and Ura are catabolized by the same pathway, with DPD as the key rate-limiting enzyme, the measurement of Ura and UH2 may provide an estimate of 5-FUra degradation as well as DPD levels, and thereby 5-FUra clearance prior to treatment. Ura exists in the plasma at a basal concentration of between 100 and 300 nM, and this significantly increases when systemic DPD is inhibited (Bi et al., 2000). Thus, Ura concentration could theoretically be a sensitive marker to reflect the variations in DPD levels between individuals. However, the Ura concentration in biological fluids (plasma and urine) can be altered by the consumption of food and beverages containing large amounts of Ura. Also, the Ura concentration in urine has to be normalized to urinary creatinine for DPD evaluation (Assmann & Haas, 1990).
After studying individual optimal therapeutic 5-FUra doses and the correlation between plasma UH2/Ura ratios and 5-FUra pharmacokinetic parameters, Gamelin et al. (1999) speculated that plasma UH2/Ura ratios might be helpful in the identification of patients with partial or complete DPD deficiency, and therefore reduce the risk of 5-FUra toxicity. Unfortunately, gamelin did not provide any experimental evidence to show the relationship between UH2/Ura ratios and DPD levels.
Given the frequent use of 5-FUra in cancer therapies, the clinical significance of measuring DPD in patients who are about to receive 5-FUra treatment, and on the basis that UH2 is the dihydrogenated metabolite of Ura via DPD, we suggest that UH2/Ura ratios in cancer patients prior to and during 5-FUra treatment could be of use as a potential biomarker to evaluate the amount of DPD available to metabolize 5-FUra in vivo. To provide evidence in support of this idea, we (a) determined the variations in UH2/Ura ratios at different time points during the day in both healthy subjects and patients receiving a continuous infusion of 5-FUra, in order to demonstrate circadian rhythms of UH2/Ura ratios in humans; (b) used the rat as a model to show a correlation between UH2/Ura ratios and liver DPD levels. Our results demonstrate the potential value of UH2/Ura ratios as a biomarker for the liver DPD levels. We believe that measurement of UH2/Ura ratios before and/or during 5-FUra treatment would be beneficial, as an individual's dose of 5-FUra could be adjusted and so toxicity could be avoided and the clinical efficacy of 5-FUra treatment improved.
Methods
Subjects and study design
A total of 55 healthy subjects (24 males, 26.6±4.6 years old; 31 females, 53.6±4.4 years old) and 20 female patients (29.7±7.8 years old) were randomly selected from the Clinical Pharmacology Center, Peking Union Medical College Hospital. Prior to the study, hepatic, renal and haematological function tests were performed on all subjects to ensure normal organ function. In all, 20 patients had biopsy-proven gestational trophoblastic tumours, and were receiving 8-h continuous infusions of 5-FUra. All subjects were admitted to the ward after informed consent had been obtained. Standard meals and drinks were supplied during the study period. The 20 patients were administered 5-FUra (30 mg kg−1day−1) from 09:00 h by an ambulatory pump via an intravenous cannula for 8 h, while the healthy subjects received no treatment. The time of awakening was between 06:30 and 07:00 h, and time of retiring was between 21:30 and 22:00 h. Blood samples (5 ml) from 12 randomly selected healthy subjects participating in this study were collected at 07:00, 10:30, 14:30, 16:30, 18:30, 22:30, 01:30 (the following day), and 04:30 h (the following day). Urine samples of all healthy subjects were collected at the following intervals: 09:30–11:30, 11:30–13:30, 13:30–15:30, 15:30–17:30, 17:30–19:30, 19:30–01:30 (the following day), 01:30–04:30 (the following day) and 04:30–09:30 h (the following day). Total volume of urine was recorded. Aliquots (10 ml) of urine were taken and prepared for use. Blood samples (5 ml) were collected from the patients at 09:00, 09:30, 12:00, 15:00, 17:00, 17:10, 17:20 and 18:20 h.
Animals and study design
A total of 18 male Sprague–Dawley rats (7 weeks old, 200±20 g body weight) were obtained and housed three to a cage with free access to food and water. All animals were kept for a minimum of two weeks in artificial light conditions, that is, lights on from 06:00 to 18:00 h, lights off from 18:00 to 06:00 h, so that they adapted to their environment (light–dark cycle). They were fasted 10 h before the experiment. The animals were randomly allocated to six groups (n=3 per group). Each group was killed at a different time of the day (08:00, 12:00, 16:00, 20:00, 24:00 and 04:00 h the following day) by cervical dislocation, in accordance with an approved protocol. Blood, urine and liver were collected for use.
Preparation of urine sample, plasma samples and PBMCs
Urine samples were collected and centrifuged at 1500 × g for 10 min; then the supernatant was stored at −20°C until analysis. Blood samples (5 ml; from humans or rats) were collected in centrifuge tubes containing heparin, and then centrifuged at 1500 × g for 10 min. The upper layer of plasma was isolated and stored at –20°C, while the PBMCs were separated from precipitated blood cells according to reported methods (Chazal et al., 1996). PBMCs were immediately isolated using Histopaque solution after four-fold dilution of blood cells with PBS. PBMCs were then washed twice with PBS and saved in storage buffer (50 mM sodium phosphate buffer containing 20% glycerol) at –80°C until analysis.
Preparation of liver homogenates and PBMC lysates
Prior to removal of the liver, the portal vein was cannulated and the liver was perfused with ice-cold 0.9% sodium chloride. Upon removal, the liver was weighed, and then 100 mg was taken from shocked frozen liver and homogenized in a glass homogenizer on ice. Homogenates were resuspended in 0.8 ml Tris-buffered saline (pH 7.4) and centrifuged at 10,000 × g for 60 min at 4°C. The supernatant was carefully collected and total protein concentration was measured by the Lowry method. The supernatant was then stored at −80°C until use for ELISA. PBMCs (∼107) were homogenized directly in a homogenizer, following centrifugation at 10,000 × g for 60 min.
DPD levels measured by ELISA
The DPD ELISA kit is a photometric method for the quantitative in vitro determination of DPD levels using antibody-coated microtiter plates (MTPs); 100 μl sample solution and 50 μl sample (standards, positive control and homogenates) were added to wells which had been coated with DPD primary antibody. The MTP was covered tightly with adhesive foil and then incubated for 2 h at 37°C on a 200 × g shaker. The MTP was washed with 300 μl washing buffer for 1 min, repeated three times; 150 μl IgG conjugated with horseradish peroxidase was added for 1 h at 20°C and washed; 200 μl of a substrate solution containing 2,2-azino-di-[3-ethylbenzthiazoline sulphonate] diammonium salt (ABTS) was added for 30 min at room temperature, and then absorbance was measured at 415 nm. Standard curves were obtained by plotting known DPD levels against absorbance.
Chemical measurements
The amounts of UH2, Ura and 5-FUra were quantified by HPLC-MS/MS, according to our previously developed analytical method (Jiang et al., 2002). Plasma samples were extracted with ethyl acetate-isopropanol (85 : 15, v v−1) following addition of ammonium sulphate, and then separated on a Discovery Amide C16 column with 3% methanol solution as the mobile phase. Urine samples were centrifuged at 10,000 × g for direct analysis. Mass spectrometry detection was carried out in multiple reaction monitoring (MRM) detection mode. The limits for quantifying Ura, UH2 and 5-FUra were 1, 10 and 1 ng ml−1, respectively.
Materials
All chemicals were obtained from Sigma Chemical Co. (St Louis, MO, U.S.A.), and were of the highest purity available. Solvents were HPLC-reagent grade and were purchased from Fisher Co. (Fair Lawn, NJ, U.S.A.). The ELISA kit for DPD in vitro determination was purchased from Roche Diagnostics Co. (Indianapolis, IN, U.S.A.).
Data analysis
The variations of DPD levels and UH2/Ura ratios in a day were analysed by the single ‘Cosinor' method (Halberg et al., 1972), which fits data to a cosine wave by regression analysis utilizing the method of least squares. Three parameters were measured in this analysis, namely the Mesor (i.e., the rhythm-adjusted mean), amplitude (i.e., maximum or minimum value from the mean) and the acrophase (i.e., the time of maximum or minimum value from a given phase of reference). Correlations between variables were investigated using Pearson's correlation analysis.
Results
Circadian rhythm of UH2/Ura ratios and PBMC DPD levels in humans
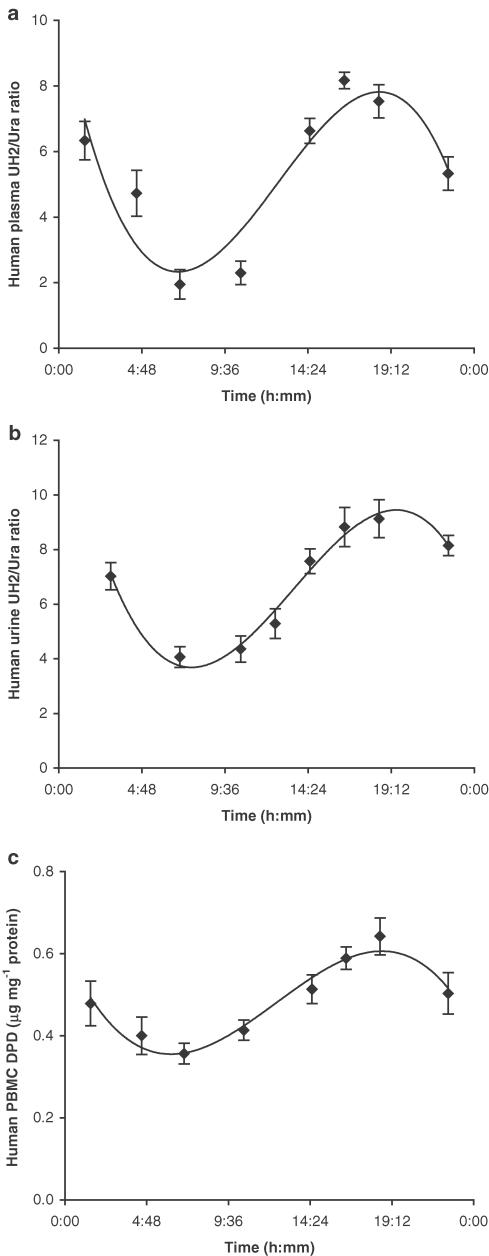
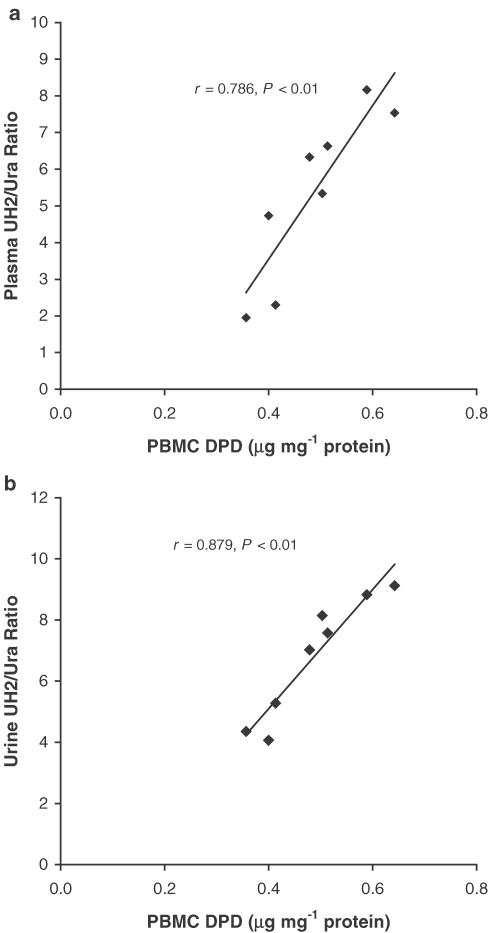
Significant circadian variation was observed in plasma and urine UH2/Ura ratios as well as in PBMC DPD levels (Figure 1). Both UH2/Ura ratios and PBMC DPD levels reached trough values in the early morning, and reached peak value in the evening. The circadian rhythms of UH2/Ura ratios were observed with a maximum value of 7.825±0.981 (mean±s.d.) in plasma and 9.125±0.912 in urine, and a minimum value of 2.323±0.314 in plasma and 3.752±0.412 in urine. The range value exceeded the minimum value by 3.368±0.498-fold in plasma and by 2.432±0.081-fold in urine. The ranges of values for plasma and urine UH2/Ura ratios were similar, but the peak time and the trough time in urine lagged behind those in plasma. ‘Cosinor' analysis of the results (Table 1a) showed that the range of UH2/Ura ratios in plasma was wider than that of PBMC DPD levels, which indicates that the UH2/Ura ratio is a more sensitive marker reflecting DPD circadian variation than PBMC DPD levels. Correlation between UH2/Ura ratios and PBMC DPD levels was verified by Pearson analysis (Figure 2).
Figure 1.
Circadian rhythms of UH2/Ura ratios in human plasma (a, n=12), human urine (b, n=55) and DPD levels in human PBMCs (c, n=12). Time of awakening was between 06:30 and 07:00 h and that of retiring was between 21:30 and 22:00 h. The curves were computer-generated and analysed by ‘Cosinor' analysis, x±s.d.
Table 1.
Single “Cosinor” analysis on circadian variations of (a) UH2/Ura ratios and PBMC DPD levels in healthy subjects; (b) UH2/Ura ratios, liver DPD levels and PBMC DPD levels in rats
| Mesor | Amplitude | r2 | P | Maximum | Minimum | Maximum/minimum | Tmax (h: mm) | Tmin (h: mm) | |
|---|---|---|---|---|---|---|---|---|---|
| (a) | |||||||||
| Human PBMC DPD (μg mg−1 protein) | 0.488±0.052 | 0.124±0.072 | 0.848 | <0.01 | 0.612±0.109 | 0.364±0.102 | 1.681±0.141 | 18:48±0:41 | 6:40±0:38 |
| Human plasma UH2/Ura ratio | 5.074±0.642 | 2.751±0.398 | 0.633 | <0.001 | 7.825±0.981 | 2.323±0.314 | 3.368±0.498 | 18:33±0:52 | 6:45±0:41 |
| Human urine UH2/Ura ratio | 6.439±0.762 | 2.687±0.521 | 0.659 | <0.01 | 9.125±0.912 | 3.752±0.412 | 2.432±0.081 | 19:53±0:59 | 7:36±0:39 |
| Mesor | Amplitude | r2 | P | Maximum | Minimum | Maximum/minimum | Tmax (HALO) | Tmin (HALO) | |
| (b) | |||||||||
| Rat liver DPD (μg mg−1 protein) | 3.418±0.213 | 1.533±0.125 | 0.916 | <0.001 | 4.950±0.352 | 1.885±0.142 | 2.626±0.186 | 6:18±0:20 | 18:20±0:23 |
| Rat PBMC DPD (μg mg−1 protein) | 0.531±0.041 | 0.115±0.021 | 0.853 | <0.001 | 0.645±0.042 | 0.416±0.032 | 1.550±0.210 | 6:36±0:33 | 18:40±0:28 |
| Rat plasma UH2/Ura ratio | 0.390±0.048 | 0.185±0.019 | 0.822 | <0.001 | 0.575±0.036 | 0.205±0.020 | 2.805±0.400 | 5:08±0:24 | 17:15±0:32 |
| Rat urine UH2/Ura ratio | 0.294±0.019 | 0.131±0.021 | 0.568 | <0.01 | 0.425±0.031 | 0.163±0.011 | 2.607±0.216 | 4:23±0:28 | 16:37±0:43 |
Mesor: the rhythm-adjusted mean. Amplitude: maximum or minimum value from the mean.
Figure 2.
Linear correlations between human PBMC DPD levels and UH2/Ura ratios in plasma (a) and urine (b) at eight different time points during the day. The mean value at each time point was obtained from 12 randomly selected healthy subjects.
Disrupted rhythm of UH2/Ura ratios during 5-FUra treatment
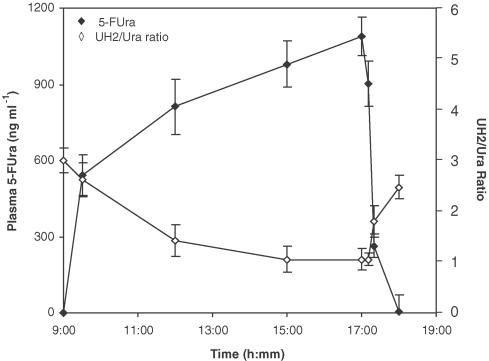
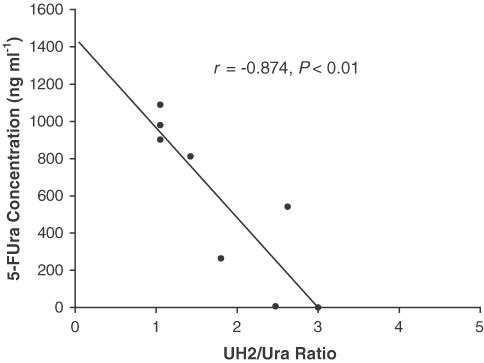
As shown in Figure 3, plasma 5-FUra concentration increased with infusion time and decreased rapidly when infusion was stopped, which shows 5-FUra accumulated in vivo during infusion, and was eliminated very fast (t1/2α ∼15 min). However, the UH2/Ura ratio showed an inverse variation pattern compared to that of 5-FUra concentration, that is, decreasing with the increasing 5-FUra concentration and returning to the basal value when 5-FUra concentration was not detectable. In support of this observation, comparison of UH2/Ura ratios with the corresponding plasma 5-FUra concentrations at the same time point yielded an inverse correlation (r=−0.874, P<0.01, Figure 4).
Figure 3.
Comparison of the variance between 5-FUra concentrations and UH2/Ura ratios in patient plasma. Patients were continuously infused 5-FUra (30 mg kg−1, n=20, x±s.d.) for 8 h starting from 09:00 h, and blood samples were collected at different time points, 09:30, 12:00, 15:00, 17:00, 17:10, 17:20 and 18:20 h.
Figure 4.
Relationship between 5-FUra concentrations and plasma UH2/Ura ratios in the patients administered 5-FUra.
Circadian rhythm of DPD levels and UH2/Ura ratios in rats
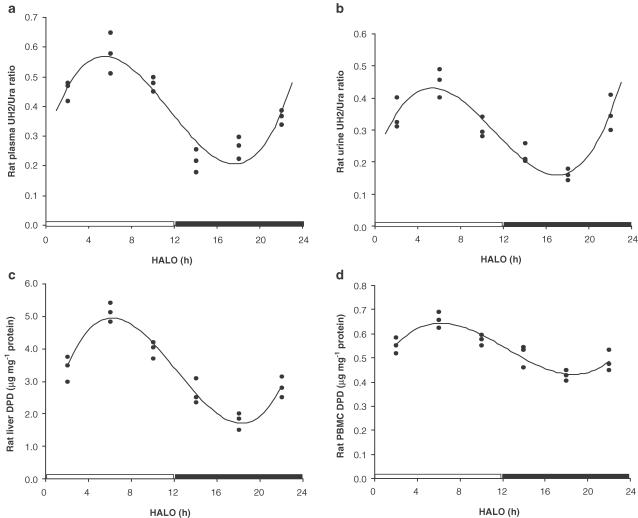
Significant circadian patterns in liver DPD levels, PBMC DPD levels and UH2/Ura ratios in plasma and urine were observed (Figure 5), and proved with ‘Cosinor' analysis (Table 1b). Liver DPD levels were the highest at six HALO (4.950±0.352 μg mg−1 protein) and lowest at 18 HALO (1.885±0.142 μg mg−1 protein), approximately a three-fold difference; PBMC DPD levels were highest at six HALO (0.645±0.042 μg mg−1) and lowest at 18 HALO (0.416±0.032 μg mg−1), a 1.5-fold difference; the UH2/Ura ratio was highest at five HALO in plasma (0.575±0.036) and 4.5 HALO in urine (0.425±0.031), and lowest at 17 HALO (0.205±0.020) in plasma and 16.5 HALO (0.163±0.011) in urine, with a three-fold difference. Interestingly, this rat DPD circadian rhythm exhibits a pattern different from that in human PBMCs.
Figure 5.
Circadian rhythms of UH2/Ura ratios in rat plasma (a), UH2/Ura ratios in rat urine (b) and DPD levels in rat liver(c) and PBMCs (d). Data were obtained from the study in rats under the following conditions: lights on from 06:00 to 18:00 h, and lights off from 18:00 to 06:00 h. Three animals were used for each time point. The curves were computer-generated and analysed by ‘Cosinor' analysis. In order to emphasize the relationship between circadian pattern and light–dark cycle, the data were plotted by setting the abscissa from 0–24 HALO. 0–12 HALO, the period when light was on; 12–24 HALO, the period when lights were off.
Correlation between DPD levels and UH2/Ura ratios
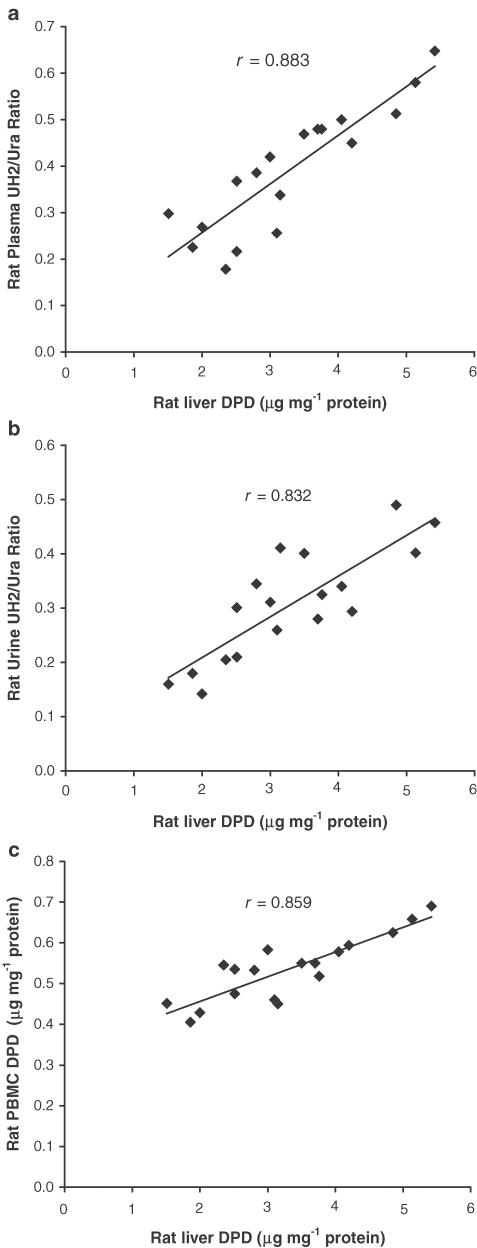
Significant linear correlations with liver DPD levels were demonstrated for plasma UH2/Ura ratios (r=0.883, P<0.01), urine UH2/Ura ratios (r=0.832, P<0.05) and PBMC DPD levels (r=0.859, P<0.01) (Figure 6).
Figure 6.
Linear correlations with rat liver DPD levels for plasma UH2/Ura ratios (a, r=0.883, P<0.01), urine UH2/Ura ratios (b, r=0.832, P<0.05) and PBMC DPD levels (c, r=0.859, P<0.01), n=18.
Discussion
Although 5-FUra treatment induces toxic effects and even death in some cancer patients, all patients are nevertheless placed on standard therapy regimens because it is not possible to identify beforehand those patients who are susceptible to 5-FUra toxicity (Macdonald, 1999). So, screening individuals for sensitive biomarkers relevant to the toxic effects of 5-FUra before treatment could allow selection of an optimal therapeutic scheme for each patient on a rational basis.
To date, an important determinant in predicting the toxicity as well as the efficacy of 5-FUra might be the levels of DPD, the initial and rate-limiting enzyme in the metabolism of pyrimidines including 5-FUra. DPD in the liver metabolizes approximately 85% of the 5-FUra administered, so liver DPD has an important role in, and is relevant to, 5-FUra toxicity. However, it is not feasible to detect DPD levels directly in the liver before treatment. Previous studies have firmly established the existence of a circadian rhythm for DPD levels in rats (Harris et al., 1988; Zhang et al., 1993), mice (Porsin et al., 2003), as well as in cancer patients (Milano & Chamorey, 2002) and healthy subjects (Harris et al., 1990; Barrat et al., 2003). In our study, we successfully verified a similar PBMC DPD circadian rhythm in healthy subjects. In contrast, Grem et al. (1997) failed to demonstrate the existence of a uniform circadian rhythm, although they observed a significant variation of PBMC DPD levels in individuals. However, in their study, results were from only six subjects, which is too small a sample to draw final conclusions. Also, there was less control over standard awaking/retiring times and food eaten during the study, all factors which could influence the circadian rhythm of DPD levels. Nevertheless, the cellular and molecular mechanisms for this circadian rhythm are still unknown. Porsin et al. (2003) obtained significant circadian changes of DPD-mRNA through a 24-h time scale. Also, it has been shown that the rhythmic transcription of clock genes produces rhythmic levels of clock mRNAs that, in turn, produce rhythmic levels of clock proteins (Lakin-Thomas, 2000). So, transcriptional and/or post-transcriptional control of DPD by the circadian clock may be involved.
Meanwhile, we demonstrated for the first time that the UH2/Ura ratio in plasma and urine displays a significant circadian rhythm, which is consistent with the human PBMC DPD circadian pattern. Using a previously established sensitive, specific and accurate HPLC-MS/MS method, we measured the variations in concentrations of Ura and UH2 in human plasma and urine in both healthy subjects and gestational trophoblastic tumour patients who were receiving 5-FUra. In healthy subjects, both Ura and UH2 levels showed a circadian pattern, but a more significant circadian pattern was evident when the results were expressed as a UH2/Ura ratio (Figure 1). In order to verify the reliability of this circadian pattern, we measured UH2/Ura ratios twice in the same healthy subject group (12 males of 55 healthy subjects) on two different test days. The interday variations in the results showed no significant difference (P>0.05) in circadian pattern, which proves the existence of a circadian rhythm in UH2/Ura ratios. In gestational trophoblastic tumour patients receiving 5-FUra, this circadian rhythm was disrupted (Figure 3), with the UH2/Ura ratio decreasing rapidly. Since both Ura and 5-FUra are substrates of DPD, and 5-FUra concentration was much higher than the physiological Ura concentration, we suppose that much more DPD is involved in 5-FUra metabolism than in Ura metabolism. So, Ura accumulates and less UH2 is formed; therefore, the UH2/Ura ratio decreased. The UH2/Ura ratio nearly returned to a normal level when the plasma 5-FUra was totally cleared.
Although Ura is eliminated by two other enzymes following metabolism by DPD, in theory, we do not think that this affects the accuracy of the UH2/Ura ratios, since Ura is an endogenous substance which can maintain a balance in normal physiological situations, unlike other exogenous substances or drugs. So, based on our results and the above analysis, the UH2/Ura ratio would be a sensitive biomarker to reflect liver DPD levels before 5-FUra treatment. We also performed experiments to investigate the correlation between the UH2/Ura ratio and liver DPD levels directly in rats. Although it would have been preferable to do this in human subjects, it is not feasible to determine liver DPD levels in humans.
Significant correlations were obtained between liver DPD levels and UH2/Ura ratios in this study. Previous studies have firmly established the existence of a circadian rhythm for DPD in rat liver and bone marrow (Harris et al., 1988; Zhang et al., 1993). Our study confirmed that such a circadian rhythm exists, and that the UH2/Ura ratio has a similar circadian pattern. The DPD levels in rats were highest at ∼6 HALO and lowest at ∼18 HALO. Interestingly, in human PBMCs, this DPD circadian rhythm has been shown to exhibit a pattern different from that in rat PBMCs. The timing of peak and trough activity in humans is at ∼19:00 h, 12 HALO (supposed 0 HALO=7:00 h, wakening time) and ∼6:30 h, −0.5 HALO. However, on extrapolation of circadian rhythm from rodents to humans, differences in the life cycle of the two species must always be taken into consideration. Rats are nocturnal animals and, therefore, are more active in the dark and less active in the light. Human beings are just the opposite; that is, they are more active in the light and less active in the dark. From the above data, the peak DPD levels in both rats and humans occurred during rest time and the trough during times of activity. This finding is consistent with those of another study by Zhang et al. (1993). They showed that DPD levels have a significant inverse relationship with TK levels, which are correlated with the rate of DNA synthesis. DNA synthesis occurs rapidly during times of activity when the highest TK levels and lowest DPD levels are observed.
A significant correlation between the UH2/Ura ratio and liver DPD levels indicates that this ratio may reflect DPD levels in the liver. In addition, in a clinical study, Gamelin et al. (1999) proved that, after the first course of treatment, the pretreatment UH2/Ura ratios in plasma were highly correlated to 5-FUra plasma concentrations, 5-FUra plasma clearance and an individual's optimal therapeutic 5-FUra dose, all of which indirectly support the idea that premeasurement of UH2/Ura ratios could help to decide 5-FUra clinical treatments.
Thus, the present data have several potentially important implications. Firstly, the UH2/Ura ratio may act as a potential biomarker to evaluate liver DPD levels in cancer patients about to receive 5-FUra treatment, and therefore allow individual optimal 5-FUra doses to be determined. However, a control population should be investigated to determine a threshold for those patients who are prone to toxicity. Secondly, the biological significance of the DPD circadian pattern to 5-FUra for pyrimidine drug treatment is obvious, since the variations in DPD between individuals can result in 5-FUra concentration fluctuations which can be directly correlated with treatment toxicity. So a ‘time-modified' infusion of 5-FUra, according to the DPD rhythm during the day, could minimize the toxic effects of 5-FUra treatment. Therefore, a patient's DPD circadian rhythm would determine the optimum time for the administration of 5-FUra, which would be especially useful when high doses of the drug need to be used.
Acknowledgments
Thanks are due to Dr Yang Xiang, Peking Union Medical College Hospital (PUMCH), for collecting patients, Ms. Yufang Hu, Clinical Pharmacology Research Center, PUMCH, for performance of photometric DPD ELISA assays, and Dr Sridhar Gopishetty and Amy Quinn, for their critical review of the manuscript. Thanks are also due to the patients and their families and volunteer healthy subjects, and the staff of Clinical Pharmacology Research Center ward.
Abbreviations
- DPD
dihydropyrimidine dehydrogenase
- ELISA
enzyme-linked immunosorbent assay
- 5-FUra
5-fluorouracil
- HPLC-MS/MS
high-performance liquid chromatography tandem triple quadrupole mass spectrometry
- MTP
microtiter plate
- PBMCs
peripheral blood mononuclear cells
- UH2/Ura ratios
dihydrouracil/uracil ratios
References
- ASSMANN B., HAAS H.J. Determination of creatinine-related urinary uracil excretion in children by high-performance liquid chromatography. J. Chromatogr. 1990;525:277–285. doi: 10.1016/s0378-4347(00)83404-0. [DOI] [PubMed] [Google Scholar]
- BARRAT M.A., RENEE N., MORMONT M.C., MILANO G., LEVI F. Circadian variations of dihydropyrimidine dehydrogenase (DPD) activity in oral mucosa of healthy volunteers. Pathol. Biol. (Paris) 2003;51:191–193. doi: 10.1016/s0369-8114(03)00035-x. [DOI] [PubMed] [Google Scholar]
- BEUZEBOC P., PIERGA J.Y., LYONNET D.S., COUTURIER J., POUILLAR P. Severe 5-fluorouracil toxicity in a woman treated for breast cancer with concurrent osteogenesis imperfecta and dehydrogenase deficiency. Bull. Cancer. 1996;83:324–327. [PubMed] [Google Scholar]
- BI D., ANDERSON L.W., SHAPIRO J., SHAPIRO A., GREM J.L., TAKIMOTO C.H. Measurement of plasma uracil using gas chromatography-mass spectrometry in normal individuals and in patients receiving inhibitors of dihydropyrimidine dehydrogenase. J. Chromatogr. B. 2000;738:249–258. doi: 10.1016/s0378-4347(99)00528-9. [DOI] [PubMed] [Google Scholar]
- CHAU I., CHAN S., CUNNINGHAM D. Overview of preoperative and postoperative therapy for colorectal cancer: the European and United States perspectives. Clin. Colorectal Cancer. 2003;3:19–33. doi: 10.3816/CCC.2003.n.009. [DOI] [PubMed] [Google Scholar]
- CHAZAL M., ETIENNE M.C., RENEE N., BOURGEON A., RICHELME H., MILANO G. Link between dihydropyrimidine dehydrogenase activity in peripheral blood mononuclear cells and liver. Clin. Cancer Res. 1996;2:507–510. [PubMed] [Google Scholar]
- DELVAL L., KLASTERSKY J. Optic neuropathy in cancer patients. Report of a case possibly related to 5 fluorouracil toxicity and review of the literature. J. Neurooncol. 2002;60:165–169. doi: 10.1023/a:1020613600826. [DOI] [PubMed] [Google Scholar]
- ETIENNE M.C., LAGRANGE J.L., DASSONVILLE O., FLEMING R., THYSS A., RWNEE N., SCHNEIDER M., DEMARD F., MILANO G. Population study of dihydropyrimidine dehydrogenase in cancer patients. J. Clin. Oncol. 1994;12:2248–2253. doi: 10.1200/JCO.1994.12.11.2248. [DOI] [PubMed] [Google Scholar]
- GAMELIN E., BOISDRON-CELLE M., GUERIN-MEYER V., DELVA R., LORTHOLARY A., GENEVIEVE F., LARRA F., IFRAH N., ROBERT J. Correlation between uracil and dihydrouracil plasma ratio, fluorouracil (5-FU) pharmacokinetic parameters, and tolerance in patients with advanced colorectal cancer: a potential interest for predicting 5-FU toxicity and determining optimal 5-FU dosage. J. Clin. Oncol. 1999;17:1105–1110. doi: 10.1200/JCO.1999.17.4.1105. [DOI] [PubMed] [Google Scholar]
- GREM J.L., YEE L.K., VENZON D.J., TAKIMOTO C.H., ALLEGRA C.J. Inter- and intraindividual variation in dihydropyrimidine dehydrogenase activity in peripheral blood mononuclear cells. Cancer Chemother. Pharmacol. 1997;40:117–125. doi: 10.1007/s002800050635. [DOI] [PubMed] [Google Scholar]
- HALBERG F., JOHNSON E.A., NELSON W., RUNGE W., SOUTHERN R. Autorhythmometry procedures for physiologic self-measurements and their analysis. Physiol. Teacher. 1972;1:1–11. [Google Scholar]
- HARRIS B.E., SONG R., SOONG S.J., DIASIO R.B. Relationship between dihydropyrimidine dehydrogenase activity and plasma 5-fluorouracil levels with evidence for circadian variation of enzyme activity and plasma drug levels in cancer patients receiving 5-fluorouracil by protracted continuous infusion. Cancer Res. 1990;50:197–201. [PubMed] [Google Scholar]
- HARRIS B.E., SONG R.L., HE Y.J., SOONG S.J., DIASIO R.B. Circadian rhythm of rat liver dihydropyrimidine dehydrogenase. Possible relevance to fluoropyrimidine chemotherapy. Biochem. Pharmacol. 1988;37:4759–4762. doi: 10.1016/0006-2952(88)90349-8. [DOI] [PubMed] [Google Scholar]
- HEGGIE G.D., SOMMADOSSI J.P., CROSS D.S., HUSTER W.J., DIASIO R.B. Clinical pharmacokinetics of 5-fluorouracil and its metabolites in plasma, urine, and bile. Cancer Res. 1987;47:2203–2206. [PubMed] [Google Scholar]
- JIANG H., JIANG J., HU P., HU Y.F. Measurement of endogenous uracil and dihydrouracil in plasma and urine of normal subjects by liquid chromatography-tandem mass spectrometry. J. Chromatogr. B. 2002;769:169–176. doi: 10.1016/s1570-0232(02)00009-0. [DOI] [PubMed] [Google Scholar]
- LAKIN-THOMAS P.L. Circadian rhythms: new functions for old clock genes. Trends Genet. 2000;16:135–142. doi: 10.1016/s0168-9525(99)01945-9. [DOI] [PubMed] [Google Scholar]
- LU Z., ZHANG R., CARPENTER J.T., DIASIO R.B. Decreased dihydropyrimidine dehydrogenase activity in a population of patients with breast cancer: implication for 5-fluorouracil-based chemotherapy. Clin. Cancer Res. 1998;4:325–329. [PubMed] [Google Scholar]
- LU Z., ZHANG R., DIASIO R.B. Dihydropyrimidine dehydrogenase activity in human peripheral blood mononuclear cells and liver: population characteristics, newly identified deficient patients, and clinical implication in 5-fluorouracil chemotherapy. Cancer Res. 1993;53:5433–5438. [PubMed] [Google Scholar]
- MACDONALD J.S. Toxicity of 5-fluorouracil. Oncology (Huntington) 1999;13 Suppl 3:33–34. [PubMed] [Google Scholar]
- MARTIN M., VILLAR A., SOLE-CALVO A., GONZALEZ R., MASSUTI B., LIZON J., CAMPS C., CARRATO A., CASADO A., CANDEL M.T., ALBANELL J., ARANDA J., MUNARRIZ B., CAMPBELL J., DIAZ-RUBIO E. Doxorubicin in combination with fluorouracil and cyclophosphamide (i.v. FAC regimen, day 1, 21) versus methotrexate in combination with fluorouracil and cyclophosphamide (i.v. CMF regimen, day 1, 21) as adjuvant chemotherapy for operable breast cancer: a study by the GEICAM group. Ann. Oncol. 2003;14:833–842. doi: 10.1093/annonc/mdg260. [DOI] [PubMed] [Google Scholar]
- MILANO G., CHAMOREY A.L. Clinical pharmacokinetics of 5-fluorouracil with consideration of chronopharmacokinetics. Chronobiol. Int. 2002;19:177–189. doi: 10.1081/cbi-120002597. [DOI] [PubMed] [Google Scholar]
- MILANO G., ETIENNE M.C. Individualizing therapy with 5-fluorouracil related to dihydropyrimidine dehydrogenase: theory and limits. Ther. Drug Monit. 1996;18:335–340. doi: 10.1097/00007691-199608000-00004. [DOI] [PubMed] [Google Scholar]
- MILANO G., ETIENNE M.C., PIERREFITE V., BARBERI-HEYOB M., DEPORTE-FETY R., RENEE N. Dihydropyrimidine dehydrogenase deficiency and fluorouracil-related toxicity. Br. J. Cancer. 1999;79:627–630. doi: 10.1038/sj.bjc.6690098. [DOI] [PMC free article] [PubMed] [Google Scholar]
- MILANO G., MCLEOD H.L. Can dihydropyrimidine dehydrogenase impact 5-fluorouracil-based treatment. Eur. J. Cancer. 2000;36:37–42. doi: 10.1016/s0959-8049(99)00211-7. [DOI] [PubMed] [Google Scholar]
- NAGUIB F.N., EL KOUNI M.H., CHA S. Enzymes of uracil catabolism in normal and neoplastic human tissues. Cancer Res. 1985;45:5405–5412. [PubMed] [Google Scholar]
- PORSIN B., FORMENTO J.L., FILIPSKI E., ETIENNE M.C., FRANCOUAL M., RENEE N., MAGNE N., LEVI F., MILANO G. Dihydropyrimidine dehydrogenase circadian rhythm in mouse liver: comparison between enzyme activity and gene expression. Eur. J. Cancer. 2003;39:822–828. doi: 10.1016/s0959-8049(02)00598-1. [DOI] [PubMed] [Google Scholar]
- SINGH B., LI R., XU L., POLURI A., PATEL S., SHAHA A.R., PFISTER D., SHERMAN E., GOBERDHAN A., HOFFMAN R.M., SHAH J. Prediction of survival in patients with head and neck cancer using the histoculture drug response assay. Head Neck. 2002;24:437–442. doi: 10.1002/hed.10066. [DOI] [PubMed] [Google Scholar]
- VAN KUILENBURG A.B., DE ABREU R.A., VAN GENNIP A.H. Pharmacogenetic and clinical aspects of dihydropyrimidine dehydrogenase deficiency. Ann. Clin. Biochem. 2003;40:41–45. doi: 10.1258/000456303321016150. [DOI] [PubMed] [Google Scholar]
- YINGNA S., YANG X., XIUYU Y., HONGZHAO S. Clinical characteristics and treatment of gestational trophoblastic tumor with vaginal metastasis. Gynecol. Oncol. 2002;84:416–419. doi: 10.1006/gyno.2001.6540. [DOI] [PubMed] [Google Scholar]
- ZHANG R., LU Z., LIU T., SOONG S.J., DIASIO R.B. Relationship between circadian-dependent toxicity of 5-fluorodeoxyuridine and circadian rhythms of pyrimidine enzymes: possible relevance to fluoropyrimidine chemotherapy. Cancer Res. 1993;53:2816–2822. [PubMed] [Google Scholar]


