

Abstract
Our previous studies suggest that diets varying in palmitic acid (PA) and oleic acid (OA) content may affect energy expenditure and fat oxidation differentially. We hypothesized that, compared with a high-OA diet, a high-PA diet would lead to lower oxygen consumption during exercise and lower excess postexercise oxygen consumption (EPOC). Adults were randomized to 1 of 2 liquid diets (28 days): HI PA (fat, 40% of energy; PA, 16.8%; OA, 16.4%) (n = 10) or HI OA (fat, 40%; PA, 1.7%; OA, 31.4%) (n = 9). On day 29, the rates of oxygen consumption ( ) and carbon dioxide production were measured during and for 270 minutes after 80 minutes of cycling (60% peak). There was no group difference (HI OA vs HI PA, mean ± SEM) in fat-free mass (53.8 ± 4.7 vs 56.9 ± 3.0 kg), peak (40.7 ± 2.3 vs 36.6 ± 3.2 mL/kg per minute), and work during exercise (101 ± 12 vs 101 ± 10 W). (L/min) during exercise (1.99 ± 0.22 vs 1.85 ± 0.19) was significantly different ( P = .05) only when corrected for fat-free mass, with which it significantly correlated (r = 0.86; P < .001). During 60 to 270 minutes postexercise, the average EPOC was 9.7% ± 4.9% of preexercise in OA, whereas there was no EPOC present in PA ( P = .06 between diets). In conclusion, a high-PA diet appears to lower during and after exercise compared with a high-OA diet.
1. Introduction
Palmitic acid (PA) and oleic acid (OA) are major dietary and storage fatty acids (FA) [1], and the North American diet typically contains approximately equal amounts of PA and OA as percentage of total energy [2–4]. The lipid source for the Mediterranean diet derives mainly from olive oil. Olive oil contains much more OA and much less PA than the major lipid sources in the North American diet (eg, meat and dairy products) [5–7].
There is emerging evidence, from studies in isolated cells, that saturated and unsaturated FA, as well as the genes regulating their metabolism, affect mitochondrial pathways for FA oxidation and energy utilization [8–11]. Because mitochondrial FA oxidation and energy generation may be especially important during states where the demand for energy production is greater (such as physical activity) [12], we have been interested in how alterations in dietary FA composition affect fat oxidation and energy expenditure in humans [13]. Thus, we [13] recently conducted a clinical trial, the results of which suggested that a high-PA formula diet caused decreased fat oxidation and increased body fat gain (per unit of energy intake), compared with a high-OA diet. While this trial [13] was in progress, we began recruiting a cohort of subjects, already participating in this trial, to undergo additional tests to determine whether the diets affected the oxygen consumption associated with an 80-minute, submaximal exercise bout on a bicycle ergometer and whether the diets also affected oxygen consumption after the exercise.
We hypothesized that the dietary FA composition differentially would affect the energy cost of a controlled exercise bout, both during exercise and after exercise.
Commonly, after exercise, there is an extended increase in the rate of oxygen consumption ( ) above resting [14]. This elevated after exercise is termed excess postexercise oxygen consumption (EPOC) and may last for several hours depending on the duration and intensity of the exercise [14,15]. There are a number of readily identifiable mechanisms for the transient EPOC (ie, during the first 60 minutes postexercise) [15,16]. The mechanisms responsible for the prolonged component of EPOC (extending >60 minutes postexercise) are less well understood, but changes in fractional oxidation of substrates [16] as well as increased triglyceride/fatty acid cycling [17–20] have been shown to contribute to this effect. In addition, it has been suggested that changes in gene expression may be a possible mechanism [14].
2. Methods
2.1. Overall design
This randomized, double-masked, controlled trial involved 19 healthy, nonobese young adults, 18 to 35 years old. Each subject consumed a solid-food, “run-in” diet for 28 days and then was randomized to either a PA-enriched (HI PA; fat, 40% of energy; PA, 16.8%; OA, 16.4%) or an OA-enriched (HI OA; fat, 40%; PA, 1.7%; OA, 31.4%) liquid formula diet, also for 28 days. Approximately 1 to 2 weeks before the end of the study period, each subject underwent an exercise test on a bicycle ergometer to establish their peak During 1 of the last 3 days of the formula diet, body composition was assessed using dual-energy x-ray absorptiometry (DXA; Hologic Delphi QDR 4500A Bone Densitometer, Bedford, MA). On day 29, as described in more detail below, the subjects performed an exercise bout consisting of 80 minutes cycling at 60% of peak. Oxygen uptake was measured during the exercise and for 4.5 hours after exercise.
The study was carried out at the University of Texas Medical Branch (UTMB) and the Shriners Hospitals for Children, Galveston, TX. It was approved by the Institutional Review Board for Human Subjects and the General Advisory Committee of the General Clinical Research Center (GCRC) at UTMB.
2.2. Subjects
Many of the subjects were simultaneously participating in a trial to determine the effect of dietary FA on fat oxidation, resting energy expenditure, and total daily energy expenditure; the data on these subjects and the detailed methodology for this trial have been reported separately [13]. However, additional subjects were recruited for the trial for the purpose of completing this exercise study. The subjects were fully informed of the purpose and procedures of the study before written consent was obtained. After initial screening to determine their eligibility, the subjects underwent a medical history and physical examination at the GCRC, and fasting blood samples were drawn to further ascertain their eligibility for the study, based on inclusion and exclusion criteria. The inclusion criteria were the following: ages of 18 to 35 years; healthy and no need for medication on a frequent or continuous basis; body mass index of more than 18 and less than 30, and below the 95th percentile based on norms for age, sex, and race [21]; no current use of drugs that may affect lipid metabolism, including nicotine; a willingness to give up all food and drinks not included in the study diets (including coffee and other caffeinated beverages); and willingness to curtail vigorous aerobic exercise for 72 hours before the exercise study. Exclusion criteria included vegetarian diet; habitual fat intake of less than 30% energy; pregnancy; fasting glucose, total cholesterol, low-density lipoprotein cholesterol, and triglycerides above the 95th percentile, and high-density lipoprotein cholesterol below the 5th percentile for age and gender [22].
2.3. Diets
All food during both phases of the study was provided by the GCRC. All subjects were required to eat breakfast at the GCRC every day of the 8-week study, but many of the subjects chose to eat 1 or more additional meals in our dining room each day, especially during the week.
The main purpose of the run-in, solid-food diet was to serve as a way to determine which subjects would comply with the protocol and to establish baseline control data on all subjects on the same diet. These baseline data were used to characterize changes in various parameters as part of the overall trial. The composition of this solid-food diet was the following: protein, 14.6% energy; carbohydrate, 45.1% energy; fat, 40.8% energy. The FA composition included OA (13.1% energy and 32.4 g/100 g total fat) and PA (8.4% energy and 20.8 g/100 g fat). For comparison, a post hoc analysis of the dietary histories obtained on most of the subjects participating in this trial for the period preceding the run-in diet revealed the following composition of their “habitual diet”: 18.0% energy as protein, 49.6% energy as carbohydrate, 33.0% energy as fat with 11.0% energy as saturated FA, and 11.0% energy as monounsaturated FA. Thus, because it was our intention to examine large intakes of PA or OA, our subjects were ingesting a moderately high-fat intake at the time of their exercise studies.
Table 1 provides details concerning the macronutrient and FA composition of the 2 experimental formula diets (Ross Products Division, Abbott Laboratories, Columbus, OH): (1) HI PA (n = 10), a PA-enriched formula diet, in which PA and OA content were 42.1 and 41.0 g/100 g total FA, respectively; and (2) HI OA (n = 9), an OA-enriched formula diet, which was identical to HI PA except that it had a 91% higher fractional OA concentration and a reciprocally lower concentration of PA. Both formulas contained 40% of energy as fat and, thus, contained slightly more fat than the average American diet [3]. The formulas were patterned after formulas used for nutritional support and contained adequate vitamins and minerals on a per-kilojoule basis. The fat blend in the HI PA formula was 91% palm oil, 6% high oleic sunflower oil, and 3% soy lecithin. The fat blend of the HI OA formula was 0% palm oil, 97% high oleic sunflower oil, and 3% soy lecithin.
Table 1.
Composition of experimental diets
| HI PA | HI OA | |
|---|---|---|
| Energy distribution (%) | ||
| Protein | 14 | 14 |
| Carbohydrate | 46 | 46 |
| Fat | 40 | 40 |
| Fatty acid profile (g/100g) | ||
| Palmitic | 42.1 | 4.2 |
| Oleic | 41.0 | 78.4 |
| Linoleic | 11.4 | 13.0 |
| Stearic | 4.1 | 4.1 |
| α-Linolenic | 0.3 | 0.3 |
| Myristic | 0.9 | 0.0 |
| Palmitoleic | 0.2 | 0.0 |
| Eicosapentaenoic | 0.0 | 0.0 |
| Docosahexaenoic | 0.0 | 0.0 |
| Arachidonic | 0.0 | 0.0 |
| Fatty acid class (%) | ||
| Saturated | 47.1 | 8.3 |
| Monounsaturated | 41.2 | 78.4 |
| Polyunsaturated | 11.7 | 13.3 |
| Fractional energy contribution (%) | ||
| Total saturated | 18.8 | 3.3 |
| 12:0 | 0.0 | 0.0 |
| 14:0 | 0.4 | 0.0 |
| 16:0 | 16.8 | 1.7 |
| 18:0 | 1.6 | 1.6 |
| Total monounsaturated | 16.5 | 31.4 |
| 18:1 n-9 | 16.4 | 31.4 |
| Total polyunsaturated | 4.8 | 5.3 |
| 18:3 n-3 | 0.1 | 0.1 |
| 18:2 n-6 | 4.6 | 5.2 |
2.4. peak Test
Approximately 1 to 2 weeks before the exercise study, while ingesting the formula diet, subjects underwent an exercise test on a bicycle ergometer to establish their peak. The peak test was carried out on a Monark bicycle ergometer (Monark 829, Monark Exercise, Vansbro, Sweden). Briefly, the subjects warmed up for 10 minutes at 25 W. The workload was thereafter increased to 50 Wand then subsequently by 25 or 50 W every 2 minutes depending on their estimated fitness status so as to limit the peak test to approximately 10 minutes. and the rate of carbon dioxide production ( ) were measured by indirect calorimetry (Vmax 29, Sensor Medics, Yorba Linda, CA). This was used for all the metabolic measurements during the study. During the cycling, the subjects breathed through a mouthpiece and valve during the measurement periods. The subjects were determined to have reached peak when the power was increased and no concomitant increase was made in . Heart rate (Polar A1, Polar Electro Oy, Kempele, Finland), ventilation, and respiratory exchange values were also observed to confirm the maximal value. Using linear regression, we estimated the work associated with a 60% peak effort.
2.5. Experimental protocol
On the 29th day of the formula diet period, , , and fat oxidation (respiratory quotient [RQ]) were assessed over a 20-minute period in the fasting state at 07:00 am. A canopy was used with the indirect calorimetry, as this test was included as part of a series of overnight measurements used in the parent trial. The subjects remained in bed in the supine position during the measurements. After the completion of these preexercise resting measurements, the subjects were transported via wheelchair from their bed in the GCRC to the adjacent Shriners Hospital where the exercise study took place. The subjects then underwent the exercise study, using the same cycle ergometer used for the peak test. However, the subjects performed the exercise in a semi-recumbent position, sitting in a chair attached to the cycle instead of the standard seat. Subjects were given a 5-minute warm-up at 30 W. Thereafter, they cycled continuously for 80 minutes at a constant pedaling rate of 70 rpm and at work intensity equal to 60% of their individual peak. This degree of work is thought to generally cause a measurable degree of EPOC, but is low enough that the untrained subjects were all able to finish the exercise [14]. At 15-minute intervals, starting at 15 minutes after commencing exercise, they breathed into the mouthpiece of the calorimeter for 5 minutes, while tidal volume (L/min), , and were measured.
After completion of the exercise bout, the subjects were transported via wheelchair back to the GCRC. The transport of subjects between the GCRC and the exercise unit was accomplished in approximately 5 minutes each way because the exercise unit and GCRC are connected by an inside bridge. Commencing with a measurement at 30 minutes postexercise, indirect calorimetry was performed for 20 minutes out of every 30 minutes for the period 30 to 270 minutes, postexercise, using the same indirect calorimeter (in the canopy mode) used for the fasting, preexercise measurement at 07:00 am. During this period of measurement, the subjects remained in bed and fasting, but they were allowed access to the bathroom located several feet from their bed. Excess postexercise oxygen consumption at each measurement time point was calculated by subtracting the preexercise value from the respective postexercise value; EPOC was then expressed either as liters per minute or as a percentage of the preexercise value. The individual values for the 60- to 270-minute postexercise interval were then averaged.
2.6. Statistical analysis
Results (HI OA vs HI PA) are expressed as mean ± SEM. Linear correlation was used to determine possible covariate effects on the final outcomes, and nonlinear (Spearman rank) correlation as well as graphic analysis was used to confirm the validity of the linear regression analysis. The 2-sample t test was used to compare, between the 2 formula groups, height, body weight, body mass index, body composition, various parameters related to the peak test, and during the exercise test (SPSS Base 10.0, SPSS, Chicago, IL). A repeated-measures analysis of variance was used to evaluate the effect of diet on EPOC and postexercise RQ. The term statistical significance was applied to differences with a 2-tailed P value of .05 or less, but interesting effects with P values of less than .1 are also reported.
3. Results
3.1. Subject characteristics, body composition, and characteristics of the peak test
Table 2 shows the characteristics of the subjects randomly assigned to the 2 groups. Subjects in the HI OA and HI PA groups ranged in age from 22 to 32 and 21 to 34 years, respectively. In the HI OA group, there were 6 males and 3 females. In the HI PA group, there were 6 males and 4 females. At the time of the exercise bout at the end of the formula diet, the 2 diet groups (HI OA vs HI PA) did not significantly differ in the following: age; energy intake during the formula diet; resting energy expenditure during the fed and fasting portion of the overnight calorimetry before the exercise study; fat-free mass (FFM); fat mass; and percentage of body fat. There was a statistically significant ( P = .05), higher body mass index in the HI PA group, postformula but not preformula (Table 2). There was no significant difference between the groups in peak expressed as L/min or mL/kg per minute, respectively, 2.75 ± 0.28 vs 2.76 ± 0.23 ( P = .97) and 40.7 ± 2.3 vs 36.6 ± 3.2 ( P = .31). Thus, on average, both groups were untrained.
Table 2.
Subject characteristics
| Group
|
||
|---|---|---|
| Measurement | HI OA | HI PA |
| Age (y) | 25.3 ± 0.9 | 27.9 ± 3.5 |
| Height (cm) | 170.1 ± 3.9 | 174.2 ± 2.7 |
| Body weight (kg) | 66.7 ± 4.2a | 76.4 ± 2.7 |
| Body mass index (kg/m2) | 22.8 ± 0.7b | 25.2 ± 0.8 |
| FFM (kg) | 53.8 ± 4.7 | 56.9 ± 3.0 |
| Fat mass (kg) | 14.0 ± 1.8 | 20.1 ± 3.0 |
| Percentage of body fat | 21.4 ± 3.0 | 25.8 ± 3.5 |
| peak (L/min) | 2.75 ± 0.28 | 2.76 ± 0.23 |
| peak (mL/kg per minute) | 40.7 ± 2.3 | 36.6 ± 3.2 |
| Energy intake (kJ/kg FFM per day) | 221.3 ± 11.7 | 212.5 ± 9.2 |
Data are expressed as mean ± SEM (n = 9 for HI OA and n = 10 for HI PA). Energy intake (kJ/kg FFM per day) indicates average daily energy intake per day during the formula diet. See text and Table 1 for explanation on HI OA and HI PA.
HI OA vs HI PA: P = .06 (2-sample t test).
HI OA vs HI PA: P = .05 (2-sample t test).
3.2. Exercise test results
There was no significant difference between the groups in workload during the exercise test (101 ± 12 vs 101 ± 10 W) or the average during exercise as a fraction of peak (0.73 ± 0.04 vs 0.66 ± 0.03). during the exercise test, expressed as liters per minute, was not significantly different between groups (1.99 ± 0.22 vs 1.85 ± 0.19) (Table 3). Our subjects were exercising at approximately the same relative intensity of work. However, subjects of different FFM but identical training status will exhibit different values during a bout of exercise. Although there was no significant difference in FFM between groups, the groups did not manifest identical FFM values (Table 2). (L/min) during exercise was linearly related to FFM (r = 0.86, P < .001). Expressed as mL/kg FFM per minute, there was a borderline significant, higher during the exercise test in HI OA (36.8 ± 1.7 vs 31.8 ± 2.0 mL/kg FFM per minute; P = .07, 2-sample t test). However, simply dividing by FFM assumes a zero y-intercept for a linear relationship between FFM and during exercise, and this, often-used approach to correct for metabolic reference standards, could give erroneous conclusions [23]. Thus, we also examined the effect of diet group on during exercise using FFM as a covariate in the general linear model (analysis of covariance). On this basis, (L/min) was higher in the HI OA group compared with the HI PA group ( P = .05). During exercise, RQ was not significantly different between the HI OA group (0.897 ± 0.010) and the HI PA group (0.886 ± 0.010).
Table 3.
Summary of group exercise data
| Group
|
||
|---|---|---|
| Measurement | HI OA | HI PA |
| Exercise (L/min) | 1.99 ± 0.22a | 1.85 ± 0.19 |
| Exercise workload (W) | 101 ± 12 | 101 ± 10 |
| EPOC 60-270 min (L/min) | 0.0162 ± 0.0117 | −0.0098 ± 0.0092 |
| EPOC 60-270 min (% baseline) | 9.7 ± 4.9b | −3.7 ± 4.6 |
| Avg RQ 60-270 min | 0.82 ± 0.01 | 0.81 ± 0.01 |
Data are expressed as mean ± SEM (HI OA, n = 9; HI PA, n = 10). There were no significant differences except as described. Exercise indicates average oxygen consumption during the 80-minute cycle exercise; EPOC 60-270 min, change in oxygen consumption at 60 to 270 minutes postexercise (see text for calculations); Avg RQ, average RQ during the postexercise period (measurements at 60-270 minutes postexercise in the resting and fasting state).
HI OA vs HI PA: P = .05 for diet group (analysis of covariance, covariate effect of FFM: P < .001).
HI OA vs HI PA: P = .06 (repeated-measures analysis of variance, with EPOC expressed as a fraction of the baseline, preexercise value).
Before the exercise, at 07:00 am, while the subjects were lying in the bed in the GCRC, mean was 0.21 ± 0.02 L/min in the HI OA group and 0.25 ± 0.01 L/min in the HI PA group (not significant). At 30 minutes postexercise, there was no significant difference between the groups in EPOC, expressed as liters per minute or as a percentage of the preexercise value (HI OA vs HI PA; 18.5% ± 6.3% vs 9.3% ± 6.0%) ( P = .3). As shown in Fig. 1, for the 60- to 270-minute postexercise period, mean net change in EPOC was positive at every postexercise time point in HI OA and negative at every point in HI PA. Thus, for the 60- to 270-minute postexercise period, average was elevated 9.7% ± 4.9% compared with the baseline preexercise in HI OA, whereas no EPOC was present in the HI PA group (Table 3). By repeated-measures analysis of variance, there was a borderline significant ( P = .06) higher EPOC in the HI OA group. There was a significant time effect on EPOC ( P < .001) but no time × group interaction. There were, however, individual differences in mean EPOC for the 60- to 270-minute period. Fig. 2 demonstrates that in the HI PA, mean EPOC for the 60- to 270-minute postexercise period ranged from −0.055 to +0.035 L/min, but was negative in 6 of 10 subjects. In the HI OA group, EPOC ranged from −0.056 to 0.062 L/min, but was positive in 7 of 9 subjects. Although the repeated-measures analysis of variance suggested that EPOC data for the 60- to 270-minute period were normally distributed in the 2 groups, the nonparametric Wilcoxon test also showed a borderline significant ( P = .06) effect of diet group on EPOC for this period.
Fig. 1.
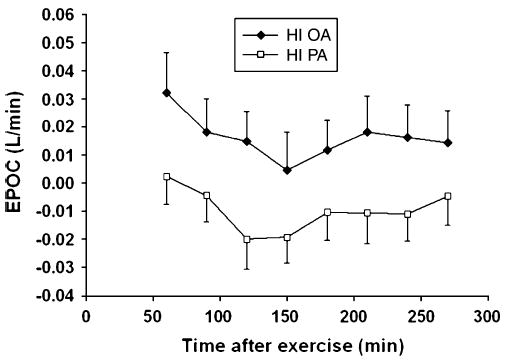
Time course of EPOC (mean ± SEM) for the period 60 to 270 minutes after 80 minutes of cycling at 60% of peak: HI OA (closed symbols, n = 9) and HI PA (open symbols, n = 10) (mean ± SEM).
Fig. 2.
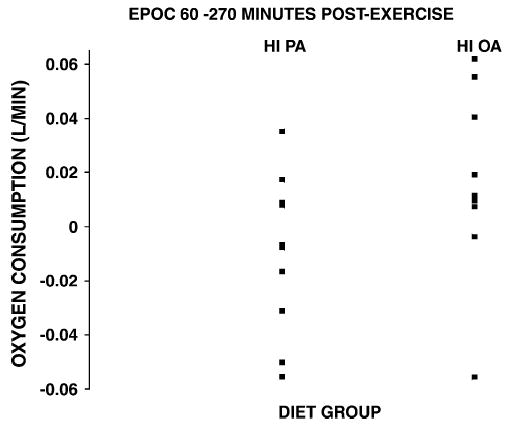
Individual data indicating average EPOC for the period 60 to 270 minutes.
Repeated-measures analysis of variance revealed a significant time effect ( P = .035), but no time × diet group interaction or effect of group on postexercise RQ (Table 3).
4. Discussion
This study compared 2 groups of comparable, healthy young adults, both fed with a moderately high-fat diet compared with their usual intake. One group, HI PA, ingested a high intake of the saturated FA, palmitate, typical of what many Americans eat, and the other group, HI OA, ingested a very low intake of PA but a very high intake of the monounsaturated FA, OA. Those ingesting the high-PA diet exhibited a lower during exercise, when corrected for the significant covariate effect of FFM. Measurement of EPOC at 30 minutes postexercise (“transient” phase) was not a primary goal, and for logistic reasons, the subjects were transported via wheelchair back to the GCRC during this period. Excess postexercise oxygen consumption was not significantly higher in the HI OA group during this period, and EPOC ( > preexercise) was observed in both groups. However, for those ingesting the high-PA diet, it does appear that, on average, there was no measurable EPOC during the 60- to 270-minute period, postexercise, compared with a more normal response in the HI OA group, and the P value for this difference was marginally significant. Although our post hoc statistical analysis provided no evidence that the during exercise had a statistical effect on EPOC, the apparent differences in EPOC could have been related in part to the apparent effects of the diets on during exercise.
The importance of this study relates to how our results support the concept, derived from in vitro studies, that dietary FA may alter mitochondrial mechanisms for energy generation during exercise [8–11,23–25]. The measured differences between groups in during or after exercise are unlikely to impact energy balance, at least for periods of weeks or months.
We acknowledge the fact that our subjects could not participate in a crossover design because they were already subjects in our existing, parallel groups trial, which had several components besides those previously described [13]. However, despite these possible shortcomings, the 2 dietary groups appeared to be well matched for workload, peak, and body composition, especially before the experimental diet intervention. By studying both groups at the same percentage of peak, we standardized the protocol for differences in fitness and training.
The average magnitude of EPOC for the 60- to 270-minute period in the HI OA group was 0.0162 L/min. This value is somewhat smaller than that previously reported in studies with similar exercise bouts [19,20,26]. The reason for this is unknown. The lack of resting control experiments in the present study is unlikely to explain the difference because, if anything, resting energy expenditure (REE) might rise during the late morning and early afternoon, even in the fasting state. Thus, a rising baseline (fasting REE) would diminish, not augment the absolute value of EPOC.
We also did not observe evidence of EPOC, on average, in the subjects fed with the high saturated fat diet (HI PA). Our subjects, in both dietary groups, were ingesting a fairly high-fat diet, and the subjects in the HI PA diet were ingesting a high intake of saturated fat. Although the diet of the subjects perhaps is fairly typical of the so-called average American diet (eg, [3]), these diets were selected to produce divergent effects on FA and energy metabolism rather than being used specifically to test a particular diet. Based on a United States Department of Agriculture survey, about 34% of adult males and 43% of adult females consume less than 10% of dietary energy as saturated fat [27]; therefore, the PA intake on the HI PA diet is greater than what a substantial percentage of Americans eat. It is also not clear if the PA intake of those on the HI PA diet is typical of that ingested by well-trained participants in some EPOC studies. Previous studies of EPOC have neither controlled the FA intake specifically nor really characterized the actual FA intake of their subjects. Thus, we can only speculate if these previous participants in EPOC studies tended to be more health conscious or physically fit than the average person. However, in this regard, there is some literature evidence that more physically fit people or elite athletes do tend to ingest a lower saturated fat intake than the population as a whole [27–29]. Besides possible differences in the FA intake of our subjects on the HI PA diet and the FA intake of some previously studied subjects in exercise studies, in the studies where a prolonged EPOC has been shown, the subjects have generally been more trained (approximately 50 mL/kg per minute or more). This may be explained by the fact that only more fit persons will be able to finish the harder workouts necessary to evoke a prolonged EPOC, but may also be related to fat intake in the diet, which correlates with the level of fitness [27–29]. This has to be further investigated. Interestingly, in the 2 studies performed in American laboratories showing a prolonged EPOC component [30,31], the participants were trained or highly active. It should also be mentioned that in many American studies of untrained subjects, is only measured until it is back to preexercise levels, so it is not known if in the later stages actually drops below this level. In summary, it is not presently known if continually high intakes of specific FA alter the energy cost of exercise or EPOC. We feel that these preliminary data provide some basis for future study of this question. However, in support of a diet influence on EPOC is the fact that there was no prolonged EPOC in the HI PA group. At this point, we think the most plausible mechanism is related to the dietary FA intake.
In summary, consumption of a diet high in PA seemed to diminish the energy cost of cycling exercise and inhibit the normal increase in EPOC for the same level of work, compared with the consumption of a Mediterranean diet–type fat composition, containing much less PA and much more OA.
Acknowledgments
This study was supported by National Institutes of Health grant R01 DK55384, and these studies were conducted on the GCRC at the UTMB at Galveston funded by grant M01 RR 00073 from the National Center for Research Resources, National Institutes of Health, US Public Health Service.
The authors thank the subjects for their thoughtful participation in this study and Dr Figen Ugrasbul for providing medical coverage for the subjects in Dr Kien’s absence. The authors are thankful to the dietary, nursing, and informatics staffs at the UTMB GCRC for their assistance with the clinical aspects of the study and to Travis Solley, Mary Schmitz-Brown, and Pat Kien for technical assistance. Finally, the authors are grateful to the body composition staff at the UTMB GCRC and Shriners Hospital for Children (SHC grant 8760).
References
- 1.Berry EM. Dietary fatty acids in the management of diabetes mellitus. Am J Clin Nutr. 1997;66:991S–7S. doi: 10.1093/ajcn/66.4.991S. [DOI] [PubMed] [Google Scholar]
- 2.Block G, Subar A. Estimates of nutrient intake from a food frequency questionnaire: the 1987 National Health Interview Survey. J Am Diet Assoc. 1992;92:969–77. [PubMed] [Google Scholar]
- 3.Mustad VA, Jonnalagadda SS, Smutko SA, et al. Comparative lipid and lipoprotein responses to solid-food diets and defined liquid-formula diets. Am J Clin Nutr. 1999;70:839–46. doi: 10.1093/ajcn/70.5.839. [DOI] [PubMed] [Google Scholar]
- 4.German JB, Dillard CJ. Saturated fats: what dietary intake? Am J Clin Nutr. 2004;80:550–9. doi: 10.1093/ajcn/80.3.550. [DOI] [PubMed] [Google Scholar]
- 5.Gurr MI. Fats in food. In: Gurr MI, editor. Role of fats in food and nutrition. London: Elsevier Applied Science; 1992. pp. 21–53. [Google Scholar]
- 6.Willett WC, Sacks F, Trichopoulou A, et al. Mediterranean diet pyramid: a cultural model for healthy eating. Am J Clin Nutr. 1995;61(Suppl):1402S–6S. doi: 10.1093/ajcn/61.6.1402S. [DOI] [PubMed] [Google Scholar]
- 7.Renaud S, de Lorgeril M, Delaye J, et al. Cretan Mediterranean diet for prevention of coronary heart disease. Am J Clin Nutr. 1995;61:1360S–7S. doi: 10.1093/ajcn/61.6.1360S. [DOI] [PubMed] [Google Scholar]
- 8.Muoio DM, MacLean PS, Lang DB, et al. Fatty acid homeostasis and induction of lipid regulatory genes in skeletal muscles of peroxisome proliferator–activated receptor (PPAR) alpha knock-out mice. Evidence for compensatory regulation by PPAR delta. J Biol Chem. 2002;277:26089–97. doi: 10.1074/jbc.M203997200. [DOI] [PubMed] [Google Scholar]
- 9.Cohen P, Friedman JM. Leptin and the control of metabolism: role for stearoyl-CoA desaturase–1 (SCD-1) J Nutr. 2004;134:2455S–63S. doi: 10.1093/jn/134.9.2455S. [DOI] [PubMed] [Google Scholar]
- 10.Hardy S, El Assaad W, Przybytkowski E, Joly E, Prentki M, Langelier Y. Saturated fatty acid–induced apoptosis in MDA-MB-231 breast cancer cells. A role for cardiolipin. J Biol Chem. 2003;278:31861–70. doi: 10.1074/jbc.M300190200. [DOI] [PubMed] [Google Scholar]
- 11.Jiang YJ, Lu B, Xu FY, et al. Stimulation of cardiac cardiolipin biosynthesis by PPARalpha activation. J Lipid Res. 2004;45:244–52. doi: 10.1194/jlr.M300314-JLR200. [DOI] [PubMed] [Google Scholar]
- 12.Gadian D, Radda G, Ross B, et al. Examination of a myopathy by phosphorus nuclear magnetic resonance. Lancet. 1981;2:774–5. doi: 10.1016/s0140-6736(81)90186-0. [DOI] [PubMed] [Google Scholar]
- 13.Kien CL, Bunn JY, Ugrasbul F. Increasing dietary palmitic acid decreases fat oxidation and daily energy expenditure. Am J Clin Nutr. 2005;82:320–6. doi: 10.1093/ajcn.82.2.320. [DOI] [PMC free article] [PubMed] [Google Scholar]
- 14.Børsheim E, Bahr R. Effect of exercise intensity, duration and mode on post-exercise oxygen consumption. Sports Med. 2003;33:1037–60. doi: 10.2165/00007256-200333140-00002. [DOI] [PubMed] [Google Scholar]
- 15.Gaesser GA, Brooks GA. Metabolic bases of excess post-exercise oxygen consumption: a review. Med Sci Sports Exerc. 1984;16:29–43. [PubMed] [Google Scholar]
- 16.Bahr R. Excess postexercise oxygen consumption–magnitude, mechanisms and practical implications. Acta Physiol Scand Suppl. 1992;605:1–70. [PubMed] [Google Scholar]
- 17.Bahr R, Hansson P, Sejersted OM. Triglyceride/fatty acid cycling is increased after exercise. Metabolism. 1990;9:993–9. doi: 10.1016/0026-0495(90)90313-2. [DOI] [PubMed] [Google Scholar]
- 18.Wolfe RR, Klein S, Carraro F, Weber J-M. Role of triglyceride–fatty acid cycle in controlling fat metabolism in humans during and after exercise. Am J Physiol. 1990;258:E382–9. doi: 10.1152/ajpendo.1990.258.2.E382. [DOI] [PubMed] [Google Scholar]
- 19.Børsheim E, Bahr R, Høstmark AT, Knardahl S. Effect of b-adrenoceptor blockade on postexercise oxygen consumption and triglyceride/fatty acid cycling. Metabolism. 1998;47:439–48. doi: 10.1016/s0026-0495(98)90057-9. [DOI] [PubMed] [Google Scholar]
- 20.Børsheim E, Bahr R, Knardahl S. Effect of b-adrenoceptor stimulation on oxygen consumption and triglyceride/fatty acid cycling after exercise. Acta Physiol Scand. 1998;164:157–66. doi: 10.1046/j.1365-201X.1998.00422.x. [DOI] [PubMed] [Google Scholar]
- 21.Must A, Dallal GE, Dietz WH. Reference data for obesity: 85th and 95th percentiles of body mass index (wt/ht2 )—a correction. Am J Clin Nutr. 1991;54:773. doi: 10.1093/ajcn/53.4.839. [DOI] [PubMed] [Google Scholar]
- 22.Kwiterovich P. Baltimore: The Johns Hopkins University Press; 1989. Beyond cholesterol. The Johns Hopkins Complete Guide for Avoiding Heart Disease. [Google Scholar]
- 23.Toth MJ, Goran MI, Ades PA, Howard DB, Poehlman ET. Examination of data normalization procedures for expressing peak VO2 data. J Appl Physiol. 1993;75:2288–92. doi: 10.1152/jappl.1993.75.5.2288. [DOI] [PubMed] [Google Scholar]
- 24.Wang YX, Zhang CL, Yu RT, et al. Regulation of muscle fiber type and running endurance by PPARdelta. PLoS Biol. 2004;2:e294. doi: 10.1371/journal.pbio.0020294. [DOI] [PMC free article] [PubMed] [Google Scholar]
- 25.Lin J, Wu H, Tarr PT, et al. Transcriptional co-activator PGC-1alpha drives the formation of slow-twitch muscle fibres. Nature. 2002;418:797–801. doi: 10.1038/nature00904. [DOI] [PubMed] [Google Scholar]
- 26.Maehlum S, Grandmontagne M, Newsholme EA, Sejersted OM. Magnitude and duration of excess postexercise oxygen consumption in healthy young subjects. Metabolism. 1986;35:425–9. doi: 10.1016/0026-0495(86)90132-0. [DOI] [PubMed] [Google Scholar]
- 27.Brodney S, McPherson RS, Carpenter RS, Welten D, Blair SN. Nutrient intake of physically fit and unfit men and women. Med Sci Sports Exerc. 2001;33:459–67. doi: 10.1097/00005768-200103000-00020. [DOI] [PubMed] [Google Scholar]
- 28.Wilcox S, King AC, Castro C, Bortz W. Do changes in physical activity lead to dietary changes in middle and old age? Am J Prev Med. 2000;18:276–83. doi: 10.1016/s0749-3797(00)00117-3. [DOI] [PubMed] [Google Scholar]
- 29.Ziegler PJ, Jonnalagadda SS, Nelson JA, Lawrence C, Baciak B. Contribution of meals and snacks to nutrient intake of male and female elite figure skaters during peak competitive season. J Am Coll Nutr. 2002;21:114–9. doi: 10.1080/07315724.2002.10719203. [DOI] [PubMed] [Google Scholar]
- 30.Gillette CA, Bullough RC, Melby CL. Postexercise energy expenditure in response to acute aerobic or resistive exercise. Int J Sport Nutr. 1994;4:347–60. doi: 10.1123/ijsn.4.4.347. [DOI] [PubMed] [Google Scholar]
- 31.Quinn TJ, Vroman NB, Kertzer R. Postexercise oxygen consumption in trained females: effect of exercise duration. Med Sci Sports Exerc. 1994;26:908–13. [PubMed] [Google Scholar]