

Abstract
Elevated expression of osteopontin (OPN), a secreted phosphoglycoprotein, is frequently associated with many transformed cell lines. Various studies suggest that OPN may contribute to tumor progression as well as metastasis in multiple tumor types. High levels of OPN have been reported in patients with metastatic cancers, including breast. We found that the expression of OPN corroborates with the aggressive phenotype of the breast cancer cells i.e. the expression of OPN is acquired as the breast cancer cells become more aggressive. To assess the role(s) of OPN in breast carcinoma, expression of endogenous OPN was knocked down in metastatic MDA-MB-435 human breast carcinoma cells using RNA interference. We targeted multiple regions of the OPN transcript for RNA interference, along with ‘scrambled’ and ‘non-targeting siRNA pool’ controls to distinguish between target-specific and potential off-target effects including interferon-response gene (PeIF2-α) induction. The OPN knockdown by shRNA suppressed tumor take in immunocompromised mice. The ‘silenced’ cells also showed significantly lower invasion and migration in modified Boyden chamber assays and reduced ability to grow in soft agar. Thus, in addition to the widely reported roles of OPN in late stages of tumor progression, these results provide functional evidence that OPN contributes to breast tumor growth as well.
Keywords: Osteopontin, RNA interference, Invasion, Migration, Tumorigenicity, Breast cancer
Abbreviations: CMF-DPBS Calcium- and magnesium-free Dulbecco’s phosphate buffered saline, DMEM-F12 Mixture (1:1) Dulbecco’s-modified minimum essential medium and Ham’s F-12 medium, HBSS Hank’s balanced salt solution, SDS Sodium dodecyl sulfate, PAGE Poly acrylamide gel electrophoresis
Introduction
Most deaths from breast cancer are a result of distant metastases rather than primary tumor burden. Substantial data have linked the phosphoglycoprotein osteopontin (OPN) with tumor progression and metastatic spread [1–5]. However, the molecular mechanisms, which define the role of OPN in these processes are not completely understood.
The levels of OPN are significantly elevated in the tumors and plasma of patients with metastatic breast cancer, and are notably associated with tumor aggressiveness and decreased survival in patients with metastatic breast cancer [1, 2]. Likewise, OPN expression has been associated with tumor progression in multiple tumor histiotypes [3–5].
Functionally, over-expression of OPN gene into a benign or weakly tumorigenic human breast cancer cell lines conferred invasive behavior in human mammary epithelial cells [6, 7] and augmented tumor growth of murine melanoma cells [8]. Reduction of OPN expression decreased colony formation and incidence of osteolytic metastases in nude rats [9, 10] and inhibited bone resorption by mouse osteoclasts in vitro [11]. Antisense inhibition of OPN expression attenuated growth and colony-forming ability of human 231 LC-1 breast cancer cells [12], reduced lung metastases by malignant B77-Rat1 fibroblasts [13], inhibited tumor promoter-induced neoplastic transformation of mouse JB6 epidermal cells [14], and decreased experimental metastases in ras-transformed NIH 3T3 metastatic mouse fibroblasts [15]. OPN-deficient mice display reduced metastases to bone and soft tissues [16] and decreased metastases to the lung and bone with B16 melanoma cells [17]. In all, OPN is generally associated with mammary gland development [18], tumor progression and metastasis [7, 19–21].
A recent study by Cook et al. [22] found that OPN over-expression in a breast cancer cell line altered the gene expression profile, including changes in genes typically associated with multiple stages of tumor formation, both early and late. These findings provided the suggestion that OPN may contribute to early tumor progression as well as malignant behavior. A recent study published by Khodavirdi et al. [23] reports that in prostate cancer cells, OPN could lead to increased proliferation, invasion, and most remarkably, to the enhanced ability to intravasate into blood vessels. Although several investigations have examined the functional effects of OPN, to date a cause-and-effect role of OPN on tumor growth has not been demonstrated.
Given the prevalence of reports on OPN and metastatic breast cancer, we carried out studies to address the role of OPN in tumor growth and metastasis. We found that the expression of OPN corroborates with the aggressive phenotype of the breast cancer cells. In order to distinguish whether the increased levels of OPN were associated with or determinative of the aggressive phenotype we knocked down the expression of OPN from a metastatic human breast carcinoma cell line, MDA-MB-435, using RNA interference (shRNA) [24, 25]. Since MDA-MB-435 expresses high levels of OPN and because it forms progressively growing tumors upon orthotopic injection (for purposes here, tumorigenicity) that metastasize to lung and lymph nodes, the combination of these properties render the cell line particularly useful for assessing the role(s) of OPN in breast carcinoma biology. Here we determined that abrogating OPN expression suppresses primary tumor growth, suggesting that OPN can play a functional role in tumorigenicity as well as other steps of tumor progression. Our results provide evidence, that besides breast tumor progression, OPN plays a role in tumorigenesis of breast cancers.
Materials and methods
Cell lines
MCF10A (non-tumorigenic, non-metastatic), MCF-10AT (tumorigenic, non-metastatic), MCFDCIS.com (tumorigenic; locally invasive, non-metastatic), MCF10CA cl a (metastatic) and MDA-MB-435 (metastatic) [26, 27, 28] were cultured in DMEM-F12 (Invitrogen, Carlsbad, CA, USA) supplemented with 5% horse serum, EGF (10 ng/ml), cholera toxin (100 ng/ ml), insulin (10 μg/ml) and cortisone (0.5 μg/ml).
MDA-MB-435, a gift from Dr. Janet Price (University of Texas-M. D. Anderson Cancer Center), was derived from the pleural metastases of a 46-year-old woman with breast carcinoma. It forms progressively growing tumors that form metastases in the lungs and regional lymph nodes following injection into the mammary fat pads of 3–4 week old athymic nude mice [28]. The origin of MDA-MB-435 has been questioned because it expresses some melanoma associated genes [29, 30], but a recent study concludes that it is of breast cancer origin because milk proteins are expressed [31]. It is also very pertinent to note that MDA-MB-435 metastasizes from the mammary fat pad but rarely from the subcutis. MDA-MB-435 forms progressively growing tumors that metastasize to lungs and regional lymph nodes following orthotopic injection into immunocompromised mice [28].
Stable transfectants were selected and maintained in 1:1 mixture of Dulbecco’s-modified minimal essential media and Ham’s F-12 media (DMEM-F12) supplemented with 5% FBS and 250 ng/ml Puromycin (Mediatech, Herndon, VA, USA). Cell cultures were maintained on 100 mm Corning tissue culture dishes at 37°C in a humidified atmosphere with 5% CO2. When cultures reached 80–90% confluence they were passaged using a solution of 2 mM EDTA in Ca+2/Mg+2-free Dulbecco’s phosphate buffer saline (CMF-DPBS). Transfectants were used between passages 4 and 8 in order to minimize the impacts of clonal diversification and phenotypic instability. For all functional and biological assays, cells with viability >95% were used at 70–90% confluence. All the lines were routinely checked and found negative for Mycoplasma spp. contamination using TaKaRa Mycoplasma detection kit (TaKaRa Bio, Otsu, Shiga, Japan). Determination of cell number was done using a hemacytometer.
RNA interference studies
Using the Oligo Design ToolTM (Oligoengine, Seattle, WA, USA) we selected 5 heteroduplexes (shRNA) that were designed on the basis of algorithms of the software to have the potential to silence expression of OPN. These were NM104, NM134, NM173, NM636 and NM762. The number following NM indicates the position of the oligonucleotide at the 5′ end of the cDNA of OPN (Accession no.: NM_000582). Details are provided in Table 1.
Table 1.
Details of the shRNAs (Oligoengine) and siRNAs i.e. SMARTpool reagents (Dharmacon, Inc) used in this study
| Sequences of shRNA assessed for OPN knockdown | |||
| shRNA notation | Oligonucleotide designation | Targeted OPN mRNA sequence | Position from start codon per Genbank sequence NM_000582 |
| NM104 | NM_000582-104 | AUACCCAGAUGCUGUGGCC | 104 |
| NM134 | NM_000582-134 | CCCUGACCCAUCUCAGAAG | 134 |
| NM173 | NM_000582-473 | GAAGUUUCGCAGACCUGAC | 473 |
| NM636 | NM_000582-636 | ACGAGUCAGCUGGAUGACC | 636 |
| NM762 | NM_000582-762 | GUCAGCCGUGAAUUCCACA | 762 |
| Sequences of siRNA assessed for OPN knockdown | |||
| siGENOME duplex | Catalog no. | Targeted OPN mRNA sequence | Position from start codon per Genbank sequence NM_000582 |
| 1 | D-012558-01 | GAACGACUCUGAUGAUGUAUU | 438 |
| 2 | D-012558-02 | CCACAGACCCUUCCAAGUAUU | 334 |
| 3 | D-012558-03 | CCACAUGGAUGAUAUGGAUUU | 372 |
| 4 | D-012558-04 | GAAGAUAAACACCUGAAAUUU | 1003 |
The shRNAs were cloned into pSUPER to assess the efficiency of OPN silencing and to construct stable transfectants for in vivo analysis. The table gives the shRNA and siRNA notations used in this paper, the sequence that the shRNA and siRNA is expected to target and its position in the OPN transcript. While the sequence of the individual oligomers (siRNAs) is listed, the pool comprises a mixture containing an equal amount of each oligomer. Listed is the also catalog number for each oligonucleotide (siRNA)
The heteroduplexes supplied as asymmetric oligomers were annealed following manufacturer’s instructions. They were cloned into pSUPER (Oligoengine) at the BglII and HindIII sites. Recombinants were analyzed by restriction digestion using EcoRI and HindIII (Promega, Madison, WI, USA) and recombinant DNA was prepared using the QIA Maxiprep kit (Qiagen, Valencia, CA, USA).
The SMARTpool® reagents from Dharmacon, Inc (Lafayette, CO, USA) were also used to demonstrate multiplicity of siRNA-mediated target gene silencing. These were used as individual siGenome duplexes® as well as a pre-mixed pool comprising all these individual duplexes. The details of the sequences and positions in the OPN cDNA are given in Table 1.
Transfections were done with Lipofectamine 2000 (Invitrogen, Carlsbad, CA, USA) using the manufacturer’s instructions.
Immunoblotting
To determine OPN expression, 4 × 10⁶ cells were seeded in a 100-mm tissue culture plate in 5% FBS containing medium. The medium was replaced with serum-free medium and assayed 24 h later for OPN expression. The cell-free medium was resolved on a 12.5% SDS-PAGE. Proteins were transferred to Poly Screen® membrane (NEN-Dupont, Boston, MA, USA) by semi-dry transfer (5.5 mA/cm2, 20 V, 30 min) and probed with the anti-human OPN mouse monoclonal antibody, MP (III) B10 obtained from the Developmental Studies Hybridoma Bank (DSHB), Iowa (Fig. 1) or the rabbit anti-human OPN antibody (Sigma, St. Louis, MO, USA) used at a final dilution of 1:1000 (Fig. 2a, c, d) followed by secondary antibody conjugated to horseradish peroxidase (Amersham Biosciences, Piscataway, NJ, USA) in a solution of 3% BSA/TTBS and detection using chemiluminescence (Luminol, Santacruz Biotechnology, Santacruz, CA, USA) for 30 s to 1 min. OPN is seen at ~55–65 kDa. A signature band at ~75 kDa (as seen by Ponceau S staining) provided evidence of equal loading of the cell-free medium. Since OPN is post-translationally modified by phosphorylation and glycosylation [32, 33], antibodies to different peptides in OPN reveal the complexities in the various isoforms [34].
Fig. 1.

Osteopontin expression increases with an increasing aggressive phenotype of breast cancer cells. Shown is a western blot of cell lysates of the indicated cell lines probed with the anti-human OPN MP (III) B10 monoclonal antibody. β-actin loading serves as an indicator of equal loading
Fig. 2.
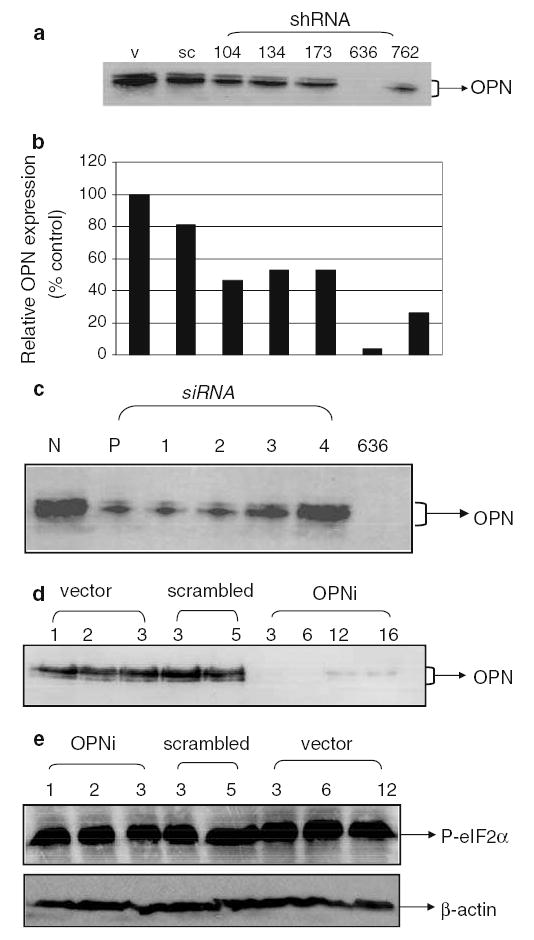
Silencing of OPN from MDA-MB-435 cells by RNA interference (a) Transfection of the NM636 heteroduplex results in near-total suppression of OPN expression. Shown is a western blot using anti-OPN antibody with cell-free conditioned medium from transiently transfected MDA-MB-435 cells. V: vector-only, pSUPER transfected cells, sc: pSUPER-scrambled transfected cells, shRNA-104, 134, 173, 636 and 762: pSUPER-NM104, NM134, NM173, NM636 and NM762 transfected cells. (b) Densitometric analysis of western blot in 2a. pSUPER-NM636 transfected cells are almost completely suppressed for OPN expression. Results are depicted relative to vector-transfectants. (c) The SMARTpool reagents (Dharmacon) bring about suppression of OPN expression. N: non-targeting siRNA pool (Dharmacon), P: SMARTpool reagent, 1, 2, 3 and 4: The individual siRNAs that comprise the SMARTpool reagent and 636: pSUPER-NM636 transfected cells. Details provided in Table 1. (d) Stable clones generated using pSUPER-NM636 are knocked down for OPN expression. Shown is a western blot using anti-OPN antibody with cell-free conditioned medium from stably transfected MDA-MB-435 cells. Vector (1–3): pSUPER transfectant clones 1 through 3, scrambled: pSUPER-scrambled sequence transfected cells, clones 3 and 5, OPNi: various clones of pSUPER-NM636 transfected cells. (e) The level of the IFN-induced gene, P-eIF2α is comparable across all transfected clones as analyzed by western blot in the stable transfectants generated using pSUPER-NM636 construct
Cell lysates were prepared by washing a monolayer of cells (90–95% confluence) twice with ice-cold PBS followed by lysis with ice-cold lysis buffer (0.5% NP-40 (Sigma), 50 mM Tris, pH 8, 150 mM NaCl, and 2 mM EDTA) containing Protease Inhibitor cocktail sets I and III and Phosphatase inhibitor cocktail set II (Calbiochem, EMB Biosciences, La Jolla, CA, USA) at a concentration specified by the manufacturer. Lysate was passed through a 21-gauge needle several times, incubated on ice for 1 h, then centrifuged for 1 h at 12,000 × g in an Eppendorf Microcentrifuge 5415R microcentrifuge to remove insoluble debris. About 30 μg of lysate was loaded in the gel for protein analysis.
To monitor whether the double-stranded RNAs were exerting effects by induction of interferon (IFN) and downstream effectors [35, 36], expression of P-eIF2α was assessed by immunoblot (Cell Signaling, Beverly, MA, USA). Antibody was used as per manufacturer instructions at a 1:1000 dilution followed by 1:5000 dilution of anti-rabbit secondary antibody conjugated to horseradish peroxidase (Amersham, Piscataway, NJ, USA) and detection using chemiluminescence (ECL, Amersham).
In vitro growth characterization
Cells at 80–90% confluence were detached using 2 mM EDTA and seeded at a density of 5000 cells/well in a 24-well plate. The growth, viability and morphology of cells were monitored and photographed daily for 10 days.
Migration assay
A Boyden chamber assay was used with minor modification. Sterile 8-μm polyethylene terepthalate filters (BD Pharmingen, San Diego, CA, USA) were coated with 6 μg/ml gelatin (Sigma, St. Louis, MO, USA). The filters were hydrated with 150 μl serum-free medium at room temperature for 90 min before use. The lower chambers of a 24-well plate were filled with 0.75 ml 10% FBS-supplemented DMEM-F12 and 0.5 ml serum-free DMEM-F12 containing 5 × 10⁴ tumor cells was added to the gelatin-coated trans-well chambers and the plate incubated at 37°C in 5% CO2 humidified atmosphere for 5 h. The filters were removed and membranes were stained with Diff-Quick solutions (Dade Behring Inc., Newark, DE, USA). Cells on the upper side of the filter were removed gently with a cotton swab and the cells on the lower side of the filter were counted under a microscope. Each test group was assayed in triplicate. Each filter was photographed at 10 × magnification of a Nikon Eclipse TE2000-U microscope and photographed using the F3.8 setting of a Nikon CoolPixId 700D camera. The photograph was divided into quadrants and diagonally opposite quadrants were assessed using the Autoanalysis option of the AlphaEase3 software (Alpha Innotech, San Leandro, CA, USA).
Invasion assay
MatrigelTM-coated, sterile, 8-μm polyethylene terepthalate filters (BD Pharmingen) were re-hydrated as described above. The lower chambers of the 24-well plate were filled with 0.75 ml DMEM-F12 containing 10 μg/ ml fibronectin (BD Pharmingen) as a chemoattractant and 0.5 ml serum-free DMEM-F12 containing 5 × 10⁴ tumor cells was added to the trans-well chambers and the plate incubated at 37°C in 5% CO2 humidified atmosphere for 72 h. Further staining and recording of results was done as mentioned above in migration assay.
Homotypic cell adhesion assay
MDA-MB-435 cells were plated the day before the assay in 96-well plates at 50,000 cells per well such that they form a monolayer of cells. Cells were labeled using Fluoresbrite® carboxylate nanospheres (Polysciences Inc., Warrington, PA, USA; bead size 0.48–0.50 nm diameter) [37] diluted 1:50 in serum-free DMEM-F12 at 37°C in 5% CO2 humidified atmosphere for 1 h with intermittent rocking. During this time the cells spontaneously internalized the nanospheres. Labeling efficiency was nearly 95–100% at the end of 1 h. Cells were detached using a solution of 2 mM EDTA in CMF-DPBS. Nearly 90–95% of the detached cells retained the nanospheres. Labeled cells (3 × 10⁴) in 0.2 ml were added to each well of the 96-well plate and incubated at 37°C in 5% CO2 humidified atmosphere for 20 min. Excess, unbound cells were washed off three times using PBS. Each test group was assayed in triplicate. The filter was photographed at 10 × magnification of the Nikon Eclipse TE2000-U microscope and photographed using the F3.8 setting of the Nikon CoolPix Id 700D camera. The photograph was divided into quadrants and cells adhering were quantified in diagonally opposite quadrants by image analysis using the Auto-analysis option of the AlphaEase3 software.
Soft-agar colonization assay
Cells (1000/well) were suspended in 0.35% Bactoagar and were plated onto a layer of 0.75% Bactoagar in DMEM-F12 containing 5% FBS in 6-well tissue culture plates (Corning, Corning, NY, USA). The agar containing cells was allowed to solidify overnight at 37°C in 5% CO2 humidified atmosphere. Additional DMEM-F12 + 5% FBS was overlaid on the agar and the cells allowed to grow undisturbed for 2 weeks. Visible colonies (>50 cells) were counted with the aid of a dissecting microscope.
In vivo assays
Immediately prior to injection, cells at 70–90% confluence were detached with 2 mM EDTA solution, washed with chilled CMF-DPBS, counted using a hemacytometer and resuspended in ice-cold Hank’s Balanced Salt Solution (HBSS; Invitrogen) to a final concentration of 5.0 × 10⁶ cells/ml. Cells (1.0 × 10⁶ / 200 μl) were injected into the second or third mammary fat pad of 4–6 week old, female athymic mice (Harlan Sprague-Dawley, Indianapolis, Indiana, USA) using a 27 gg needle affixed to a 1 cc tuberculin syringe.
Tumor size was measured weekly and mean tumor diameter calculated by taking the square root of the product of orthogonal measurements. After the mean tumor diameter reached 1.0–1.5 cm, tumors were surgically removed under Ketamine:Xylazine (80–85 mg/kg: 14–16 mg/kg) anesthesia and the wounds closed with sterile stainless steel clips (9 mm) (Braintree Scientific, Braintree, MA, USA). Tumor tissue was preserved in neutral-buffered formalin for histologic analysis. Sections (4–6 μm) were prepared by dehydration, paraffin embedding, sectioning and staining with hematoxylin and eosin. Four weeks later, mice were killed and examined for the presence of metastasis. Lungs were removed, rinsed in saline and fixed in diluted Bouin’s solution (20% Bouin’s fixative in neutral buffered formalin) before quantification of visible surface metastasis as described [38]. A small portion of the lungs was also stored in RNAlater (Ambion, Austin, TX, USA) for analysis of OPN expression. Animals were maintained under the guidelines of the National Institute of Health and the University of Alabama at Birmingham. All protocols were approved and evaluated by Institutional Animal Care and Use Committee. Food and water were provided ad libitum.
Histology/immunohistochemistry
Mammary tumors were fixed in 10% neutral buffered formalin (Fisher Scientific, NJ, USA) and embedded in paraffin. Sections were cut to 5-μm thickness and stained using the anti-human OPN monoclonal mab53 [32] antibody at 1:100 dilution after heat-induced antigen retrieval. Secondary detection was achieved via a streptavidin/horseradish peroxidase secondary detection system (Signet Laboratories, Dedham, MA) and diaminobenzidine (BioGenex, San Ramon, CA, USA). Photomicrographs were taken in the area of most intense and diffuse staining for OPN. The intensity of staining of tumor cells was assessed as 0 (no staining) to 4 (strongest possible intensity of staining). The immunoscore was derived as the product of the percentage of cells at each intensity and the corresponding intensity. The products were added to get an immunoscore for the section [39].
Statistical analysis
Statistical differences between groups were assessed using the t-test or ANOVA, using GraphPad Prism 4 statistical software (San Diego, CA, USA).
Results
Expression of OPN corroborates with the aggressive potential of breast cancer cells
In order to examine the role of OPN in the progression of breast cancer, we examined a panel of cell lines that represent the progression of breast cancer towards a malignant/metastatic phenotype: MCF10A (non-tumorigenic, non-metastatic), MCF10AT (tumorigenic, non-metastatic), MCFDCIS.com (tumorigenic; locally invasive, non-metastatic), MCF10CA cl a (metastatic) and MDA-MB-435 (metastatic). Notably, the MCF10A lines represent an isogenic lineage of cells. While the level of OPN is elevated in the highly aggressive MDA-MB-435 cells, we also observe an increase in the levels of OPN in cells at earlier stages of progression (Fig. 1), thereby indicating an association of OPN with the development as well as progression of breast cancer.
Transcriptional silencing of OPN by RNA interference
To understand the role(s) of OPN in progressive tumor growth in an orthotopic site (i.e., tumorigenicity) and/ or metastasis, we reduced the expression of OPN in MDA-MB-435 cells using RNA interference (Table 1). Secreted OPN was measured by western blot (Fig. 2a, b). The NM636 and NM732 heteroduplex shRNA reduced OPN expression by 96.5 and 73.7%, respectively (Fig. 2a, b). A scrambled sequence (Oligoengine) cloned into pSUPER did not significantly affect OPN expression. In order to demonstrate multiplicity of siRNA-induced target gene silencing [35], SMART-pool reagents were used as duplexes or as a pre-mixed pool of duplexes (Table 2). Use of pooled duplex enabled rapid and reliable screening of potential targets with high confidence while minimizing off-target activity and false results. The SMARTpool as well as three out of four duplexes effectively reduced OPN expression (Fig. 2c). A non-targeting siRNA pool also was used as a control in order to distinguish between target-specific and potential off-target sequences. Stable transfectants in MDA-MB-435 were made with pSUPER-NM636 under puromycin selection (Fig. 2d).
Four clones were chosen for further study based on their knock down of OPN. Clones 3 (OPNi-3) and 6 (OPNi-6) showed significant loss of OPN (>85%) expression whereas clones 12 (OPNi-12) and 16 (OPNi-16) have lost 66 and 64 % expression of OPN respectively (Fig. 2d). Three stable clones transfected with vector-only (pSUPER, designated v-1 through v-3) were isolated in addition to two stable clones expressing the scrambled sequence (sc-3 and sc-5). Cell clones were then characterized for multiple in vitro and in vivo characteristics associated with tumorigenicity and/or metastasis. Before bioassays were done, P-elF2α was measured in order to examine for activation of IFN-response genes by shRNA [36]. No induction of P-elF2-α was observed (Fig. 2e).
Knocking down OPN expression attenuates transformed phenotype of cells
Vector-only transfectants and scrambled sequence-transfected clones grew slightly, but not significantly slower than MDA-MB-435 on plastic substrates (Fig. 3a). OPNi-3 and -6 grew significantly slower (P < 0.005) while OPNi-12 and -16 grew at a rate comparable to the controls. Cell migration, as a component of cellular invasion, was measured in response to FBS as a chemoattractant (Fig. 3b). Migration of OPNi-3 and -6 was significantly suppressed compared to controls (vector-only and scrambled). Surprisingly, vector- and scrambled sequence controls migrated better than parent MDA-MB-435 cells in response to 10% FBS. The migration of OPNi-12 was more comparable to parent, vector controls and scrambled controls. Comparable suppression of the OPNi clones was retarded for invasion through Matrigel-coated filters. OPNi-3 was most retarded (Fig. 3c). Both, invasion and migration were similarly inhibited by SMARTpool duplexes and pre-mixed pool (data not shown).
Fig. 3.

Silencing OPN attenuates the transformed phenotype of MDA-MB-435. (a) OPNi clones 3 and 6 show significantly (P < 0.005) slower in vitro growth than all the vector-only and scrambled-transfected cells. OPNi clones 12 and 16 grew at a rate comparable to that of the controls. Cells were seeded at a density of 1 × 10⁴ cells/well in a 24-well plate. The growth (viability) and morphology of cells was monitored daily for 10 days. 435: MDA-MB-435 cells, v-1 and 2: vector-only 9pSUPER) clones, sc-3 and 5: scrambled duplex transfected clones, OPNi 3, 6, 12 and 16: clones stably silenced for OPN by NM636 heteroduplex. (b) The OPNi clones 3 and 6 are inhibited in their ability (P < 0.05) to migrate through gelatin in a modified Boyden chamber assay as compared to the parent, vector-only and scrambled sequence clones. The gelatin-coated trans-well chamber was filled with 5 × 10⁴ tumor cells and invasion was monitored. Each clone was tested in triplicate to migrate in response to 10% FBS. (c) Knocking down OPN expression significantly (P < 0.05) retards the ability of MDA-MB-435 cells to invade through Matrigel in response to 10 μg/ml fibronectin relative to the parent, vector-only and scrambled sequence clones. The trans-well membranes were stained with Diff-Quick solutions. (d) The OPNi transfectants are inhibited in their ability to form colonies in soft agar. Cells (1000) were seeded in 6-well tissue culture plates in Bactoagar. Visible colonies (>50 cells) were counted with the aid of a dissecting microscope. OPNi-3 and -6 show significant inhibition (P < 0.05) compared to controls as well as OPNi-12. (e) RNAi-mediated suppression of OPN hinders homotypic cell–cell adhesion. OPNi-3 is notably (P < 0.05) affected compared to controls as well as OPNi-6 and -12. Cells (3 × 10⁴) labeled using Fluoresbrite® carboxylate nanospheres were dropped on to a confluent monolayer of the same type of cells and incubated at 37°C in 5% CO2 humidified atmosphere for 20 min. Each test group was assayed in triplicate. v-1 and 2: vector-only clones, sc-3 and 5: scrambled duplex transfected clones, OPNi 3, 6 and 12: clones stably silenced for OPN by NM636
Soft agar colonization followed a similar pattern (Fig. 3d). OPNi-3 and -6 formed notably fewer colonies (P < 0.05) than OPNi-12, parent, vector-only and scrambled controls. Surprisingly, the scrambled clones also showed a decreased ability to form colonies on soft agar.
Hypothesizing that secreted OPN could alter cell–cell interactions, homotypic cell–cell adhesion was measured using fluorescently labeled cells dropped on to a monolayer of cells of the same type and allowed to adhere for 20 min. While OPNi-3 was the most inhibited for homotypic cell–cell adhesion, that of OPNi-6 was intermediate compared to OPNi-3 and parent, vector-only and scrambled controls (Fig. 3e).
Transcriptional silencing of OPN abrogates tumorigenicity and metastasis
The in vitro results supported the hypothesis that OPN contributed to tumorigenicity and/or metastatic capacity of MDA-MB-435 cells. To directly measure this, OPNi clones and controls were injected into the mammary fat pads of athymic mice. Only 25% (OPNi-3) and 30% (OPNi-6) of the mice injected developed orthotopic tumors (Fig. 4a). Of the tumors that did form, growth initiation was delayed approximately 3 weeks and the rate of growth was markedly attenuated (Fig. 4b). In contrast, all mice injected with MDA-MB-435 or vector-only control cells developed orthotopic tumors. Scrambled sequence expressing cells were still highly tumorigenic (90% incidence). While the tumors in the mice injected with the OPNi-12 and 16 cells displayed an initial lag in growth, eventually, they grew at a rate comparable to the controls. It was not determined if the small decrease was due to unexpected ancillary effects of RNA interference. OPNi-3 and -6 also produced significantly fewer pulmonary metastases (25–30% incidence) compared to controls or OPNi-12 and -16 (80–90% incidence) (Fig. 4a).
Fig. 4.

Transcriptional silencing of OPN abrogates tumorigenicity and metastasis. (a) Knocking down OPN reduces tumorigenesis concomitant with reduced pulmonary metastases. Shown is the percent incidence of primary tumors and lung metastases in the controls and the OPNi clones. 435: MDA-MB-435 cells, v1, v-2, v3: vector-only clones, sc-3 and -5: scrambled sequence clones, OPNi 3, -6, -12 and -16: clones stably silenced for OPN by NM636 heteroduplex. While only 25 and 30% of mice injected with OPNi clones 3 and 6 developed tumors as well as pulmonary metastases, the mice injected with MDA-MB-435, other controls and OPNi clones 12 and 16 showed 80–90% incidence of lung metastases. The results represent two independent experiments (20 mice per group were analyzed). (b) OPNi clones 3 and 6 (expressing least OPN) show significantly smaller and slower growing tumors. One million cells were injected in the mammary fat pad of athymic nude mice. Tumor development was monitored over 2 months. OPNi clones 3 and 6 show a statistically significant (P < 0.05) retardation in the growth rate of the tumors from day 30 post-injection. The results represent two independent experiments
Tumors that developed from OPNi-6 show considerable loss of OPN staining (Fig. 5a). Additionally, it is evident from the immunoscores (Fig. 5b) that the OPNi-3 stained minimally for OPN. Clones 12 and 16 expressed OPN at only a slightly lower level that the parent MDA-MB-435 cells. The variations in the vector staining can be most likely attributable to clonal variation.
Fig. 5.

The expression of OPN in the xenografts corroborates with the OPN expression in the cells injected at the orthotopic site. (a) Immunohistochemical staining of xenografts for OPN. Formalin-fixed, paraffin-embedded xenografts were immunostained with monoclonal anti-OPN-53 after heat-induced antigen retrieval. Photomicrographs were taken in the area of most intense and diffuse staining for OPN. (A) Xenograft transfected with empty pSUPER vector (pSUPER-3, negative control). (B) Xenograft developed by injecting cells of OPNi-6 (b) Immunoscoring of xenografts for OPNi. The formalin-fixed paraffin embedded sections were scored based on the intensity of staining and the percentage of positive cells at each intensity. 435: MDA-MB-435, v-1 through v-3: vector-only clones, sc-3: scrambled transfected clone 3, OPNi 3, 6, 12 and 16: clones silenced for OPN by NM636
Discussion
The preponderance of data has implicated OPN in aggressive behaviors in cancer cells [40–48]. Recently, data showing parameters associated with tumor growth are also sometimes associated with OPN expression have begun to accumulate in the literature [1–5]. Behrend et al. [15] targeted OPN by antisense oligonucleotides in ras-transformed NIH3T3 cells and showed decreased tumorigenicity. Adwan et al. [9, 10] demonstrated decreased colony formation and reduced osteolytic metastases in MDA-MB-231 cells expressing OPN antisense oligonucleotides. But the data identify no intrinsic mechanism for OPN enhancement of tumor growth and/or metastasis. To more directly assess the latter relationship, we assessed the expression of OPN in a panel of breast epithelial cell lines representing the early stages of breast cancer and the progression of breast cancer to the metastatic phenotype. We noted a striking direct correlation between the expression of OPN and the acquisition of an invasive/aggressive phenotype with the development and progression of breast cancer. In order to determine if this observation is merely associative with or determinative of the metastatic phenotype, expression of OPN was abrogated by RNAi in metastatic human breast carcinoma MDA-MB-435. Knock down of OPN retarded growth in culture, diminished soft agar colonization, lowered homotypic cell–cell adhesion as well as impeded invasion and reduced migration in vitro. RNAi of OPN significantly inhibited tumor take and growth in vivo in a dose-dependent manner. Tumor latency was maximal in cells that were most suppressed for OPN expression. Interestingly, cells with >40% basal expression of OPN did not show latency and loss of tumorigenicity. This result suggests a possible threshold level necessary for cancer to develop, even if clonal variability is taken into account. To the best of our knowledge, this is the first report showing that OPN expression is critical for tumorigenesis of metastatic human breast carcinoma cells since knocking down the expression abolishes tumorigenicity.
Signals that interrupt the cell cycle, prevent apoptosis, and promote cell survival are integral to tumor progression, many of which are down-stream of OPN and which regulate tumor progression and invasion [18–22, 47]. Studies performed by Khan et al. [49] suggest a function of OPN to facilitate the survival of stressed endothelial cells, possibly by occupying unligated integrins and suppressing integrin-mediated death. Likewise, OPN has been implicated in promoting angiogenesis thereby contributing to tumor growth [43, 44]. Thus, the latency or abrogation of tumor growth seen in OPN-RNAi expressing cells is consistent with reduced survival and growth signals within the tumor cells themselves. The data are also consistent with interruption of tumor cell signals that are responsible for neovascularization. While the findings presented do not define a single mechanism, they highlight the regulation of complex phenotypes by OPN. The finding that OPN plays a greater role in MDA-MB-435 breast cancer growth than previously documented suggests that disruption of OPN signaling may be a viable therapeutic target for early- and late-stage breast cancers.
Acknowledgments
This work was supported by grants from The Susan G. Komen Breast Cancer Foundation BCTR0402317 (LAS), U.S. Public Health service, CA87728 (DRW), CA89019 (DRW), U.S. Army Medical Research and Materiel Command DAMD-17-02-0541 (DRW), Ontario Cancer Research Network 04-MAY-00089 (AFC) and the National Foundation for Cancer Research. AFC is Canada Research Chair in Oncology. L. A. Shevde was a recipient of a postdoctoral fellowship from the Susan G. Komen Breast Cancer Foundation (PDF 2000-218) and ACS-IRG 60-0010-44 and CA13148-31. L. A. Shevde and R. S. Samant were both recipients of pilot project grants from the UAB Breast SPORE (CA89019) and R. S. Samant is currently supported by the Susan G. Komen Breast Cancer Foundation (BCTR0503488).
References
- 1.Singhal H, Bautista DS, Tonkin KS, et al. Elevated plasma osteopontin in metastatic breast cancer associated with increased tumor burden and decreased survival. Clin Cancer Res. 1997;3(4):605–611. [PubMed] [Google Scholar]
- 2.Tuck AB, O’Malley FP, Singhal H, et al. Osteopontin expression in a group of lymph node negative breast cancer patients. Int J Cancer. 1998;79(5):502–508. doi: 10.1002/(sici)1097-0215(19981023)79:5<502::aid-ijc10>3.0.co;2-3. [DOI] [PubMed] [Google Scholar]
- 3.Agrawal D, Chen T, Irby R, et al. Osteopontin identified as lead marker of colon cancer progression using pooled sample expression profiling. J Natl Cancer Inst. 2002;94(7):513–521. doi: 10.1093/jnci/94.7.513. [DOI] [PubMed] [Google Scholar]
- 4.Rudland PS, Platt-Higgins A, El-Tanani M, et al. Prognostic significance of the metastasis-associated protein osteopontin in human breast cancer. Cancer Res. 2002;62:3417–3427. [PubMed] [Google Scholar]
- 5.Coppola D, Szabo M, Boulware D, et al. Correlation of osteopontin protein expression and pathological stage across a wide variety of tumor histologies. Clin Cancer Res. 2004;10:184–190. doi: 10.1158/1078-0432.ccr-1405-2. [DOI] [PubMed] [Google Scholar]
- 6.Tuck AB, Arsenault DM, O’Malley FP, et al. Osteopontin induces increased invasiveness and plasminogen activator expression of human mammary epithelial cells. Oncogene. 1999;18(29):4237–4236. doi: 10.1038/sj.onc.1202799. [DOI] [PubMed] [Google Scholar]
- 7.Oates AJ, Barraclough R, Rudland PS. The identification of osteopontin as a metastasis-related gene product in a rodent mammary tumour model. Oncogene. 1996;13(1):97–104. [PubMed] [Google Scholar]
- 8.Philip S, Bulbule A, Kundu G. Osteopontin promotes tumor growth and activation of promatrix metalloproteinase-2 through nuclear factor-κB mediated induction of membrane type 1 matrix metalloproteinase in murine melanoma cells. J Biol Chem. 276(48):44926–44935. doi: 10.1074/jbc.M103334200. [DOI] [PubMed] [Google Scholar]
- 9.Adwan H, Bauerle TJ, Berger MR. Downregulation of osteopontin and bone sialoprotein II is related to reduced colony formation and metastasis formation of MDA-MB-231 human breast cancer cells. Cancer Gene Ther. 2004;11(2):109–120. doi: 10.1038/sj.cgt.7700659. [DOI] [PubMed] [Google Scholar]
- 10.Adwan H, Bauerle T, Najajreh Y, et al. Decreased levels of osteopontin and bone sialoprotein II are correlated with reduced proliferation, colony formation, and migration of GFP-MDA-MB-231 cells. Int J Oncol. 2004;24(5):1235–1234. [PubMed] [Google Scholar]
- 11.Tani-Ishii N, Tsunoda A, Umemoto T. Osteopontin antisense deoxyoligonucleotides inhibit bone resorption by mouse osteoclasts in vitro. J Periodontal Res. 1997;32(6):480–486. doi: 10.1111/j.1600-0765.1997.tb00563.x. [DOI] [PubMed] [Google Scholar]
- 12.Mukhopadhyay R, Price JE. Stable expression of antisense osteopontin inhibits the growth of human breast cancer cells. Proc Am Assoc Cancer Res, 90th Annual Meeting, Philadelphia, PA, April 10–14. 1999;40:448. [Google Scholar]
- 13.Gardner HA, Berse B, Senger DR. Specific reduction in osteopontin synthesis by antisense RNA inhibits the tumorigenicity of transformed Rat1 fibroblasts. Oncogene. 1994;9(8):2321–2326. [PubMed] [Google Scholar]
- 14.Su L, Mukherjee AB, Mukherjee BB. Expression of antisense osteopontin RNA inhibits tumor promoter-induced neoplastic transformation of mouse JB6 epidermal cells. Oncogene. 1995;10(11):2163–2169. [PubMed] [Google Scholar]
- 15.Behrend EI, Craig AM, Wilson SM, et al. Reduced malignancy of ras-transformed NIH 3T3 cells expressing antisense osteopontin RNA. Cancer Res. 1994;54(3):832–837. [PubMed] [Google Scholar]
- 16.Nemoto H, Rittling SR, Yoshitake H, et al. Osteopontin deficiency reduces experimental tumor cell metastasis to bone and soft tissues. J Bone Miner Res. 2001;16(4):652–659. doi: 10.1359/jbmr.2001.16.4.652. [DOI] [PubMed] [Google Scholar]
- 17.Wu Y, Denhardt DT, Rittling SR. Osteopontin is required for full expression of the transformed phenotype by the ras oncogene. Br J Cancer. 2000;83(2):156–163. doi: 10.1054/bjoc.2000.1200. [DOI] [PMC free article] [PubMed] [Google Scholar]
- 18.Rittling SR, Novick KE. Osteopontin expression in mammary gland development and tumorigenesis. Cell Growth Differ. 1997;8(10):1061–1069. [PubMed] [Google Scholar]
- 19.Furger KA, Menon RK, Tuck AB, et al. The functional and clinical roles of osteopontin in cancer and metastasis. Curr Mol Med. 2001;1(5):621–632. doi: 10.2174/1566524013363339. [DOI] [PubMed] [Google Scholar]
- 20.Tuck AB, Chambers AF. The role of osteopontin in breast cancer: clinical and experimental studies. J Mammary Gland Biol Neoplasia. 2001;6(4):419–429. doi: 10.1023/a:1014734930781. [DOI] [PubMed] [Google Scholar]
- 21.Rittling SR, Chambers AF. Role of osteopontin in tumor progression. BR J Cancer. 2004;90:1877–1881. doi: 10.1038/sj.bjc.6601839. [DOI] [PMC free article] [PubMed] [Google Scholar]
- 22.Cook AC, Tuck AB, McCarthy S, et al. Osteopontin induces multiple changes in gene expression that reflect the six ‘‘Hallmarks of Cancer’’ in a model of breast cancer progression. Mol Carcinogenesis. 2005;43:225–236. doi: 10.1002/mc.20105. [DOI] [PubMed] [Google Scholar]
- 23.Khodavirdi AC, Song Z, Yang S, et al. Increased expression of osteopontin contributes to the progression of prostate cancer. Cancer Res. 2006;66(2):883–888. doi: 10.1158/0008-5472.CAN-05-2816. [DOI] [PubMed] [Google Scholar]
- 24.McManus M, Sharp PA. Gene silencing in mammals by small interfering RNAs. Nat Revs. 2002;3:737–747. doi: 10.1038/nrg908. [DOI] [PubMed] [Google Scholar]
- 25.Medema RH. Optimizing RNA interference for application in mammalian cells. Biochem J. 2004;380(Pt 3):593–603. doi: 10.1042/BJ20040260. [DOI] [PMC free article] [PubMed] [Google Scholar]
- 26.Santner SJ, Dawson PD, Tait L, et al. Malignant MCF10CA1 celllines derived from premalignant human breast epithelial MCF10AT cells. Breast Cancer Res Treat. 2001;65:101–110. doi: 10.1023/a:1006461422273. [DOI] [PubMed] [Google Scholar]
- 27.Miller FR, Santner SJ, Tait L, et al. MCF10DCIS.com xenograft model of human comedo ductal carcinoma in situ. J Natl Cancer Inst. 2000;92(14):1185–1186. doi: 10.1093/jnci/92.14.1185a. [DOI] [PubMed] [Google Scholar]
- 28.Price JE, Polyzos A, Zhang RD, et al. Tumorigenicity and metastasis of human breast carcinoma cell lines in nude mice. Cancer Res. 1990;51:717–721. [PubMed] [Google Scholar]
- 29.Ellison G, Klinowska T, Westwood RF, et al. Further evidence to support the melanocytic origin of MDA-MB-435. Mol Pathol. 2002;55(5):294–299. doi: 10.1136/mp.55.5.294. [DOI] [PMC free article] [PubMed] [Google Scholar]
- 30.Ross DT, Scherf U, Eisen MB, et al. Systematic variation in gene expression patterns in human cancer cell lines. Nat Genet. 2000;24(3):227–235. doi: 10.1038/73432. [DOI] [PubMed] [Google Scholar]
- 31.Sellappan S, Grijalva R, Zhou X, et al. Lineage infedility of MDA-MB-435 cells. Cancer Res. 2004;64:3479–3485. doi: 10.1158/0008-5472.CAN-3299-2. [DOI] [PubMed] [Google Scholar]
- 32.Bautista DS, Xuan JW, Hota C, et al. Inhibition of Arg-Gly-Asp (RGD)-mediated cell adhesion to osteopontin by a monoclonal antibody against osteopontin. J Biol Chem. 1994;269(37):23280–23285. [PubMed] [Google Scholar]
- 33.Christensen B, Nielsen MS, Haselmann KF, et al. Post-translationally modified residues of native osteopontin are located in clusters: identification of 36 phosphorylation and five O-glycosylation sites and their biological implications. Biochem J. 2005;390:285–292. doi: 10.1042/BJ20050341. [DOI] [PMC free article] [PubMed] [Google Scholar]
- 34.Kon S, Maeda M, Segawa T, et al. Antibodies to different peptides in osteopontin reveal complexities in the various secreted forms. J Cell Biochem. 2000;77:487–498. [PubMed] [Google Scholar]
- 35.Editorial. Whither RNAi? Nat Cell Biol. 2003;5(6):489–490. doi: 10.1038/ncb0603-490. [DOI] [PubMed] [Google Scholar]
- 36.Sledz CA, Holko M, de Veer MJ, et al. Activation of the interferon system by short-interfering RNAs. Nat Cell Biol. 2003;5(9):834–839. doi: 10.1038/ncb1038. [DOI] [PubMed] [Google Scholar]
- 37.Naumov GN, MacDonald IC, Weinmeister PM, et al. Persistence of solitary mammary carcinoma cells in a secondary site: a possible contributor to dormancy. Cancer Res. 2002;62(7):2162–2168. [PubMed] [Google Scholar]
- 38.Shevde LA, Samant RS, Goldberg SF, et al. Suppression of human melanoma metastasis by the metastasis suppressor gene, BRMS1. Exp Cell Res. 2002;273(2):229–239. doi: 10.1006/excr.2001.5452. [DOI] [PubMed] [Google Scholar]
- 39.Piyathilake CJ, Frost AR, Manne U, et al. Differential expression of growth factors in squamous cell carcinoma and precancerous lesions of the lung. Clin Cancer Res. 2002;8(3):734–744. [PubMed] [Google Scholar]
- 40.Chang PL, Chambers AF. Transforming JB6 cells exhibit enhanced integrin-mediated adhesion to osteopontin. J Cell Biochem. 2000;78(1):8–23. [PubMed] [Google Scholar]
- 41.Furger KA, Allan AL, Wilson SM, et al. Beta(3) integrin expression increases breast carcinoma cell responsiveness to the malignancy-enhancing effects of osteopontin. Mol Cancer Res. 2003;1(11):810–819. [PubMed] [Google Scholar]
- 42.Noti JD. Adherence to osteopontin via alphavbeta3 suppresses phorbol ester-mediated apoptosis in MCF-7 breast cancer cells that overexpress protein kinase C-alpha. Int J Oncol. 2000;17(6):1237–1243. doi: 10.3892/ijo.17.6.1237. [DOI] [PubMed] [Google Scholar]
- 43.Takahashi F, Akutagawa S, Fukumoto H, et al. Osteopontin induces angiogenesis of murine neuroblastoma cells in mice. Int J Cancer. 2002;98(5):707–712. doi: 10.1002/ijc.10261. [DOI] [PubMed] [Google Scholar]
- 44.Hirama M, Takahashi F, Takahashi K, et al. Osteopontin overproduced by tumor cells acts as a potent angiogenic factor contributing to tumor growth. Cancer Lett. 2003;198(1):107–117. doi: 10.1016/s0304-3835(03)00286-6. [DOI] [PubMed] [Google Scholar]
- 45.Jessen KA, Liu SY, Tepper CG, et al. Molecular analysis of metastasis in a polyomavirus middle T mouse model: the role of osteopontin. Breast Cancer Res. 2004;6(3):R157–R169. doi: 10.1186/bcr768. [DOI] [PMC free article] [PubMed] [Google Scholar]
- 46.Mi Z, Guo H, Wai PY, et al. Differential osteopontin expression in phenotypically distinct subclones of murine breast cancer cells mediates metastatic behavior. J Biol Chem. 2004;279(45):46659–46667. doi: 10.1074/jbc.M407952200. [DOI] [PubMed] [Google Scholar]
- 47.Teramoto H, Castellone MD, Malek RL et al. (2004) Autocrine activation of an osteopontin-CD44-Rac pathway enhances invasion and transformation by H-RasV12. Oncogene. Nov 01; doi:10.1038/sj.onc.1208209 [DOI] [PubMed]
- 48.Wai PY, Kuo PC. The role of osteopontin in tumor metastasis. J Surg Res. 2004;121(2):228–241. doi: 10.1016/j.jss.2004.03.028. [DOI] [PubMed] [Google Scholar]
- 49.Khan SA, Lopez-Chua CA, Zhang J, et al. Soluble osteopontin inhibits apoptosis of adherent endothelial cells deprived of growth factors. J Biol Chem. 2002;85(4):728–736. doi: 10.1002/jcb.10170. [DOI] [PubMed] [Google Scholar]