Abstract
Injection of carrageenan 1% (50 μl) in the mouse paw causes a biphasic response: an early inflammatory response that lasts 6 h and a second late response that peaks at 72 h, declining at 96 h. Only mice 7- or 8-week old, weighing 32–34 g, displayed a consistent response in both phases.
In 8-week-old mice, myeloperoxidase (MPO) levels are significantly elevated in the early phase at 6 h and reach their maximum at 24 h to decline to basal value at 48 h. Nitrate+nitrite (NOx) levels in the paw are maximal after 2 h and slowly decline thereafter in contrast to prostaglandin E2 levels that peak in the second phase at the 72 h point.
Western blot analysis showed that inducible nitric oxide synthase (iNOS) is detectable at 6 h and cyclooxygenase 2 (COX-2) at 24 h point, respectively. Analysis of endothelial nitric oxide synthase (eNOS), iNOS and COX-2 expression at 6 and 24 h in 3–8-week-old mice demonstrated that both eNOS and iNOS expressions are dependent upon the age–weight of mice, as opposite to COX-2 that is present only in the second phase of the oedema and is not linked to mouse age–weight.
Subplantar injection of carrageenan to C57BL/6J causes a biphasic oedema that is significantly reduced by about 20% when compared to CD1 mice. Interestingly, in these mice, iNOS expression is absent up to 6 h, as opposite to CD1, and becomes detectable at the 24 h point. Cyclooxygenase (COX-1) expression is upregulated between 4 and 24 h after carrageenan injection, whereas in CD1 mice COX-1 remains unchanged after irritant agent injection. MPO levels are maximal at the 24 h point and they are significantly lower, at 6 h point, than MPO levels detected in CD1 mice.
In conclusion, mouse paw oedema is biphasic and age-weight dependent. The present results are the first report on the differential expressions of eNOS, iNOS, COX-1 and COX-2 in response to carrageenan injection in the two phases of the mouse paw oedema.
Keywords: Mouse, age, paw oedema, eNOS, iNOS, COX-1, COX-2
Introduction
Acute inflammatory response is characterized by an increase in vascular permeability and cellular infiltration leading to oedema formation, as a result of extravasation of fluid and proteins and accumulation of leukocytes at the inflammatory site. Carrageenan-induced rat paw oedema is a widely used test to determine the anti-inflammatory activity, and it has been fully characterized in the past (Di Rosa et al., 1971a, 1971b; 1972, Garcia Leme et al., 1973). More recently, it has been shown that COX-2 reaches maximal expression 1 h from carrageenan local injection (Nantel et al., 1999). Mouse paw oedema has been increasingly used to test new anti-inflammatory drugs as well as to study the mechanisms involved in inflammation. In literature, there are about 400 papers where mouse paw oedema has been used. From an analysis of the current literature, we found that there are mainly three method papers that are widely quoted, that are Levy (1969); Sugishita et al. (1981); Henriques et al. (1987). In 1969, Levy described that injection of carrageenan 1% in the mouse paw causes an oedema similar, as time course, to the rat, but less powerful in proportion. About 12 years later, Sugishita et al. (1981) further characterized the acute phase of mouse paw oedema using carrageenan 3%. In 1987, Henriques and co-workers showed that carrageenan injection into the mouse paw induces a biphasic oedema. The first phase is characterized by an oedema of little intensity and unrelated to the dose of carrageenan used, while the second phase develops after 24 h, displaying a more pronounced oedema with a maximum effect between 48 and 72 h. More recently, it has been shown that carrageenan 1% induces a marked powerful oedema in BALB/c mice, but in this case only the second phase has been shown (Ianaro et al., 1994). Thus, at the present stage, the most widely used methods are those described by Levy (1969) and Sugishita et al. (1981).
There are several mediators involved in inflammation. Histamine, serotonine, bradykinin and prostaglandins (PG) are involved in the increased vascular permeability. Another important mediator in acute inflammation is nitric oxide (NO) which is produced in physiopathological conditions by three distinct isoforms of nitric oxide synthase (NOS): endothelial NOS (eNOS), neuronal NOS (nNOS) and inducible NOS (iNOS) (Moncada & Higgs, 1991). At the site of inflammation, NO is formed by a number of different cells, including leukocytes, endothelial cells and sensory nerve cells (Handy & Moore, 1998). Following the increase in vascular permeability, there is cell infiltration, mainly neutrophils (in the acute phase), that contributes to the inflammatory response by producing, among other mediators, oxygen-derived free radicals such as superoxide anion (O2−) and hydroxyl radicals (Fantone & Ward, 1982). Myeloperoxidase tissue levels are a well-standardized marker of neutrophil infiltration in tissue, and have been clearly shown to correlate with the disease severity. Carrageenan-induced rat paw oedema displays all these biochemical and cellular features that have been clearly described in the past and constantly updated following new discoveries. Here, we have fully analysed both phases following local carrageenan 1% administration in Swiss CD1 and C57BL/6J mice paw, by taking in account the age–weight of mice as well as the role of eNOS, iNOS, COX-1 and COX-2, by measuring both the protein expression and the production of nitric oxide (NO) and PGE2, respectively. Cellular infiltration was evaluated by assessing MPO levels.
Methods
Mouse paw oedema
Male Swiss mice (CD-1; Charles River, Italy) from 3-week-old (15.6±0.2 g), 4-week-old (21.8±0.6 g), 5-week-old (28.1±0.3 g), 6-week-old (30.1±0.6 g), 7-week-old (32.5±0.4 g) and 8-week-old (34.5±0.6 g), and male C57BL/6J mice (Charles River, Italy) 8-week-old (26.6±0.4 g), were divided into groups (n=10 each group) and lightly anaesthetized with enflurane 4% mixed with O2, 0.5 l min−1, N2O 0.5 l min−1. Each group of animals received subplantar administration of 50 μl of saline or 50 μl of carrageenan 1% (w v−1) in saline (Henriques et al., 1987; Calhoun et al., 1987). The paw was marked in order to immerge it always at the same extent in the measurement chamber. The volume was measured by using a hydropletismometer specially modified for small volumes (Ugo Basile, Milan, Italy; Bucci et al., 2000) immediately before subplantar injection, and 2, 4, 6, 24, 48, 72 and 96 h thereafter. The assessment of paw volume was performed always in double blind and by the same operator. The increase in paw volume was calculated by subtracting the initial paw volume (basal) to the paw volume measured at each time point.
MPO measurement
Mice from different groups were killed with carbon dioxide at 2, 4, 6, 24, 48, 72 and 96 h after carrageenan administration, and the paws were weighed, cut and homogenated in 1 ml of hexadecyltrimethylammonium bromide (HTAB) buffer containing 5 g HTAB in 1L potassium phosphate buffer 50 mM, pH 6.0. (Bradley et al., 1982) using a Polytron homogenizer (two cycles of 10 s at maximum speed). After centrifugation at 10,000 r.p.m. for 2 min, supernatant fractions were assayed for MPO activity, as an index of cellular migration, using the method described by Bradley et al. (1982). Samples (20 μl) were mixed with phosphate buffer (180 μl) containing 1 mM O-dianisidine dyhydrochloride and 0.001% hydrogen peroxide in a microtiter plate. Absorbance was measured at 450 nm, taking three readings at 30-s intervals. Calculation of units of MPO was realized considering that 1 U MPO=1 μmol H2O2 split and 1 μmol H2O2 gives a change in absorbance of 1.13 × 10⁻² (change in absorbance=nm min−1).
NOx and PGE2 exudate levels
Mice from different groups were killed with carbon dioxide 2, 4, 6, 24, 48, 72 and 96 h after carrageenan administration. Paws were cut and centrifuged at 4000 r.p.m. for 30 min. Exudates (supernatants) were collected with 100 μl of saline and were used for NOx (nitrite plus nitrate) and PGE2 quantification. To determine NOx levels, exudates were deproteinized with ZnSO4 30% for 15 min (Thomsen et al., 1990). Supernatants and a standard curve of sodium nitrate were incubated in a microplate with cadmium (50 mg well−1) for 1 h to convert NO3− to NO2− (Thomsen et al., 1990). After centrifugation at 14,000 r.p.m. for 15 min, total nitrite (NOx) content was determined fluorometrically in microtiter plates using a standard curve of sodium nitrite (Misko et al., 1993). NOx content was calculated by using the internal standard curve. PGE2 levels were determined in deproteinized exudate by radioimmunoassay (Sautebin et al., 1999).
Western blot analysis
Carrageenan-injected and saline-injected paws from mice of different ages and at different time points were homogenized in a 10 mM HEPES pH 7.4. buffer containing saccharose (0.32 M), EDTA (100 μM), dithiothreitol (1 mM), phenylmethylsulphonyl fluoride (1 mg ml−1) and leupeptin (10 μg ml−1) (Knowles and Moncada, 1994), using a Polytron homogenizer (three cycles of 10 s at maximum speed). After centrifugation at 3000 r.p.m. for 15 min, protein supernatant content was measured by Bradford reagent, and protein concentration was adjusted at 1 μg ml−1. Protein samples (50 μg) were loaded on 10% SDS–PAGE and transferred onto nitrocellulose membranes for 45 min at 250 mA. Membranes were blocked in PBS-Tween 20 (0.1%) containing 5% nonfat milk and 0.1% BSA for 30 min at 4°C. Membranes were washed with PBS-Tween 20 (0.1%) at 5-min intervals for 30 min, and incubated with anti-COX1, anti-COX-2, anti-iNOS or anti-eNOS polyclonal antibody (dilution 1 : 1000 in all cases) overnight at 4°C. For COX-1 detection, blots were washed with PBS-Tween 20 (0.1%) at 5-min intervals for 30 min and incubated with HRP-anti-goat IgG (1 : 10,000) for 2 h at 4°C. For COX-2 detection, blots were washed with PBS-Tween 20 (0.1%) at 5-min intervals for 30 min and incubated with HRP-anti-rabbit IgG (1 : 10,000) for 2 h at 4°C. For iNOS and eNOS detection, blots were washed with PBS-Tween 20 (0.1%) at 5-min intervals for 30 min and incubated with HRP-anti-mouse IgG (1 : 10,000) for 2 h at 4°C. The immunoreactive bands were visualized using an enhanced chemiluminescence system (ECL; Amersham Pharmacia Biotech, U.S.A.), according to the manufacturer's instructions.
Drugs and reagents
Bradford reagent was from Bio-Rad (Bio-Rad Laboratories, Segrate, Milan, Italy). [3H-PGE2] was from NEN Du Pont (Milan, Italy). Nitrocellulose membranes were from Protran, Schleicher & Schuell (Germany). The antibody against PGE2 was kindly given by Professor Ciabattoni, Chieti University, Italy. The antibody against COX-1 was from Santa Cruz Biotechnology, Inc (Milan, Italy). The antibody against COX-2 was from Cayman-Chemical (U.S.A.). The antibodies against eNOS or iNOS were from Transduction Laboratory (U.S.A.). The HRP-conjugated IgG antibodies were purchased from Dako (Copenhagen, Denmark). All other reagents and compounds used were obtained from Sigma-Aldrich (Milan, Italy).
Statistical analysis
Data are expressed as mean±s.e.m. The level of statistical significance was determined by one-way analysis of variance (ANOVA) followed by Bonferroni's t-test for multiple comparisons, using the GraphPad Prism software.
Results
Mouse paw oedema
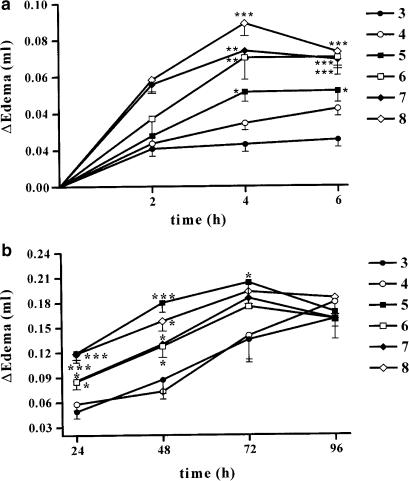
In order to determine if the development of the oedema is dependent upon mouse age–weight, we tested the effect of carrageenan in different groups of mice ageing 3, 4, 5, 6, 7 and 8 weeks. In the first phase (0–6 h), injection of carrageenan induced a substantial oedema in mice 6-, 7- or 8-week-old (weighing 30.1±0.6–34.5±0.6 g), which was significantly lower in mice 3 (15.6±0.2 g), 4 (21.8±0.6 g) and 5 (28.1±0.3 g)-week old (Figure 1a). In the second phase (24–96 h,) no differences were found among groups of animals ageing from 5 to 8 weeks, whereas mice 3- and 4-week old displayed a significant reduced response to carrageenan (Figure 1b). From the analysis of the data as area under the curve, it appears clear that mice 3 (15.6±0.29 g) or 4 (21.8±0.69 g)-week old display a significant lower oedema formation.
Figure 1.
Mouse paw oedema is biphasic and age dependent. Panel (a) shows the first phase (0–6 h) of the carrageenan-induced paw oedema in CD1 mice from 3- to 8-week old. Panel (b) shows the second phase of the carrageenan-induced paw oedema in mice from 3- to 8-week old (24–96 h). Values are means±s.e.m. (n=6–10). ***P<0.001, **P< 0.01, *P<0.05 compared to the 3-week-old group mice.
MPO activity in the mouse paw
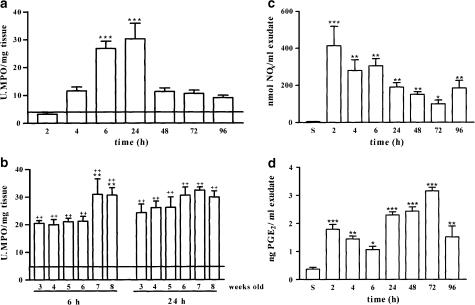
In order to evaluate neutrophil infiltration first, we studied the time course of MPO activity in response to carrageenan injection in mice 8-week old. Our results showed that injection of irritant agent induced an increase in MPO activity that peaked between 6 and 24 h after carrageenan administration (Figure 2a). For this reason, these two time points were selected to study the MPO activity. MPO activity was detectable in both carrageenan-injected and saline-injected paws of animals from 3- to 8-week old, the basal levels of MPO activity being similar in all groups studied (Figure 2b, solid line). In the first phase of the oedema (6 h), MPO levels measured in injected paws of mice from 3- to 6-week old were significantly smaller than MPO activity detected in injected paws of mice 7- or 8-week old. However, in the second phase (24 h), no significant differences were found among all the groups studied (Figure 2b), suggesting that in the second phase cellular migration is independent of animal age.
Figure 2.
MPO activity and NOx and PGE2 levels measured in paw homogenates from saline- and carrageenan-injected paws of CD1 8-week-old mice. Panel (a) shows the time dependence of MPO activity in 8-week-old CD1 mice that peaks at 6 h and remains elevated up to 24 h. The solid line represents basal MPO activity detected in saline-injected paws from the different groups studied (4.74±0.45 U MPO mg−1 wet tissue). Panel (b) shows MPO values at 6 and 24 h in 3–8-week-old CD1 mice. Panels (c) and (d) show the time dependence of NOx and PGE2 production, respectively, in response to both saline (S) and carrageenan injection. For panels (a) and (b), values are mean±s.e.m. (n=6–10). **P< 0.01, in comparison to the 3-week-old mice; ++P<0.01 in comparison to the basal levels (solid line). For panels (c) and (d), values are mean±s.e.m. (n=6–10). ***P<0.001, **P< 0.01, *P<0.05 in comparison to the saline-injected group.
NOx and PGE2 levels in paw exudates
To further characterize this model, 8-week-old mice were killed at 2, 4, 6, 24, 48, 72 and 96 h. Carrageenan-injected and saline-injected paws were cut and centrifuged at 4000 r.p.m. for 30 min. Supernantants were collected and deproteinized with ZnSO4 30% and used to evaluate NOx and PGE2 content. Carrageenan administration caused an increase in NOx production that was maximal at the 2 h point (Figure 2c). In the second phase, NOx levels were always lower than in the first phase (Figure 2c). PGE2 levels in the first phase were maximal at the 2 h point, while in the second phase peaked at 72 h point (Figure 2d).
Time course of eNOS, iNOS, COX-1 and COX-2 expression in CD1 mice 8-week old
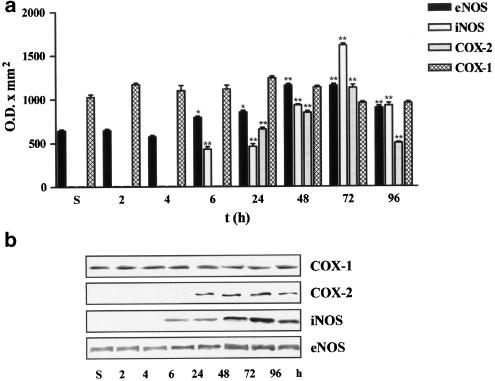
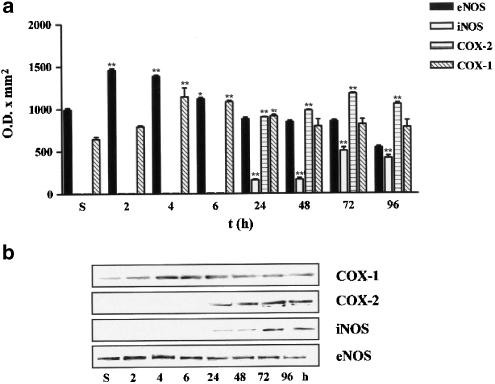
To determine which are the isoforms of NOS and COX implicated in NOx and PGE2 production, expressions of eNOS (140 kDa), iNOS (130 kDa), COX-1 (70 kDa) and COX-2 (72 kDa) were studied in homogenates of carrageenan-injected and saline-injected paws from 8-week-old mice killed at 2, 4, 6, 24, 48, 72 and 96 h after treatment. Carrageenan injection did not modify eNOS protein expression at 2 and 4 h. However, there was a gradual increase in eNOS protein expression that peaked between 48 and 72 h (Figure 3). As it was expected, iNOS protein expression was not detectable in saline-injected paws of CD1 mice, whereas injection of carrageenan induced the expression of iNOS which started to be detectable at 6 h and progressively increased peaking at 72 h (Figure 3). The constitutive isoform of cyclooxygenase (COX-1) was detected in saline as well as in carrageenan-injected paws; expression levels of this protein were not modified after carrageenan injection (Figure 3). The inducible isoform of cyclooxygenase (COX-2) was not detectable in the first phase of oedema development while, in the second phase, its expression was detected at 24 h and peaked at 72 h point (Figure 3).
Figure 3.
Time course of eNOS, iNOS, COX-1 and COX-2 expression in saline-injected (s) and carrageenan-injected paws of CD1 mice 8-week old. Panel (a) shows the densitometric analysis, while panel (b) shows a blot representative of three separate experiments. Values are mean±s.e.m. (n=3). ***P<0.001, **P<0.01, *P<0.5 in comparison to the saline-injected group.
Age dependence of eNOS, iNOS and COX-2 expression in CD1 mice
To study the age dependence of eNOS, iNOS and COX-2 expression in CD1 mice, we selected two representative time points of each phase of the oedema development. We chose 6 h since this is the single time point where eNOS protein was overexpressed in a significant manner in the first phase. Besides, at 6 h, MPO activity was also significantly higher than basal levels, indicating an increased infiltration of cells into the damaged tissue. Concerning the second phase, we chose 24 h since eNOS, iNOS and COX-2 proteins were all detectable as well as, only at this time point, MPO activity was significantly higher than basal levels.
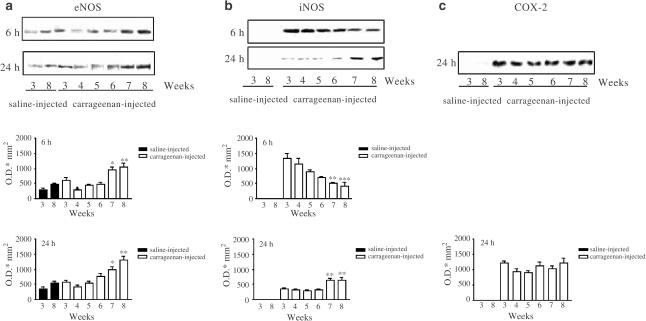
Basal levels of eNOS expression, detected in control paws, showed that the youngest mice 3-week-old exhibited a reduced expression of this protein when compared to 8-week-old mice (Figure 4a). Carrageenan injection induces an overexpression of eNOS at 6 h (Figure 4a) as well as at 24 h (Figure 4a) in 7- or 8-week-old mice.
Figure 4.
Age dependence of eNOS, iNOS and COX-2 expression in saline-injected and carrageenan-injected paws of 3–8-week-old CD1 mice at 6 and 24 h. Panel (a) shows eNOS expression (representative blot) together with the relative densitometric analysis at the two time points considered. Panel (b) shows iNOS expression (representative blot) and densitometric analysis, while panel (c) shows COX-2 expression and densitometric analysis at 24 h only, since at 6 h COX-2 is not detectable. The figures are representative of three separate experiments. Values are mean±s.e.m. (n=3). ***P<0.001, **P<0.01 in comparison to the carrageenan-injected 3-week-old group.
In control paws, iNOS was not detectable, whereas injection of carrageenan induced the expression of this protein in all groups studied both at 6 and at 24 h (Figure 4b). Densitometric analysis showed that, in the first phase of the oedema, iNOS protein expression decreased in an age–weight-dependent manner, whereas, in the second phase, increased in an age–weight-dependent manner (Figure 4b).
Cyclooxygenase 2 expression, studied in homogenates of carrageenan-injected and saline-injected paws, was not detectable in samples obtained up to 6 h after carrageenan or vehicle administration, whereas, in the second phase of the oedema formation (24 h), was similar in all groups studied (Figure 4c).
C57BL/6J mice
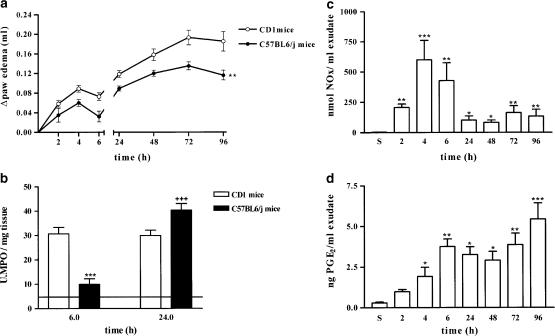
The inflammatory response to carrageenan was also studied in C57BL/6J mice 8-week old. In Figure 5a, the development of oedema in response to carrageenan injection in CD1 and C57BL/6J mice 8-week old is shown; both strains of animals developed a biphasic oedema, but C57BL/6J showed a significantly reduced oedema formation in response to carrageenan. In Figure 5b, MPO levels detected in injected paws of CD1 and C57BL/6J mice 8-week old are shown. Carrageenan injection in C57BL/6J mice induced an increase in MPO activity, which was time dependent, peaking at 24 h. Conversely, as we have previously described, injection of carrageenan in CD1 mice induced an increase in MPO activity reaching a plateau between 6 and 24 h.
Figure 5.
Development of carrageenan-induced oedema in C57BL/6J mice 8 weeks old compared with CD1 mice is shown in panel (a). Panel (b) shows MPO activity measured in the carrageenan-injected paw of CD1 and C57BL/6J mice 8-week-old at 6 and 24 h after carrageenan injection. The continuous line represents basal values detected in saline-injected paws of C57BL/6J and CD1 mice since no difference were found between the two strains studied. Panel (c) shows the time-dependence of NOx production, while panel (d) shows the time dependence of PGE2 production in paw homogenate in response to saline (S) and carrageenan injection. For panels (a) and (b), values are mean±s.e.m. (n=6–10). ***P<0.001 in comparison with CD1 MPO values at 6 h, +++P<0.01 in comparison with C57BL/6J MPO values at 6 h. For panels (c) and (d), values are mean±s.e.m. (n=6–10). ***P<0.001, **P<0.01, *P<0.5 in comparison with the time saline group.
Next, we have also evaluated NOx and PGE2 levels in paw exudates of C57BL/6J mice as well as the time course of eNOS, iNOS, COX-1 and COX-2 expression in response to carrageenan injection.
Administration of irritant agent into the C57BL/6J mouse paw induced an increase in NOx production that peaked at 4 h and decreased at the 24 h point, remaining at the same level up to the 96 h point (Figure 5c). Levels of PGE2 were significantly enhanced 4 h after carrageenan injection and reached a plateau at 96 h (Figure 5d). On the other hand, studies on protein expression in mouse paws showed that expression of eNOS peaked between 2 and 4 h, decreasing thereafter (Figure 6), showing a different eNOS expression profile when compared to CD1 mice (Figure 3). Carrageenan injection induced a significant increase in COX-1 protein expression between 4 and 24 h after irritant agent injection, in comparison to the saline-injected group (Figure 6). Inducible isoforms of iNOS and COX-2 were detected 24 h after carrageenan injection, developing a similar profile to CD1 mice with a maximal level of expression at the 72 h point (Figure 6).
Figure 6.
Time course of eNOS, iNOS, COX-1 and COX-2 expression and densitometric analysis of saline-injected and carrageenan-injected paws of C57BL/6J mice 8-week old. The figures are representative of three similar experiments. Values are mean±s.e.m. (n=3). ***P<0.001, **P<0.01, *P<0.05 in comparison to the saline group.
Discussion
Carrageenan mouse paw oedema has been partially characterized and described in three different papers (Levy, 1969; Sugishita et al., 1981; Henriques et al., 1987), and several nonsteroidal anti-inflammatory drugs have been shown to be active in the mouse model at the same extent as in the rat model (Calhoun et al., 1987). In the majority of the papers published, when a new substance, with a potential anti-inflammatory activity, has been studied in the mouse paw oedema, the protocol described by Levy (1969) or Sugishita et al. (1981) has been followed. Thus, at the present stage, much confusion is generated by the fact that there are many papers where only one phase is considered either the first (for example, Njamen et al., 2003) or the second (for example, Wu et al., 2002) and different doses of carrageenan are used. In addition, depending upon the protocol followed, carrageenan 1% (Levy, 1969; Henriques et al., 1987) or carrageenan 3% (Sugishita et al., 1981) is used. The final outcome is that data obtained are not comparable either for the dose of carrageenan used or for the phase studied or for the mouse strain selected.
The present study has been performed using the dose of carrageenan that gives the maximal oedema in both phases according to Henriques et al. (1987). The results obtained indicate that the weight and age of mice are a critical issue. Indeed, only 7- or 8-week-old mice (32–35 g) respond with a consistent inflammatory pattern to carrageenan, displaying a biphasic oedema that develops in the first 6 h, followed by a second phase that starts at 24 h. Thus, the finding that, following carrageenan subplantar injection, there was a weak and unrelated oedema in the first phase is to be ascribed to the age–weight of mice used, that is, 20 g, corresponding approximately to 4–5 weeks of age (Henriques et al., 1987). This is confirmed by our study where we have clearly shown that mice 3-, 4- and 5-week old, in the early phase, develop very little oedema. Measurement of MPO levels showed that cell infiltration peaks between 6 and 24 h in all groups. These data suggest that, at the 6 h point, even though the paw volume is reduced, there is a consistent cell infiltration that is kept at the same level up to 24 h. MPO levels are dependent upon mouse age–weight in the acute early phase, only. Indeed, in the acute phase (first phase), MPO levels were consistently lower in mice 3-, 4-, 5-week old when compared to older mice (7-, 8-week old). Interestingly, in the second phase, there were no significant differences among the different age groups.
Next, we determined NOx and PGE2 levels in 8-week-old mouse paw where both oedema phases are consistently present. In the rat model, PGE2 is clearly playing a key role and both eNOS and iNOS play a role in the early and late phases, respectively (Salvemini et al., 1996; Handy & Moore, 1998; Omote et al., 2001). In the mouse model, NOx levels peaked at 2 h, slowly declining thereafter. NOx levels in the first phase were clearly produced by eNOS, as demonstrated by the Western blot studies showing that iNOS is absent up to 6 h. PGE2 in the first phase, up to 6 h, was produced by COX-1 since COX-2 was undetectable up to the 6 h point. PGE2 levels peaked at 2 h in the first phase, followed by a second peak, in the second phase, at the 72 h point. Thus, NO levels are driven by eNOS in the acute part of this oedema, while they are produced by both iNOS and eNOS in the second phase. Similarly, PGE2 are produced by COX-1 in the first phase, while COX-2-derived PGE2 became involved in the second phase.
MPO is considered a hallmark of cell infiltration (mainly neutrophils) in inflammation. MPO levels peak at 6 and are sustained up to 24 h. Thus, the two key time points of this oedema are 6 and 24 h; indeed, at these time points, it is also possible to monitor eNOS, iNOS and COX-2.
eNOS basal levels was significantly increased, by carrageenan, in 7- or 8-week-old mice both at 6 and 24 h. Conversely, iNOS levels at the 6 h point (first phase) were significantly lower in mice ageing 7 or 8 weeks, when compared to 3-, 4-, 5-week-old mice. At the 24 h point (second phase), iNOS levels were significantly higher in 7- or 8-week-old mice when compared to 3–6-week-old mice, similar to eNOS. These data suggest that in mice there is a much more complex regulation of NO production when compared to PGs. Indeed, in the acute phase, there is only COX-1 which is not overexpressed after carrageenan injection, whereas in the second phase COX-2 protein becomes detectable 24 h after irritant agent administration. Conversely, NO release is regulated by both iNOS and eNOS that are both upregulated during the development of the oedema. Thus, by using 7- or 8-week-old CD1 mice, it is possible to clearly study the role of iNOS, eNOS, COX-1 and COX-2 in vivo in the mouse paw.
Since differences between the entity and the onset of the oedema have been described depending on the mouse strain used, we investigated the oedema caused by carrageenan in C57BL/6J mice. The reason behind this choice is that these mice are widely used as background mice to produce genetic engineered mice. Subplantar injection of carrageenan to C57BL/6J caused an oedema that is significantly reduced by about 20%, when compared to CD1 mice. Interestingly, in these mice, iNOS is absent up to 6 h, as opposite to CD1 where iNOS is already detectable at the 6 h point. Similarly, carrageenan injection induces a significant increased expression of COX-1 between 4 and 24 h afterwards, as opposite to CD1 mice. Besides, MPO levels were maximal at the 24 h point in C57BL/6J, while at the 6 h point they were lower than MPO levels detected in CD-1 mice. Thus, there are clear differences in oedema formation, enzyme distribution and regulation linked to the mouse strain used.
Our results clearly show that the mouse paw oedema is biphasic, as opposite to the rat oedema that displays only an acute phase. In addition, the present results are the first report on the different expression of eNOS, iNOS, COX-1 and COX-2 in response to carrageenan injection in mouse paw oedema related to the age and to the phase of the oedema formation. In conclusion, in order to obtain reproducible results, it is necessary to use mice 7- or 8-week old, that is, weighing more than 30 g. Furthermore, when a new strain of mice is used, it should be taken into account that enzyme distribution and mediator onset may change consistently.
Acknowledgments
Inmaculada Posadas is a post-doctoral fellow from Ministerio de Educacion, Ciencia y Deporte (MECD) of Spain.
Abbreviations
- BSA
bovine serum albumin
- COX-1
cyclooxygenase 1
- COX-2
cyclooxygenase 2
- NOx
nitrate+nitrite
- eNOS
endothelial nitric oxide synthase
- ECL
enhanced chemiluminescence system
- HTAB
hexadecyltrimethylammonium bromide
- iNOS
inducible nitric oxide synthase
- MPO
myeloperoxidase
- nNOS
neuronal nitric oxide synthase
- NO
nitric oxide
- PBS
phosphate buffer saline
- PGE2
prostaglandin E2
References
- BRADLEY P.P., PRIEBAT D.A., CHRISTENSEN R.D., ROTHSTEIN G. Measurement of cutaneous inflammation: estimation of neutrophils content with an enzyme marker. J. Invest. Dermatol. 1982;78:206–209. doi: 10.1111/1523-1747.ep12506462. [DOI] [PubMed] [Google Scholar]
- BUCCI M., ROVIEZZO F., CICALA C., SESSA W.C., CIRINO G. Geldanamicyn, an inhibitor of heat shock protein 90 (Hsp90) mediated signal transduction has anti-inflammatory effects and interacts with glucocorticoid receptor in vivo. Br. J. Pharmacol. 2000;131:13–16. doi: 10.1038/sj.bjp.0703549. [DOI] [PMC free article] [PubMed] [Google Scholar]
- CALHOUN W., CHANG J., CARLON R.P. Effect of selected antiinflammatory agents and other drugs on zymosan, arachidonic acid, PAF and carrageenan induced paw edema in mouse. Agent Actions. 1987;21:306–309. doi: 10.1007/BF01966499. [DOI] [PubMed] [Google Scholar]
- DI ROSA M. Biological properties of carrageenan. J. Pharm. Pharmacol. 1972;24:89–102. doi: 10.1111/j.2042-7158.1972.tb08940.x. [DOI] [PubMed] [Google Scholar]
- DI ROSA M., GIROUD J.P., WILLOUGHBY D.A. Studies on the mediators of the acute inflammatory response induced in rats in different sites by carrageenan and turpentine. J. Pathol. 1971a;104:15–29. doi: 10.1002/path.1711040103. [DOI] [PubMed] [Google Scholar]
- DI ROSA M., PAPADIMITRIOU J.M., WILLOUGHBY D.A. A histopathological and pharmacological analysis of the mode of action of nonsteroidal anti-inflammatory drugs. J. Pathol. 1971b;105:239–256. doi: 10.1002/path.1711050403. [DOI] [PubMed] [Google Scholar]
- FANTONE J.C., WARD P.A. Role of oxygen-derived free radicals and metabolites in leukocyte-dependent inflammatory reactions. Am. J. Phatol. 1982;107:395–418. [PMC free article] [PubMed] [Google Scholar]
- GARCIA LEME J., HAMAMURA L., LEITE M.P., ROCHA E SILVA M. Pharmacological analysis of the acute inflammatory process induced in the rat's paw by local injection of carrageenin and by heating. Br. J.Pharmacol. 1973;48:88–96. doi: 10.1111/j.1476-5381.1973.tb08225.x. [DOI] [PMC free article] [PubMed] [Google Scholar]
- HANDY R.L., MOORE P.K. A comparison of the effects of L-NAME, 7NI, and L-NIL on carrageenan-induced hindpaw oedema and NOS activity. Br.J.Pharmacol. 1998;123:1119–1126. doi: 10.1038/sj.bjp.0701735. [DOI] [PMC free article] [PubMed] [Google Scholar]
- HENRIQUES M.G.M.O., SILVA P.M.R., MARTINS M.A., FLORES C.A., CUNHA F.Q., ASSREUY-FILHO J., CORDEIRO R.S.B. Mouse paw oedema. A new model for inflammation. Braz. J. Med. Biol. Res. 1987;20:243–249. [PubMed] [Google Scholar]
- IANARO A., O'DONNELL C.A., DI ROSA M., LIEW F.Y. A nitric oxide inhibitor reduces inflammation, down regulates inflammatory cytokines and enhances interleukin-10 production in carrageenin-induced oedema in mice. Immunology. 1994;82:370–375. [PMC free article] [PubMed] [Google Scholar]
- KNOWLES R.G., MONCADA S. Nitric oxide synthases in mammals. Biochem. J. 1994;298:833–836. doi: 10.1042/bj2980249. [DOI] [PMC free article] [PubMed] [Google Scholar]
- LEVY L. Carrageenan paw oedema in the mouse. Life Sci. 1969;8:601–606. doi: 10.1016/0024-3205(69)90021-6. [DOI] [PubMed] [Google Scholar]
- MISKO T.P., SCHILLING R.J., SALVEMINI D., MOORE W.M., CURRIE M.G. A fluorometric assay for the measurement of nitrite in biological samples. Anal. Biochem. 1993;214:11–16. doi: 10.1006/abio.1993.1449. [DOI] [PubMed] [Google Scholar]
- MONCADA S., HIGGS E.A. Endogenous nitric oxide: physiology, pathology and clinical relevance. Eur. J. Clin. Invest. 1991;21:361–374. doi: 10.1111/j.1365-2362.1991.tb01383.x. [DOI] [PubMed] [Google Scholar]
- NANTEL F., DENIS D., GORDON R., NORTHEY A., CIRINO M., METTERS K.M., CHAN C.C. Distribution and regulation of cyclooxygenase-2 in carrageenan-induced inflammation. Br. J. Pharmacol. 1999;128:853–859. doi: 10.1038/sj.bjp.0702866. [DOI] [PMC free article] [PubMed] [Google Scholar]
- NJAMEN D., TALLA E., MBAFOR J.T., FOMUM T.F., KAMANYI A., MBANYA J.-C., CERDA-NICOLAS M., GINER R.M., RECIO C.M., RIOS J.L. Anti-inflammatory activity of erycristagallin a pterocarpene from Erythrina mildbraedii. Eur. J. Pharmacol. 2003;468:67–74. doi: 10.1016/s0014-2999(03)01664-9. [DOI] [PubMed] [Google Scholar]
- OMOTE K., HAZAMA K., KAWAMATA T., NAKAYAKA Y., TORIYABE M., NAMIKI A. Peripheral nitric oxide in carrageenan-induce inflammation. Brain Res. 2001;912:171–175. doi: 10.1016/s0006-8993(01)02733-0. [DOI] [PubMed] [Google Scholar]
- SALVEMINI D., WANG Z.Q., WYATT P.S., BOURDON D.M., MARINO M.H., MANNING P.T., CURRIE M.G. Nitric oxide: a key mediator in the early and late phase in carrageenan-induced rat paw inflammation. Br.J.Pharmacol. 1996;118:829–838. doi: 10.1111/j.1476-5381.1996.tb15475.x. [DOI] [PMC free article] [PubMed] [Google Scholar]
- SAUTEBIN L., IANARO A., ROMBOLA L., IALENTI A., SALA A., DI ROSA M. Cyclooxygenase-2-dependent generation of 8-epiprostaglandin F2alpha by lipopolysaccharide-activated J774 macrophages. Inflamm. Res. 1999;48:503–508. doi: 10.1007/s000110050494. [DOI] [PubMed] [Google Scholar]
- SUGISHITA E., AMAGAYA S., OGIHARA Y. Anti-inflammatory testing methods: comparative evaluation of mice and rats. J. Pharmacobiodyn. 1981;8:565–575. doi: 10.1248/bpb1978.4.565. [DOI] [PubMed] [Google Scholar]
- THOMSEN L.L., CHING L.M., BAGULEY B.C. Evidence for the production of nitric oxide by activated macrophages treated with the antitumor agents flavone-8-acetic acid and xanthenone-4-acetic acid. Cancer Res. 1990;50:6966–6970. [PubMed] [Google Scholar]
- WU W.P., HAO J.-X., HALLDNER-HENRIKSSON L., XU X.-J., JACOBSON M.A., WIESENFELD-HALLIN Z., FREDHOLM B.B. Decreased inflammatory pain due to reduced carrageenan-induced inflammation in mice lacking adenosine A3 receptors. Neuroscience. 2002;114:523–527. doi: 10.1016/s0306-4522(02)00273-7. [DOI] [PubMed] [Google Scholar]


