Abstract
Microvascular endothelial cells (MVECs) form a barrier between circulating metabolites, such as adenosine, and the surrounding tissue. We hypothesize that MVECs have a high capacity for the accumulation of nucleosides, such that inhibition of the endothelial nucleoside transporters (NT) would profoundly affect the actions of adenosine in the microvasculature.
We assessed the binding of [3H]nitrobenzylmercaptopurine riboside (NBMPR), a specific probe for the inhibitor-sensitive subtype of equilibrative NT (es), and the uptake of [3H]formycin B (FB), by MVECs isolated from rat skeletal muscle. The cellular expression of equilibrative (ENT1, ENT2, ENT3) and concentrative (CNT1, CNT2, CNT3) NT subtypes was also determined using both qualitative and quantitative polymerase chain reaction techniques.
In the absence of Na+, MVECs accumulated [3H]FB with a Vmax of 21±1 pmol μl−1 s−1. This uptake was mediated equally by es (Km 260±70 μM) and ei (equilibrative inhibitor-insensitive; Km 130±20 μM) NTs.
A minor component of Na+-dependent cif (concentrative inhibitor-insensitive FB transporter)/CNT2-mediated [3H]FB uptake (Vi 0.008±0.005 pmol μl−1 s−1 at 10 μM) was also observed at room temperature upon inhibition of ENTs with dipyridamole (2,6-bis(diethanolamino)-4,8-dipiperidinopyrimido-[5,4-d]pyrimidine)/NBMPR.
MVECs had 122,000 high-affinity (Kd 0.10 nM) [3H]NBMPR binding sites (representing es transporters) per cell. A lower-affinity [3H]NBMPR binding component (Kd 4.8 nM) was also observed that may be related to intracellular es-like proteins.
Rat skeletal muscle MVECs express es/ENT1, ei/ENT2, and cif/CNT2 transporters with characteristics typical of rat tissues. This primary cell culture model will enable future studies on factors influencing NT subtype expression, and the consequent effect on adenosine bioactivity, in the microvasculature.
Keywords: Vasculature, adenosine, formycin B, dipyridamole, dilazep, draflazine, endothelial function, vasodilators, nitrobenzylthioinosine
Introduction
Hydrophilic nucleosides permeate cell membranes via a spectrum of specific transport proteins. These nucleoside transporters (NTs) also facilitate the cellular uptake of many nucleoside analogs used as antiviral and anticancer agents (Belt et al., 1993; Yao et al., 2001; Clarke et al., 2002). Several subtypes of concentrative Na+-dependent NTs (SLC28; CNTs) (Gray et al., 2004) and equilibrative Na+-independent NTs (SLC29; ENTs) (Baldwin et al., 2004) have been identified. The CNT subtypes are characterized by their substrate selectivities; cit (concentrative inhibitor-insensitive thymidine transporter) favours pyrimidine substrates, cif (concentrative inhibitor-insensitive formycin B (FB) transporter) purine substrates and cib (concentrative inhibitor-insensitive NT with broad substrate specificity) mediates both purine and pyrimidine flux (Ritzel et al., 2001). The corresponding gene products have been identified and termed CNT1, CNT2 and CNT3, respectively. The ENT subtypes are distinguished by their sensitivities to inhibitors such as [3H]nitrobenzylmercaptopurine riboside (NBMPR) (Hyde et al., 2001). Transporters sensitive to NBMPR at nanomolar concentrations are functionally known as es (equilibrative, inhibitor-sensitive) transporters. In contrast, the ei (equilibrative, inhibitor-insensitive) transporters are blocked by NBMPR only at micromolar concentrations. Gene products encoding proteins with es (ENT1) and ei (ENT2) functionality have been cloned from human (Griffiths et al., 1997a, 1997b; Crawford et al., 1998), mouse (Kiss et al., 2000), rat (Yao et al., 1997) and dog (Hammond et al., 2004) tissues, with ENT1 being the predominant form in most cell types. Two other members of the ENT family have been identified by molecular approaches (ENT3 and ENT4), but their functional roles have yet to be elucidated (Hyde et al., 2001; Acimovic & Coe, 2002).
Adenosine, a natural substrate for both es and ei transporters, has a plethora of biological functions (Burnstock, 2002a) mediated by a family of extracellular G-protein-coupled receptors (Shryock & Belardinelli, 1997). There has been considerable interest in the role of adenosine as a vasodilator and cardioprotective moiety (Cook & Karmazyn, 1996). Adenosine accumulates in biological systems under conditions of metabolic stress, including ischemia, hypoxia, and increased sympathetic nerve activity, where energy demand exceeds supply (Mubagwa & Flameng, 2001). This increase in adenosine concentration has proven beneficial in reducing myocardial and vascular damage in both ischemia–reperfusion injury and heart failure (Ely & Berne, 1992; Kitakaze et al., 1999; Vinten-Johansen et al., 1999). Owing to its profound effects on cell function, it is presumed that the extracellular levels of adenosine must be tightly regulated. Microvascular endothelial cells (MVECs) serve as the primary barrier between the microcirculation and the surrounding tissue, and have been proposed as a major ‘sink' for the uptake and metabolism of adenosine in the heart and vasculature (Deussen et al., 1999). Despite the fact that endothelial cells make up only 2–4% of the cellular mass of the heart, Deussen and co-workers have shown that they accumulate as much as 65% of free adenosine. Therefore, any change in the metabolism or transport of adenosine by endothelial cells would directly alter local adenosine concentrations and thereby influence a variety of physiological processes in the perfused tissue (Shryock & Belardinelli, 1997; Gamboa et al., 2003).
Numerous investigators have reported a potentiation of the beneficial cardiovascular effects of adenosine by blocking its reuptake and metabolism by cells (Van Belle, 1993). Indeed, this is the primary mechanism by which dilazep ((N,N′-bis[3-(3,4,5-trimethoxybenzoyloxy)propyl]-homopiperazine), draflazine (2-(aminocarbonyl)-4-amino-2,6-dichlorophenyl)-4 — [5,5-bis(4-fluorophenyl)-pentyl]-1-piperazineacetamide 2HCl) and dipyridamole (2,6-bis(diethanolamino)-4,8-dipiperidinopyrimido-[5,4-d]pyrimidine) produce their clinically relevant vasodilatory effects in the coronary vasculature (Hyde et al., 2001). However, these inhibitors typically have high affinity only for the es subtype of NT. The CNT systems and the ‘inhibitor-insensitive' (ei) ENTs would continue to function in the presence of these inhibitors. Therefore, the relative expression of the transporter subtypes in a particular cell type may have major implications for the capacity of transport blockers to potentiate the effects of adenosine in the vicinity of those cells. This is likely to be especially important in skeletal muscle, where blood flow to the muscle increases dramatically with exercise (Andersen & Saltin, 1985; Boushel et al., 2000) and this vasodilation coincides with a significant increase in adenosine concentration in the vasculature of skeletal muscle (Langberg et al., 2002). The ei system, which has a higher affinity for the adenosine metabolites hypoxanthine and inosine than does the es transporter (Osses et al., 1996; Ward et al., 2000), may be particularly important in regulating the levels of adenosine metabolites in muscle during exercise and recovery.
In this study, endothelial cells isolated from the microvasculature of rat skeletal muscle were examined for their capacities to accumulate nucleosides, and for the sensitivity of this uptake to vasodilators such as dipyridamole, dilazep and draflazine. Experiments were also designed to assess the relative contributions of the various ENT and CNT subtypes to nucleoside accumulation by MVECs. The general objective was to establish the NT characteristics of MVECs to validate the use of this primary cell culture model for the study of physiological and pathophysiological factors involved in the regulation of NT expression and function in the microvasculature of skeletal muscle.
Methods
Cell isolation/culture
All aspects of this study were conducted in strict accordance with the policies and guidelines set forth by the Canadian Council on Animal Care.
Endothelial cells were isolated based on the affinity of their α-D-(+)galactosyl residues for isolectin B4 from Bandeiraea simplicifolia (BSI-B4; Sigma, St Louis, MO, U.S.A.), which was bound to magnetic microbeads (Dynabeads® M-450 Epoxy, Dynal, Lake Success, NY, U.S.A.). Coating of Dynabeads with BSI-B4 was carried out according to the manufacturer's specifications. Briefly, ∼1 × 10⁸ beads were washed in 0.1 M borate buffer (pH 9.5) and then rotated for 24 h at 4°C with BSI-B4 (0.2 mg ml−1 in 0.1 M borate buffer). The BSI-B4-coated beads were washed three times and stored in phosphate-buffered saline (PBS) containing 0.1% bovine serum albumin (BSA).
The cell isolation protocol was based on previously described methods (Hewett & Murray, 1993a, 1993b; Wilson et al., 1996). The extensor digitorum longus muscles of male Wistar rats (250–300 g) were removed from the hindlimbs under anesthesia by sodium pentobarbital (42 mg kg−1, i.p.). After careful removal of tissue containing larger feed arteries, the isolated muscle was sliced into ∼0.5 mm pieces and digested for 30–45 min in 0.84 mg ml−1 collagenase, 0.12 mg ml−1 trypsin and dispase, and 1.62 mg ml−1 BSA in 50 ml Kreb's Ringer solution (127 mM NaCl, 4.6 mM KCl, 1.1 mM MgSO4, 1.2 mM KH2PO4, 8.3 mM D-glucose, 24.8 mM NaHCO3, 2 mM pyruvate, 11.4 mM creatinine, 20 mM taurine, 5 mM D-ribose, 2 mM L-asparginine, 2 mM L-glutamine, 1 mM L-arginine, 0.5 mM uric acid) in a 37°C water-jacketed organ bath bubbled with 95%O2/5%CO2. The enzymatic digest was filtered through 100 μm nylon mesh to remove undigested fragments, and the dissociated cells collected by centrifugation and washed in 37°C Media 199 (M199). Cells were then resuspended with ∼1 × 10⁶ BSI-B4-coated Dynabeads® (in M199) and rotated on a spindle for 10–15 min. Endothelial cells bound to the magnetic beads were then selected using a magnetic particle collector (MPC®-1; Dynal, Lake Success, NY, U.S.A.), washed and transferred onto six-well plates in M199 media supplemented with 20% fetal bovine serum (FBS), 100 U ml−1 penicillin G, 100 μg ml−1 streptomycin sulfate, 0.25 μg ml−1 amphotericin B, 2 mM L-glutamine, 0.0125 IU ml−1 heparin and 15 μg ml−1 endothelial cell growth supplement (ECGS) and cultured at 37°C in a 5% CO2 humidified atmosphere. The media were changed routinely every 4 days, and cells were passaged using 0.05% trypsin–0.53 mM EDTA upon reaching confluence. After passage 2, FBS levels were reduced to 10%. The endothelial cell phenotype was confirmed by the presence of von Willebrand factor VIII and BSI-B4 antigens as described previously (Hewett & Murray, 1993a, 1993b; Wilson et al., 1996). Cultures were typically found to contain greater than 98% endothelial cells.
In preparation for radioligand binding or substrate flux assays, MVECs were trypsinized for 5–10 min at 37°C, then diluted four-fold with M199+10% FBS and collected by centrifugation. Cell pellets were washed once by resuspension/centrifugation in either PBS (137 mM NaCl, 6.3 mM Na2HPO4, 2.7 mM KCl, 1.5 mM KH2PO4, 0.9 mM CaCl2·2H2O, 0.5 mM MgCl2·6H2O; pH 7.4) or a modified Na+-free PBS (140 mM N-methyl-D-glucamine, 10 mM HEPES, 5 mM KCl, 4.2 mM KHCO3, 0.44 mM KH2PO4, 0.36 mM K2HPO4, 1.3 mM CaCl2·2H2O, 0.5 mM MgCl2·6H2O; pH 7.4), and then resuspended in the same buffer for immediate use in the assays described below. Cell number was determined using a hemocytometer.
[3H]NBMPR binding
MVECs (∼300,000 cells assay−1, in PBS) were incubated with [3H]NBMPR (±inhibitors) in borosilicate glass tubes for 45 min at room temperature (∼22°C) to attain steady-state binding (1 ml final vol.). Reactions were terminated by filtration through Whatman GF/B filters under vacuum and washed twice with ∼5 ml of ice-cold Tris-HCl buffer (10 mM, pH 7.4). Filters were then assessed for radioactive content by standard liquid scintillation counting. Nonspecific binding of [3H]NBMPR was defined as that which remained cell associated in the presence of 10 μM nitrobenzylthioguanosine (NBTGR). Specific binding was defined as total minus nonspecific binding. Kd and Bmax values for [3H]NBMPR binding were calculated from nonlinear (hyperbolic) curves fitted (GraphPad Prism 3.02) to nontransformed specific binding data plotted against the free [3H]NBMPR concentrations at steady state. Inhibition constants for a selection of known NT inhibitors were calculated from variable–slope sigmoid curves fitted to the binding of [3H]NBMPR (0.5 nM), relative to control, against the log of the inhibitor concentration. The Cheng–Prusoff equation (Cheng & Prusoff, 1973) was used to derive Ki values from these studies using the Kd for [3H]NBMPR obtained by mass law analysis as described above. In some cases, a range of inhibitor concentrations was tested against a range of [3H]NBMPR concentrations and the data analyzed by double reciprocal plot analysis to calculate Ki values directly, and to determine the type of inhibition.
[3H]FB uptake
[3H]FB uptake, unless stated otherwise, was measured at 15°C in a refrigerated/circulating water bath in Na+-free buffer. Uptake was initiated by the addition of 250 μl of cell suspension (∼750,000 cells assay−1) to 250 μl of [3H]FB layered over a 200 μl cushion of silicone/mineral oil (21 : 4 (v /v−1)) in 1.5 ml microcentrifuge tubes. Assays were terminated after defined time intervals (5–600 s) by centrifugation (12,000 × g) of the cells through the oil layer. Aqueous supernatant and oil were removed and cell pellets digested in 1 M sodium hydroxide for ∼16 h at room temperature. The digest was analyzed for [3H] content using standard liquid scintillation counting techniques. Cellular accumulation of [3H]FB was assessed in the absence (total uptake) and presence of 50 nM NBMPR (NBMPR-resistant uptake) or 10 μM NBMPR/dipyridamole (nontransporter-mediated uptake). The addition of adenosine (3 mM) to the combination of 10 μM NBMPR/dipyridamole yielded no further reduction in uptake compared with dipyridamole and NBMPR alone, confirming that the latter inhibitors were blocking all transporter-mediated uptake of [3H]FB under these conditions. Therefore, uptake that was sensitive to both dipyridamole and 50 nM NBMPR was defined as inhibitor-sensitive uptake (es transporter mediated), and that sensitive to 10 μM dipyridamole but not inhibited by 50 nM NBMPR was defined as inhibitor-insensitive (ei transporter mediated).
The Na+ dependence of [3H]FB uptake was assessed at room temperature (∼22°C) after incubating the cells with a combination of 10 μM dipyridamole and 10 μM NBMPR to block nucleoside flux via the equilibrative systems. Uptake was measured in Na+-replete PBS and Na+-free buffer, in parallel, using the oil-stop method described above.
Uptake data are presented as intracellular [3H]substrate concentrations (pmol μl−1 intracellular volume; μM) after correction for the amount of [3H]label present in the extracellular space of the cell pellet. Total water volumes of the cell pellets were determined by incubating cells with [3H]water for 3 min and then processing the samples as described above. An estimate of the extracellular water volume was obtained from extrapolation of the linear time course of nonmediated uptake back to ‘zero time'. Initial rates (Vi) of flux were calculated as the uptake at 1 s determined by extrapolation of hyperbolic curves fitted (GraphPad Prism 3.02) to time-course data, or were derived from the transporter-mediated uptake observed using a 5 s incubation time (the minimum measurable time point). Vi extrapolated from hyperbolic curves fitted to 1 μM FB time-course data were not significantly different (Student's t-test, P<0.05) from that derived in a separate series of experiments using a single 5 s time point. Km and Vmax values were calculated from nonlinear curves fitted to plots of [3H]FB concentration versus Vi. Inhibition constants (IC50) for selected inhibitors were calculated from variable–slope sigmoid curves fitted to the uptake of 1 μM FB, relative to control (no inhibitor), against the log of the inhibitor concentration (conducted at room temperature). With the exception of studies using endogenous nucleosides, cells were incubated with inhibitors for at least 15 min prior to measurement of [3H]FB influx rates.
Qualitative reverse-transcriptase–polymerase chain reaction (RT–PCR)
Total RNA was isolated from male Wistar rat MVECs (P0, P2 and P8 cultures), as well as from rat brain, kidney, skeletal muscle and liver, using the single-step method of RNA isolation (Chomczynski & Sacchi, 1987) or the GenElute™ Mammalian total RNA mini-prep kit (Sigma, St Louis, MO, U.S.A.). Polyadenylated RNA (mRNA) was selected using the Nucleotrap mRNA mini-kit (Clontech, Palo Alto, CA, U.S.A.) or GenElute™ mRNA mini-prep kit (Sigma, St Louis, MO, U.S.A.), and first strand DNA template was generated using 250–500 ng of mRNA and the Superscript™ First Strand Synthesis System for RT–PCR (Invitrogen, Carlsbad, CA, U.S.A.). RT–PCR amplifications were performed using AmpliTaq Gold hot start polymerase (Applied Biosystems, Foster City, CA, U.S.A.) in a Thermocycler PE 480 (Perkin-Elmer, Norwalk, CT, U.S.A.) using an oil-overlaid 50 μl reaction mixture in 500 μl thin-walled reaction tubes. Reaction conditions included a 5 min 95°C initial activation, followed by 30 (for ENTs) or 35 (for CNTs) cycles of 1 min at 95°C, 1 min at the appropriate annealing temperature (see Table 1) and 1 min at 72°C. This was followed by a 10 min 72°C elongation step. Preliminary experiments showed that 30 cycles of PCR were suitable to obtain a visible product on agarose gels for each of the transporter subtypes while remaining on the log-linear portion of the cycle number versus product formation curves. PCR products were resolved by electrophoresis on 1.2% agarose gels against the GeneRuler™ DNA ladder mix (Fermentas, Burlington, Ontario, Canada). PCR amplification conditions and primer sequences are summarized in Table 1 for ENT1, ENT2, ENT3, CNT1, CNT2, CNT3 and GAPDH. For the ENT transporters, successful PCR reactions were repeated using a proof-reading Taq polymerase mixture (Advantage® 2 Polymerase Mix, Clontech, Palo Alto, CA, U.S.A.), and the products ligated directly into pcDNA3.1/V5-His© TOPO® vector and propagated in One Shot® TOP 10 Chemically Competent Escherichia coli using protocols provided by the supplier (Invitrogen, Burlington, Ontario, Canada). The plasmid inserts were sequenced using Taq BigDye Terminator Cycle Sequencing Kit in an automated ABI PRISM Model 377 Version 3.3 DNA Sequencer (PE Applied Biosystems, Norwalk, CT, U.S.A.).
Table 1.
RT–PCR conditions
| Name (accession #) | Primer sequence | Annealing temp (°C) | Expected size (bp) |
|---|---|---|---|
| ENT1 | 5′CACCATGACAACCAGTCACCA | 68 | 1399 |
| (AF015304) | 3′CCTCTGTCCACACAGGGTCGC | ||
| 5′GCCGGCCAACTACACA | 64 | 157 | |
| 3′TATGGCCAGAATGACAACTGC | |||
| ENT2 | 5′GTGCAATAGGACTGCGGACAT | 68 | 1416 |
| (AF015305) | 3′AGGACTGTGGAGTGCGGTGGT | ||
| 5′GCTACCACCTGGTCGGGATCA | 64 | 278 | |
| 3′CAGGCTGCCCAGAATACGC | |||
| ENT3 | 5′ATGGCCTTTGCCTCTGAGGAC | 68 | 1398 |
| (AY273196) | 3′GGCTGAGCCCAGCATCAAACC | ||
| 5′CCGGGTGCATGTTCGAGTT | 64 | 406 | |
| 3′AACCGGCCTCATGTAGTACCT | |||
| CNT1 | 5′CCATTTCCCTCACGCCTAT | 55 | 1431 |
| (U10279) | 3′ACTCAGCCACTACCGGACAGT | ||
| CNT2 | 5′ACAGGAGATGGCGAAGTC | 64 | 1410 |
| (U66723) | 3′ACCATTGGCCTTAGGACATAG | ||
| CNT3 | 5′CACAGAGGAAGAGAGCGAAGA | 55 | 1455 |
| (AY059414) | 3′GTCTCCGAGCGAATTGACAT | ||
| GAPDH | 5′GACTCTACCCACGGCAAGTTC | 68/64/55 | 602 |
| (AF106860) | 3′TCCAGGCGGCATGTCA | ||
| β-actin | 5′CCTCTATGCCAACACAGTGC | 64 | 175 |
| (X03672) | 3′CAGCAAGCAGGAGTACGATG |
PCR amplifications were carried out for 30–35 cycles using the conditions described in the text. GAPDH was amplified in parallel for each assay, using annealing temperatures that reflected the optimum for the coamplified ENT/CNT subtypes.
Quantitative real-time PCR
First-strand DNA template was prepared from P0 (fresh isolates) and P8 cultures of rat MVECs as described above. PCR primers were designed to achieve product sizes of 157 bp for rENT1, 278 bp for rENT2, 406 bp for rENT3 and 175 bp for β-actin (see Table 1). A Roche Diagnostics LightCycler was used to perform real-time PCR in 25 μl microcapillary tubes (Roche Diagnostics Canada, Laval, Quebec, Canada) using SYBR GreenTaq ReadyMix™ (Sigma, St Louis, MO, U.S.A.) with 1 μl of cDNA template. Reaction conditions included an initial activation step of 30 s at 95°C, followed by 40 cycles of ramping at 20°C s−1 to hold for 0 s at 95°C, ramping at 20°C s−1 to hold for 5 s at 64°C, ramping at 5°C s−1 to hold for 13 s at 72°C and ramping at 20°C s−1 to hold for 1 s at 82°C, with a single acquisition of data before the start of each cycle. Data were analyzed with LightCycler Software version 3 (Idaho Tech, Salt Lake City, UT, U.S.A.). The melting temperature (Tm) of specific products and potential primer dimers was determined using the following conditions: ramping at 20°C s−1 to hold for 0 s at 95°C, ramping at 20°C s−1 to hold for 10 s at 65°C and continuous acquisition of data while ramping at 0.1°C s−1 until reaching 95°C. According to the Tm value of specific products for the respective genes, an additional signal acquisition step, 2–3°C below Tm, was added after the elongation phase of PCR. This additional step in the PCR reactions ensured signal acquisition from the specific target products.
Standard curves representing the rENT1, rENT2, rENT3 and β-actin amplification–concentration profiles were constructed using 1–4 μl of an undiluted, a 1 : 10 dilution and a 1 : 100 dilution of cDNA template derived from rMVECs. The amount of each ENT transcript expressed by MVECs was assessed using duplicate sets of cDNA derived from multiple distinct lots of mRNA isolated from either freshly isolated rMVECs (P0) or after two or eight passages of in vitro culture. The cycle number at which the fluorescence signal was significantly higher than baseline (the crossing point, Cp) was used to calculate the relative concentrations of ENT1, ENT2, ENT3 and β-actin from their standard curves. Data were then normalized to β-actin to account for differences in reverse transcription efficiencies and fluorescence detection variance in each reaction mixture. The products from the reactions described above were also run on a 1% agarose gel, along with a DNA ladder (GeneRuler™ DNA ladder mix; Fermentas, Burlington, Ontario, Canada), to confirm that all products were of the correct length for the primers used.
Materials
[G-3H]FB (14 Ci mmol−1) and [G-3H]NBMPR (5.5 Ci mmol−1) were purchased from Moravek Biochemicals (Brea, CA, U.S.A.). [3H]Water (1 mCi g−1) was purchased from DuPont Canada Inc. (Markham, Ontario, Canada). Nonradiolabeled FB, NBMPR, NBTGR, dipyridamole, collagenase, trypsin, BSA, anti-human von Willebrand Factor VIII, goat serum and anti-rabbit IgG peroxidase conjugate were supplied by Sigma (St Louis, MO, U.S.A.). Dispase was obtained from Roche Biochemicals (Indianapolis, IN, U.S.A.). Biotin-conjugated BSI-B4 lectin was purchased from ICN Biomedicals Inc. (Aurora, OH, U.S.A.) and horseradish peroxidase from Cedarlane Laboratories (Hornby, Ontario, Canada). Dilazep was provided by Asta Werke (Frankfurt, Germany), and draflazine and soluflazine (3-(aminocarbonyl)-4-[4,4-(4-fluorophenyl-3-pyridinyl)butyl]-N-2,6-dichlorophenyl)-1-piperazineacetamide 2HCl) were provided by Janssen Research Foundation (Beerse, Belgium), while adenosine was purchased from Lancaster Synthesis Inc. (Windham, NH, U.S.A.). All other nucleosides were purchased from Sigma. M199 with Earle's salts and L-glutamine, FBS, culture grade Dulbecco's PBS, trypsin–EDTA, antibiotic/antimycotic (penicillin, streptomycin and amphotericin B) and heparin were purchased from GIBCO/BRL (Burlington, Ontario, Canada). ECGS was supplied by Beckton Dickinson (Oakville, Ontario, Canada).
Statistics
Data are presented as the mean±standard error of the mean (s.e.m.) of n independent experiments conducted in duplicate. Statistical significance (P<0.05) was assessed using the two-tailed Student's t-test for unpaired samples.
Results
[3H]NBMPR binding
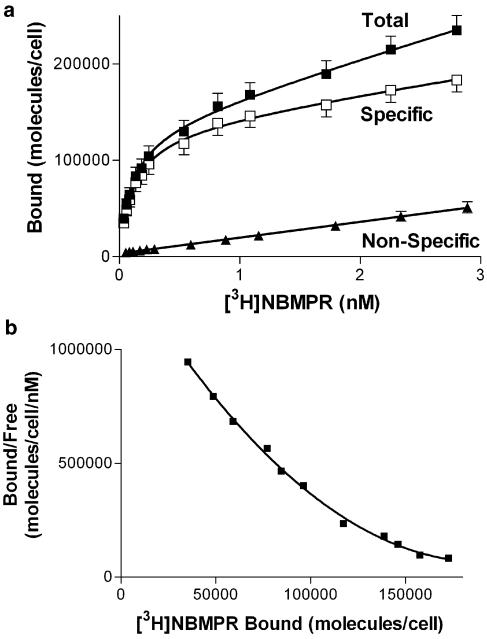
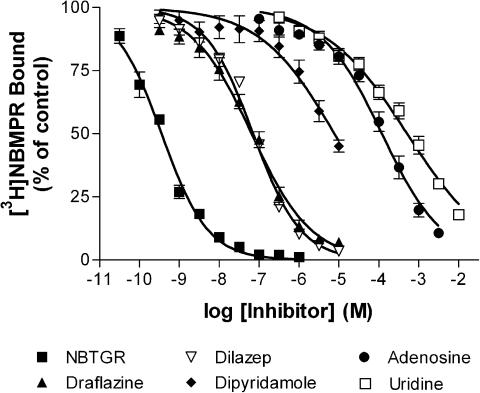
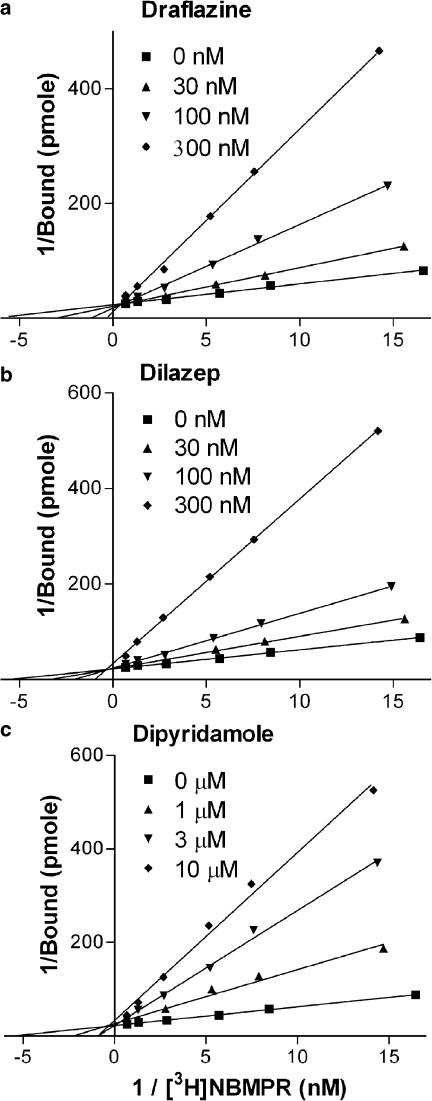
Initial studies examined the binding of the es-selective radioligand [3H]NBMPR. Less than 20% depletion of free radioligand was observed under these experimental conditions, with the higher levels of depletion (>10%) observed only when using [3H]NBMPR concentrations of less than 0.08 nM. To compensate for this ligand depletion, we routinely used the calculated equilibrium-free (total pmol added minus pmol bound at equilibrium) concentrations of [3H]NBMPR for data analyses. Nonspecific binding (in the presence of 10 μM NBTGR) was linear with increasing concentrations of [3H]NBMPR. Subtraction of the nonspecific component from the total binding resulted in a two-component binding profile (F-test, P<0.05) where [3H]NBMPR bound to 122,000±12,000 sites per cell with a Kd of 0.10±0.02 nM and a further 174,000±78,000 sites with a Kd of 4.8±4.2 nM (Figure 1a). The multiple binding components may be clearly discerned when one inspects the Scatchard transforms of these data (Figure 1b). The nucleoside transport inhibitors, NBTGR, draflazine, dilazep and dipyridamole, as well as the transporter substrates adenosine and uridine, were then tested for their ability to inhibit [3H]NBMPR (0.5 nM) binding to these cells (Figure 2). This concentration of [3H]NBMPR would be expected to label predominantly the higher-affinity population of binding sites. NBTGR was the most potent (Ki 74±10 pM; nH 0.75±0.04) followed by draflazine (Ki 17±4 nM; nH 0.62±0.05), dilazep (Ki 30±6 nM; nH 0.68±0.04) and dipyridamole (Ki 1.9±0.5 μM; nH 0.52±0.11). The least effective inhibitors were adenosine (Ki 22±3 μM; nH 0.59±0.04) and uridine (Ki 98±19 μM; nH 0.44±0.03). Soluflazine, an analog of draflazine with selectivity for ei (Hammond, 2000), had no statistically significant effect on the binding of [3H]NBMPR to MVECs at the highest concentration tested (30 μM, data not shown). Direct determination of Ki for the inhibition of [3H]NBMPR binding (Figure 3) by draflazine, dilazep and dipyridamole yielded values (44±19 nM, 46±17 nM, and 3.0±0.63 μM, respectively), which were not significantly different (P<0.05) from those derived by the Cheng–Prusoff equation based on IC50 values obtained from the sigmoid inhibition curves shown in Figure 2. These analyses also showed that the inhibitors were functioning in a strictly competitive manner.
Figure 1.
Mass law analysis of [3H]NBMPR binding to rat skeletal muscle MVECs. (a) Cells were incubated with a range of concentrations of [3H]NBMPR in the absence (total) and presence (nonspecific) of 10 μM NBTGR. Specific binding was defined as the difference between the total and nonspecific binding components. Data are plotted as the number of molecules of NBMPR bound per cell (ordinate) versus the equilibrium free concentration of [3H]NBMPR (abscissa). Each point represents the mean±s.e.m. of 12 independent experiments. (b) Scatchard representation of the specific binding data shown in (a). These data fit best to a two site binding model (F-test, P<0.05).
Figure 2.
Inhibition of [3H]NBMPR binding to rat skeletal muscle MVECs. The nucleoside transport inhibitors NBTGR (n=5), draflazine (n=8), dilazep (n=10), dipyridamole (n=6) and the transporter substrates adenosine (n=7) and uridine (n=7) were tested for their ability to inhibit the binding of [3H]NBMPR in MVECs. Data are shown as the percent of control binding where the ‘control' was the site-specific binding of 0.5 nM [3H]NBMPR in the absence of inhibitor. Each point represents the mean±s.e.m. from the number of experiments indicated above, conducted in duplicate.
Figure 3.
Double reciprocal plot analyses of the inhibition of [3H]NBMPR binding by draflazine (a), dilazep (b) and dipyridamole (c). The site specific binding of six concentrations of [3H]NBMPR was measured in the absence and presence of the indicated concentrations of inhibitor. Data are plotted as the reciprocals of the binding of [3H]NBMPR (ordinate) against the reciprocals of the equilibrium free concentrations of [3H]NBMPR (abscissa). Cell suspensions were diluted to obtain a similar cell concentration in each experiment. Each point is the mean of five experiments performed in duplicate.
Equilibrative transporter-mediated uptake of [3H]FB
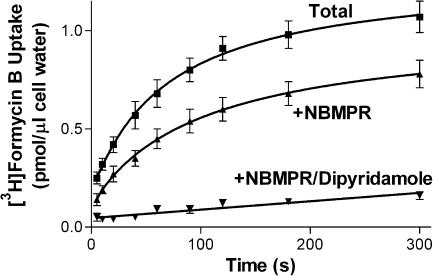
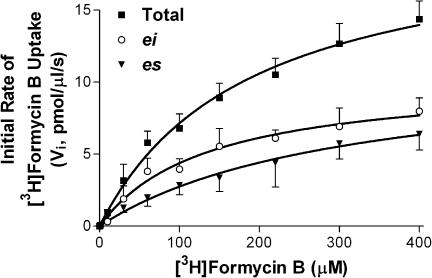
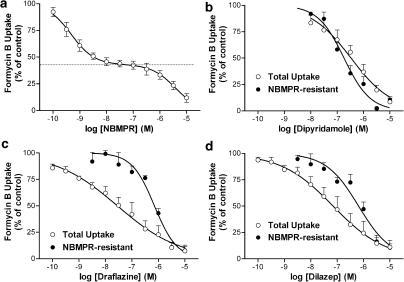
Initial studies were conducted in Na+-free media to allow selective study of the equilibrative NTs in these cells. Preliminary studies established that the uptake of 10 μM [3H]FB by MVECs was extremely rapid when measured at room temperature (∼22°C), with over 40% of the cellular equilibration occurring within the first measurable time point (5 s), giving initial rates in excess of 0.8 pmol μl−1 s−1. Therefore, uptake was assessed at temperatures less than ambient (12, 15, 18 and 21°C), with 15°C being selected as that temperature which allowed a reasonable estimation of initial rates while still maintaining cell membrane integrity. Skeletal muscle MVECs, at 15°C in Na+-free buffer, accumulated 1 μM [3H]FB to a maximum of 1.1±0.1 pmol μl−1 of cell water, which was not significantly different from the initial 1 μM extracellular concentration of FB (P<0.05). The initial rate of uptake for the total transporter-mediated (10 μM dipyridamole-sensitive) component was 0.033±0.005 pmol μl−1 s−1. This rate was reduced significantly, to 0.018±0.002 pmol μl−1 s−1, in the presence of 50 nM NBMPR (Figure 4). Analyses of initial rates of influx obtained using a range of [3H]FB concentrations yielded Km values of 260±60 and 130±20 μM for es- and ei-mediated uptake, respectively, and Vmax values of 10.4±1.4 and 10.2±0.6 pmol μl−1 s−1, respectively (Figure 5). A similar ratio of es : ei (1 : 1) activity was observed when 1 μM FB uptake (15 s) was measured in the presence of a range of concentrations of NBMPR. NBMPR inhibited the uptake of [3H]FB in a biphasic manner (IC50a 0.46±0.14 nM; IC50b 4.5±1.1 μM) with about half of the uptake (53±4%) being relatively insensitive to NBMPR (Figure 6a). The NT inhibitors dipyridamole, draflazine and dilazep also inhibited the total mediated uptake of [3H]FB by the MVECs with IC50 values of 18±4 nM, 29±6 nM, and 1.0±0.4 μM, respectively (Figure 6b–d). In all cases, the pseudo-Hill coefficients (nH) derived from these data were significantly less than 1 (0.37±0.02, 0.44±0.01, 0.56±0.05 for draflazine, dilazep and dipyridamole, respectively). This reflects the fact that, like NBMPR, these inhibitors also have differential affinities for es and ei transporters. When similar inhibition experiments were conducted in the presence of 50 nM NBMPR (to inhibit es activity), draflazine, dilazep and dipyridamole had IC50 values for inhibiting the remaining ei-mediated uptake of 730±100, 730±170 and 200±48 nM, respectively, with nH values not different from 1.
Figure 4.
Time course of [3H]FB accumulation by rat skeletal muscle MVECs. Cells were incubated with 1 μM [3H]FB in the absence (total uptake) and presence of 50 nM NBMPR (+NBMPR, NBMPR-resistant uptake) or 10 μM dipyridamole/10 μM NBMPR (+NBMPR/dipyridamole, nonmediated uptake), for the times indicated (abscissa). Assays were conducted at 15°C in Na+-free buffer and terminated by the oil-stop method as described in the text. Each point represents the mean±s.e.m. from 13 experiments.
Figure 5.
Concentration dependence of Na+-independent [3H]FB uptake by rat skeletal muscle MVECs. Cells were incubated for 5 s with a range of concentrations of [3H]FB in the absence and presence of 50 nM NBMPR or 10 μM dipyridamole/10 μM NBMPR (nonmediated uptake) in Na+-free buffer. Total transporter-mediated uptake was calculated as the total cellular accumulation of [3H]FB minus the nonmediated uptake component. Uptake via the ei transporter was determined as cellular accumulation of [3H]FB in the presence of 50 nM NBMPR minus the nonmediated uptake, and es-mediated uptake was defined as the difference between the total uptake and that seen in the presence of 50 nM NBMPR. The hyperbolic profiles observed were analyzed to obtain the maximum rate of cellular accumulation of [3H]FB (Vmax) and the Michaelis–Menten (Km) constants for the es and ei transporters, as reported in the text. Each point is the mean±s.e.m. of five experiments.
Figure 6.
Inhibition of transporter-mediated uptake of [3H]FB in rat skeletal muscle MVECs. Cells were incubated with 1 μM [3H]FB for 15 s in the presence of the indicated concentrations of NBMPR (a), dipyridamole (b), draflazine (c) or dilazep (d). Assays were conducted both with (NBMPR-resistant) and without (total uptake) incubation of cells with 50 nM NBMPR to inhibit es-mediated activity. Data are shown as the percent of control uptake where the ‘control' was the transporter-mediated uptake of [3H]FB in the absence of test inhibitor. The dotted line in (a) indicates the amount of [3H]FB uptake (47±4%) that was relatively resistant to inhibition by NBMPR (ei mediated). Each point represents the mean±s.e.m. from five experiments conducted in duplicate.
Na+-dependent uptake of [3H]FB
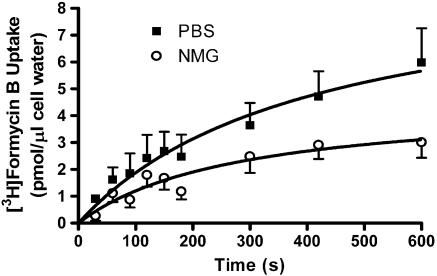
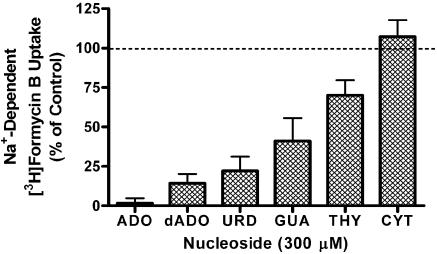
At 15°C, similar data were obtained in both normal (Na+-replete) and Na+-free buffers, indicating that Na+-dependent FB uptake was not occurring under those assay conditions. However, when assays were conducted at room temperature under conditions where equilibrative transporter activity was blocked with 10 μM NBMPR/dipyridamole, a small, but significant, amount of Na+-dependent 10 μM [3H]FB uptake was discerned (Vi 0.008±0.005 pmol μl−1 s−1; Figure 7). This Na+-dependent uptake was inhibited by a panel of other nucleosides (tested at 300 μM) with an order of potency (adenosine≫uridine>guanosine>thymidine≫cytidine) consistent with the operation of the purine-selective cif transporter subtype (see Figure 8).
Figure 7.
Na+-dependent uptake of 10 μM [3H]FB by rat skeletal muscle MVECs. Cells suspended in either PBS or Na+-free (NMG) buffer were incubated for 30 min with 10 μM dipyridamole/NBMPR to inhibit all equilibrative NTs, and then exposed to [3H]FB for the times indicated (abscissa). Cells were separated from the incubation media using the oil-stop method described in the text, and the amount of [3H]FB assessed as pmol accumulated per μl intracellular water (ordinate). Assays (PBS/NMG) were conducted in parallel, and each point represents the mean±s.e.m. from five experiments conducted in duplicate.
Figure 8.
Inhibition of Na+-dependent [3H]FB uptake by purine and pyrimidine nucleosides. Cells were prepared in PBS (+1 mM glucose) and incubated with 10 μM dipyridamole and 10 μM NBMPR to inhibit all equilibrative NTs, and then exposed to 10 μM [3H]FB for 15 min in the presence of 300 μM adenosine (ADO), deoxyadenosine (dADO), uridine (URD), guanosine (GUA), thymidine (THY) or cytidine (CYT). The uptake observed in the absence of Na+ was assessed in parallel and subtracted from all data. Results are shown as the percent of control uptake where the control is the Na+-dependent uptake of [3H]FB in the absence of purine/pyrimidine inhibitors. Each bar represents the mean±s.e.m. from four experiments conducted in duplicate.
RT–PCR
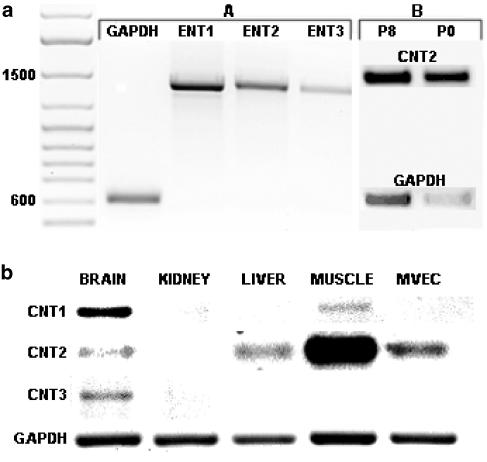
RT–PCR revealed transcripts for ENT1, ENT2 and ENT3, as well as for CNT2 (Figure 9a), but not CNT1 or CNT3, in rMVECs after in vitro culture. CNT2 was also the dominant concentrative transporter expressed in freshly isolated rMVECs, with PCR product levels (relative to GAPDH) approximately four-fold higher than those seen in the in vitro cultures (Figure 9a). To confirm that the primers used for CNT1 and CNT3 were capable of amplifying the desired product, we amplified CNT1 and CNT3 from rat brain tissue (Figure 9b); CNT1 was also detected in skeletal muscle. We also examined the level of CNT2 in a series of rat tissues. As seen in previous studies (Che et al., 1995), CNT2 was expressed in the muscle, liver and brain, but not kidney (Figure 9b). A single PCR product was obtained using each primer pair, and product sizes were compatible with those predicted based on the published sequences of these transporters (Table 1). The ENT transcripts were subsequently subcloned and sequenced to confirm identity. While some nucleotide substitutions were noted, the PCR products from rat MVECs encoded for ENT1, ENT2 and ENT3 proteins that were identical in amino-acid sequence to those published previously for the rat ENTs (GenBank accession #AF015304, AF015305, AY273196, respectively).
Figure 9.
Expression of ENT1, ENT2, ENT3, CNT1, CNT2 and CNT3. RT–PCR was conducted as described in the text using primer pairs and conditions shown in Table 1. PCR products were resolved on 1.2% agarose gels. (a) Expression of ENT1, ENT2, ENT3 and CNT2 by rMVECs. The gels shown are representative of more than 20 independent PCR reactions for the ENTs (A) and two independent reactions for CNT2 (B). CNT2 expression was assessed in both freshly isolated (P0) and in vitro (P8) cultured rMVECs, along with the respective GAPDH controls. A DNA ladder is shown on the left with the 1500 and 600 bp bands highlighted. (b) Expression of CNT1, CNT2 and CNT3 in rat brain, kidney, liver, skeletal muscle and MVECs. This figure is a composite of four agarose gels, but the same first-strand DNA preparation was used as template for the amplification of each transcript. This experiment was repeated twice with similar results obtained.
Quantitative real-time PCR
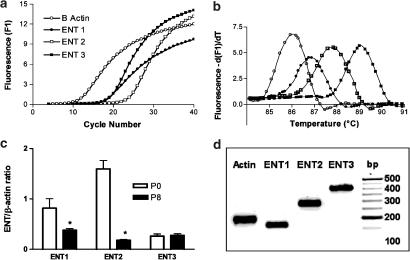
To assess the impact of in vitro culture on the relative amounts of the ENT subtypes expressed by rMVECs, we compared the ENT mRNA levels in cells freshly isolated from rat skeletal muscle to those that have been in culture for eight passages (∼1 month) using a Roche LightCycler system. The amplification plots (fluorescence versus cycle number) derived for rENT1, rENT2, rENT3 and β-actin in cultured rMVECs are shown in Figure 10a. The cycle number at which the fluorescence signal was significantly different from baseline (the crossing point, Cp) was used to compute the relative concentration of the target genes from their standard curves. Melting curves for all products had a single peak, indicating a high degree of product specificity (Figure 10b). The melting temperatures for ENT1, ENT2, ENT3 and β-actin were 87, 89, 88 and 86°C, respectively. Freshly isolated cells had significantly higher levels of ENT1 (two-fold) and ENT2 (nine-fold) than cells that had been passaged in vitro up to eight times (Figure 10c). ENT3 mRNA levels, on the other hand, did not change with in vitro cell culture (Figure 10c). The PCR products obtained using these primers were of the expected size (Table 1, Figure 10d).
Figure 10.
Quantification of rENT1, rENT2 and rENT3 mRNA in rMVEC cells by real-time PCR. (a) Representative PCR amplification plots for rENT1, rENT2, rENT3 and β-actin were generated by real-time PCR as described in the text. Crossing point (Cp) values, obtained from SYBR Green I fluorescence signals, were used to compute relative concentrations of β-actin, hENT1, rENT2 and rENT3 from their respective standard curves. (b) PCR products were subjected to melting-curve analyses to determine the specificity of the products. All samples showed a single product. (c) Bar graph of the relative amounts of rENT1, rENT2 and rENT3, normalized to the β-actin signal, in freshly isolated (P0) versus in vitro cultured (P8) rMVECs. Each bar is the mean±s.e.m. of three separate amplification runs from each of two independent mRNA isolations. *Significant difference in ENT expression between the P0 and P8 cells (Student's t-test, P<0.05). (d) Products obtained from the real-time PCR amplifications (P8 cells) were resolved on a 1% agarose gel, along with a DNA ladder (left lane; bp), in Tris-EDTA buffer and visualized with 0.5 μg ml−1 ethidium bromide. The products obtained were of the expected size (β-actin, 175 bp; rENT1, 157 bp; rENT2, 278 bp; and rENT3, 406 bp).
Discussion
MVECs form the primary barrier between the vasculature and surrounding tissue. Therefore, factors that affect adenosine flux through this barrier would be expected to impact on the biological effects of adenosine (Gamboa et al., 2003). Adenosine also has direct effects on endothelial cells, including modulation of cell proliferation (Burnstock, 2002b) and apoptosis (Wakade et al., 2001) through both protein kinase C and MAP kinase pathways. The rate of cellular uptake and metabolism by endothelial cells would also affect these direct actions of adenosine. Previous work has demonstrated that endothelial cells from large vessels such as human umbilical cord (HUVEC) express NTs that are mainly of the es subtype (Sobrevia et al., 1994), although an ei-type transporter has been described in a transformed cell line derived from HUVECs (ECV304) (Osses et al., 1996). Others have also noted differences in the expression of various phenotypic markers between primary endothelial cell cultures and immortalized cell lines such as ECV304 (Unger et al., 2002). Furthermore, endothelial cells from the microvasculature are different from large vessel endothelial cells both morphologically (Craig et al., 1998; Feoktistov et al., 2002) and in their sensitivity to circulating mediators such as insulin (King et al., 1983). Therefore, it is important to interpret data obtained from endothelial cell cultures in the context of the tissue from which they were originally derived.
MVECs derived from skeletal muscle of rat had two classes of binding sites for the es-selective radioligand [3H]NBMPR. The higher-affinity component bound [3H]NBMPR (and other NT inhibitors) with a Kd that was compatible with the well-characterized inhibitor binding site on the es transporter (Thorn & Jarvis, 1996; Hyde et al., 2001). The lower-affinity component may represent intracellular NBMPR binding sites, as has been reported for BeWo cells (Boumah et al., 1992; Mani et al., 1998). The high level of es expression in MVECs is compatible with the previously reported autoradiographic colocalization of [3H]NBMPR labeling with von Willebrand factor VIII staining in both heart (guinea-pig and rat) and brain (rat) sections (Parkinson & Clanachan, 1989; Parkinson & Fredholm, 1991), and supports the hypothesized role of endothelial cells as regulators of adenosine concentrations in the vasculature.
The functional presence of an es-like transporter was confirmed through [3H]FB influx studies. FB has been used extensively as a substrate for the analysis of NTs in mammalian cells due to the fact that it is poorly metabolized (phosphorylated) relative to endogenous nucleosides such as uridine and adenosine over the time periods of these assays (<5 min) (Plagemann & Woffendin, 1989). The finding that FB was accumulated in rat skeletal muscle MVECs to intracellular levels (∼1 μM) not significantly different from the initial extracellular medium concentration (1 μM) confirmed that the transporters operating in these cells, under these experimental conditions (15°C), were truly equilibrative in nature. Na+-dependent FB uptake was observed only at room temperature (not at 15°C) after blockade of the equilibrative systems with dipyridamole/NBMPR. This Na+-dependent uptake was likely mediated by the purine-selective CNT2 transporter, as RT–PCR did not detect the presence of CNT3 (which can also transport FB) in rMVECs, and the Na+-dependent FB uptake component was significantly more sensitive to inhibition by the purine nucleosides (adenosine/guanosine) than pyrimidine nucleosides (thymidine/cytidine). This CNT2-mediated transport component represented less than 1% of the total FB uptake capacity of these cells, and is unlikely to have a major impact on total nucleoside uptake by isolated MVECs in the presence of fully functional es and ei transporters. Given the large apparent difference in CNT2 expression between skeletal muscle tissue and rMVECs (see Figure 9b), it is clear that other cell type(s) in skeletal muscle (possibly myocytes) express much higher levels of CNT2 than do MVECs.
Approximately half of the dipyridamole-sensitive Na+-independent uptake of FB was inhibited by low nanomolar concentrations of NBMPR (IC50=0.46±0.14 nM), characteristic of an es-type transporter. The remaining dipyridamole-sensitive FB influx, seen in the presence of 50 nM NBMPR, was likely mediated by an ei subtype of NT. A 1 : 1 (∼) ratio of es : ei transport activity was also apparent from the similar Vmax values obtained for the dipyridamole-sensitive FB uptake in the presence and absence of 50 nM NBMPR (see Figure 7). These es and ei functional activities were likely mediated, respectively, by the ENT1 and ENT2 transporters expressed by these cells (Figure 9). However, a role for ENT3, which was also expressed by MVECs (see Figures 9 and 10), in the NBMPR-insensitive (ei-mediated) uptake of FB cannot be excluded at this time. ENT3 is thought to be expressed in intracellular organelles, but its functional characteristics have yet to be elucidated (Hyde et al., 2001; Baldwin et al., 2004). FB had a two-fold higher affinity (Km) for the ei transporter relative to the es subtype; a similar selectivity of FB for the ei transporter has been observed previously in a mouse Ehrlich ascites tumor cell model (Burke et al., 1998). Assuming that the high-affinity component of [3H]NBMPR binding represents the plasma membrane es transporter (see above), these data allow the calculation of a translocation rate of ∼45 molecules of FB transporter−1 s−1 for the es transporter of MVECs. This value is about three-fold lower than that reported previously for the es transporter in human erythrocytes (Jarvis & Young, 1980; Jarvis et al., 1982), a difference likely attributable to the reduced temperature at which uptake was measured in the present study.
The high proportion of FB uptake mediated by the ei system in rMVECs (∼50%) is worth noting. Pearson et al. (1978) reported the presence of two carrier-mediated transport processes for nucleosides in cultured pig aortic endothelial cells. The high-affinity component was selectively inhibited by dipyridamole and NBMPR (likely mediated by an es transporter), while the lower-affinity component, which mediated less than 30% of the uptake, was inhibited by adenine. Sobrevia et al. (1994) reported that all of the equilibrative nucleoside transport in HUVECs was sensitive to NBMPR (i.e. no ei-mediated uptake). More recently, Osses et al. (1996) reported that hypoxanthine, a by-product of adenosine metabolism and a nucleobase associated with free radical formation, enters human vascular endothelial cells via a transporter with ei characteristics. In this latter study, the ei system mediated 20–30% of total influx of adenosine, with the remainder mediated by the es transporter. Similarly, Chishty et al. (2003) recently reported that an immortalized rat brain endothelial cell line, RBE4, functionally expressed es, ei, cif and cib transporters, with ei-mediated uptake of adenosine representing 20% of the total influx. While there are clear differences in NT subtype expression among the above cell models (possibly reflecting the different vascular sources and/or culture conditions) (Craig et al., 1998; Unger et al., 2002), in no case did ei represent more than 30% of the total uptake capacity of the cells. Interestingly, high levels of ei-mediated transport have been reported in rat epididymal epithelial cells (Leung et al., 2001), rat erythrocytes (Jarvis & Young, 1986) and rat glial cells (Sinclair et al., 2000), suggesting that a relatively high level of ei-like transporter activity might be a general characteristic of the rat biology. Given the dramatic nine-fold reduction in ENT2 mRNA that was apparent upon culture of the freshly isolated rMVECs (Figure 10c), MVECs in vivo might have an even higher ratio of ENT2 : ENT1 transport activity than the 50 : 50 ratio observed in the in vitro cultures. Unfortunately, it is not possible to obtain sufficient cells to conduct transport assays on the freshly isolated preparations, and antibodies to the rat ENTs are not available, so one can only speculate at this point on the relationship between ENT mRNA levels and transporter protein expression. The ei transporter (unlike es) can accept nucleobases, such as hypoxanthine, as substrates (Osses et al., 1996; Yao et al., 2002). Hypoxanthine is subsequently metabolized to uric acid via xanthine oxidase with the consequent generation of oxygen free radicals. These free radicals are potentially damaging to the cardiovasculature (Abd-Elfattah et al., 1988; Sohn et al., 2003). High levels of ei/ENT2 expression could be a protective mechanism, allowing endothelial cells to release hypoxanthine generated during periods of high adenosine bioavailability. This would reduce the formation of reactive oxygen species in the endothelial cells that would otherwise occur with further intracellular metabolism of hypoxanthine (Kinugasa et al., 2003; Sohn et al., 2003).
The order of potency for the inhibition of NBMPR binding by a series of recognized NT inhibitors (NTBGR>draflazine=dilazep>dipyridamole) was typical of that of the es transporter in rat tissues (Griffith & Jarvis, 1996). All of the inhibitors were strictly competitive in their kinetics, with Ki values derived by the Cheng–Prusoff relationship correlating well with those derived directly by double reciprocal plot analysis. However, it is worth noting that the pseudo-Hill coefficients for these inhibitors were typically less than unity, suggesting the presence of more than one population of NBMPR binding site (compatible with the curvilinear Scatchard profile shown in Figure 1b), or cooperative binding site interactions, in the rat skeletal muscle MVECs. Finally, in the functional uptake assays, draflazine, dilazep and dipyridamole all inhibited FB uptake in a relatively monophasic manner, albeit with shallow concentration–effect profiles (pseudo-nH values <0.6). These shallow inhibitor profiles reflect a differential affinity of these inhibitors for the es and ei transporters in the rMVECs. When similar studies were conducted in the presence of 50 nM NBMPR to block es-mediated formycin B uptake, all of the above-mentioned inhibitors blocked the remaining ei-mediated uptake with Hill coefficients not different from unity.
In summary, our data show that MVECs of rat skeletal muscle express high levels of both inhibitor-sensitive (es/ENT1) and inhibitor-insensitive (ei/ENT2) equilibrative NTs, as well as a minor amount of the purine-selective Na+-dependent transporter cif/CNT2. These transporters are fundamental in the homeostatic control of adenosine concentrations in the vasculature. The high level of ENT expression observed in this study supports the notion that MVECs play a major role in the removal of adenosine from the microcirculation. The finding that 50% or more of the uptake capacity of these cells is mediated by the ei transporter subtype raises issues with regard to the use of the predominantly es-selective NT blockers currently available as adenosine enhancers in experimental rat vascular models. This study forms the basis for further investigations on the regulation of nucleoside and nucleobase uptake and release by MVECs.
Acknowledgments
We wish to acknowledge the laboratory of Dr Karel Tyml for their aid in establishing the initial MVEC cultures, and the laboratory of Dr Subrata Chakrabarti for assistance with the real-time PCR. This study was supported by a grant to JRH from The Heart and Stroke Foundation of Ontario.
Abbreviations
- BSA
bovine serum albumin
- cib
concentrative inhibitor-insensitive nucleoside transporter with broad substrate specificity
- cif
concentrative inhibitor-insensitive formycin B transporter
- cit
concentrative inhibitor-insensitive thymidine transporter
- CNT
concentrative nucleoside transporter
- ECGS
endothelial cell growth supplement
- ei
equilibrative inhibitor-insensitive nucleoside transporter
- ENT
equilibrative nucleoside transporter
- es
equilibrative inhibitor-sensitive nucleoside transporter
- FB
formycin B
- FBS
Fetal Bovine Serum
- MVECs
microvascular endothelial cells
- NBMPR
nitrobenzylmercaptopurineriboside (nitrobenzylthioinosine)
- NBTGR
nitrobenzylthioguanosine
- NT
nucleoside transporter
- PBS
phosphate-buffered saline
References
- ABD-ELFATTAH A.S., JESSEN M.E., LEKVEN J., DOHERTY N.E., III, BRUNSTING L.A., WECHSLER A.S. Myocardial reperfusion injury. Role of myocardial hypoxanthine and xanthine in free radical-mediated reperfusion injury. Circulation. 1988;78:III224–III235. [PubMed] [Google Scholar]
- ACIMOVIC Y., COE I.R. Molecular evolution of the equilibrative nucleoside transporter family: identification of novel family members in prokaryotes and eukaryotes. Mol. Biol. Evol. 2002;19:2199–2210. doi: 10.1093/oxfordjournals.molbev.a004044. [DOI] [PubMed] [Google Scholar]
- ANDERSEN P., SALTIN B. Maximal perfusion of skeletal muscle in man. J. Physiol. 1985;366:233–249. doi: 10.1113/jphysiol.1985.sp015794. [DOI] [PMC free article] [PubMed] [Google Scholar]
- BALDWIN S.A., BEAL P.R., YAO S.Y., KING A.E., CASS C.E., YOUNG J.D. The equilibrative nucleoside transporter family, SLC29. Pflugers Arch. 2004;447:735–743. doi: 10.1007/s00424-003-1103-2. [DOI] [PubMed] [Google Scholar]
- BELT J.A., MARINA N.M., PHELPS D.A., CRAWFORD C.R. Nucleoside transport in normal and neoplastic cells. Adv Enzyme Regul. 1993;33:235–252. doi: 10.1016/0065-2571(93)90021-5. [DOI] [PubMed] [Google Scholar]
- BOUMAH C.E., HOGUE D.L., CASS C.E. Expression of high levels of nitrobenzylthioinosine-sensitive nucleoside transport in cultured human choriocarcinoma (BeWo) cells. Biochem. J. 1992;288:987–996. doi: 10.1042/bj2880987. [DOI] [PMC free article] [PubMed] [Google Scholar]
- BOUSHEL R., LANGBERG H., OLESEN J., NOWAK M., SIMONSEN L., BULOW J., KJAER M. Regional blood flow during exercise in humans measured by near-infrared spectroscopy and indocyanine green. J. Appl. Physiol. 2000;89:1868–1878. doi: 10.1152/jappl.2000.89.5.1868. [DOI] [PubMed] [Google Scholar]
- BURKE T., LEE S., FERGUSON P.J., HAMMOND J.R. Interaction of 2′,2′-difluorodeoxycytidine (gemcitabine) and formycin B with the Na+-dependent and -independent nucleoside transporters of Ehrlich ascites tumor cells. J. Pharmacol. Exp. Ther. 1998;286:1333–1340. [PubMed] [Google Scholar]
- BURNSTOCK G. Potential therapeutic targets in the rapidly expanding field of purinergic signalling. Clin. Med. 2002a;2:45–53. doi: 10.7861/clinmedicine.2-1-45. [DOI] [PMC free article] [PubMed] [Google Scholar]
- BURNSTOCK G. Purinergic signaling and vascular cell proliferation and death. Arterioscler. Thromb. Vasc. Biol. 2002b;22:364–373. doi: 10.1161/hq0302.105360. [DOI] [PubMed] [Google Scholar]
- CHE M., ORTIZ D.F., ARIAS I.M. Primary structure and functional expression of a cDNA encoding the bile canalicular, purine-specific Na+-nucleoside cotransporter. J. Biol. Chem. 1995;270:13596–13599. doi: 10.1074/jbc.270.23.13596. [DOI] [PubMed] [Google Scholar]
- CHENG Y., PRUSOFF W.H. Relationship between the inhibition constant (K1) and the concentration of inhibitor which causes 50 per cent inhibition (I50) of an enzymatic reaction. Biochem. Pharmacol. 1973;22:3099–3108. doi: 10.1016/0006-2952(73)90196-2. [DOI] [PubMed] [Google Scholar]
- CHISHTY M., BEGLEY D.J., ABBOTT N.J., REICHEL A. Functional characterisation of nucleoside transport in rat brain endothelial cells. Neuroreport. 2003;14:1087–1090. doi: 10.1097/01.wnr.0000072843.93264.ff. [DOI] [PubMed] [Google Scholar]
- CHOMCZYNSKI P., SACCHI N. Single-step method of RNA isolation by acid guanidinium thiocyanate–phenol–chloroform extraction. Anal. Biochem. 1987;162:156–159. doi: 10.1006/abio.1987.9999. [DOI] [PubMed] [Google Scholar]
- CLARKE M.L., MACKEY J.R., BALDWIN S.A., YOUNG J.D., CASS C.E. The role of membrane transporters in cellular resistance to anticancer nucleoside drugs. Cancer Treat. Res. 2002;112:27–47. doi: 10.1007/978-1-4615-1173-1_2. [DOI] [PubMed] [Google Scholar]
- COOK M.A., KARMAZYN M. Cardioprotective actions of adenosine and adenosine analogs. Experientia Suppl. 1996;76:325–344. doi: 10.1007/978-3-0348-8988-9_20. [DOI] [PubMed] [Google Scholar]
- CRAIG L.E., SPELMAN J.P., STRANDBERG J.D., ZINK M.C. Endothelial cells from diverse tissues exhibit differences in growth and morphology. Microvasc. Res. 1998;55:65–76. doi: 10.1006/mvre.1997.2045. [DOI] [PubMed] [Google Scholar]
- CRAWFORD C.R., PATEL D.H., NAEVE C., BELT J.A. Cloning of the human equilibrative, nitrobenzylmercaptopurine riboside (NBMPR)-insensitive nucleoside transporter ei by functional expression in a transport-deficient cell line. J. Biol. Chem. 1998;273:5288–5293. doi: 10.1074/jbc.273.9.5288. [DOI] [PubMed] [Google Scholar]
- DEUSSEN A., STAPPERT M., SCHAFER S., KELM M. Quantification of extracellular and intracellular adenosine production: understanding the transmembranous concentration gradient. Circulation. 1999;99:2041–2047. doi: 10.1161/01.cir.99.15.2041. [DOI] [PubMed] [Google Scholar]
- ELY S.W., BERNE R.M. Protective effects of adenosine in myocardial ischemia. Circulation. 1992;85:893–904. doi: 10.1161/01.cir.85.3.893. [DOI] [PubMed] [Google Scholar]
- FEOKTISTOV I., GOLDSTEIN A.E., RYZHOV S., ZENG D., BELARDINELLI L., VOYNO-YASENETSKAYA T., BIAGGIONI I. Differential expression of adenosine receptors in human endothelial cells: role of A2B receptors in angiogenic factor regulation. Circ. Res. 2002;90:531–538. doi: 10.1161/01.res.0000012203.21416.14. [DOI] [PubMed] [Google Scholar]
- GAMBOA A., ERTL A.C., COSTA F., FARLEY G., MANIER M.L., HACHEY D.L., DIEDRICH A., BIAGGIONI I. Blockade of nucleoside transport is required for delivery of intraarterial adenosine into the interstitium. Relevance to therapeutic preconditioning in humans. Circulation. 2003;108:2631–2635. doi: 10.1161/01.CIR.0000101927.70100.41. [DOI] [PubMed] [Google Scholar]
- GRAY J.H., OWEN R.P., GIACOMINI K.M. The concentrative nucleoside transporter family, SLC28. Pflugers Arch. 2004;447:728–734. doi: 10.1007/s00424-003-1107-y. [DOI] [PubMed] [Google Scholar]
- GRIFFITH D.A., JARVIS S.M. Nucleoside and nucleobase transport systems of mammalian cells. Biochim. Biophys. Acta Rev. Biomembr. 1996;1286:153–181. doi: 10.1016/s0304-4157(96)00008-1. [DOI] [PubMed] [Google Scholar]
- GRIFFITHS M., BEAUMONT N., YAO S.Y.M., SUNDARAM M., BOUMAH C.E., DAVIES A., KWONG F.Y.P., COE I., CASS C.E., YOUNG J.D., BALDWIN S.A. Cloning of a human nucleoside transporter implicated in the cellular uptake of adenosine and chemotherapeutic drugs. Nat. Med. 1997a;3:89–93. doi: 10.1038/nm0197-89. [DOI] [PubMed] [Google Scholar]
- GRIFFITHS M., YAO S.Y., ABIDI F., PHILLIPS S.E., CASS C.E., YOUNG J.D., BALDWIN S.A. Molecular Cloning and characterization of a nitrobenzylthioinosine-insensitive (ei) equilibrative nucleoside transporter from human placenta. Biochem. J. 1997b;328:739–743. doi: 10.1042/bj3280739. [DOI] [PMC free article] [PubMed] [Google Scholar]
- HAMMOND J.R. Interaction of a series of draflazine analogues with equilibrative nucleoside transporters: species differences and transporter subtype selectivity. Naunyn Schmiedebergs Arch. Pharmacol. 2000;361:373–382. doi: 10.1007/s002100000214. [DOI] [PubMed] [Google Scholar]
- HAMMOND J.R., STOLK M., ARCHER R.G., MCCONNELL K. Pharmacological analysis and molecular cloning of the canine equilibrative nucleoside transporter 1. Eur. J. Pharmacol. 2004;491:9–19. doi: 10.1016/j.ejphar.2004.03.026. [DOI] [PubMed] [Google Scholar]
- HEWETT P.W., MURRAY J.C. Human microvessel endothelial cells: isolation, culture and characterization. In vitro Cell Dev. Biol. Anim. 1993a;29A:823–830. doi: 10.1007/BF02631356. [DOI] [PubMed] [Google Scholar]
- HEWETT P.W., MURRAY J.C. Immunomagnetic purification of human microvessel endothelial cells using Dynabeads coated with monoclonal antibodies to PECAM-1. Eur. J. Cell Biol. 1993b;62:451–454. [PubMed] [Google Scholar]
- HYDE R.J., CASS C.E., YOUNG J.D., BALDWIN S.A. The ENT family of eukaryote nucleoside and nucleobase transporters: recent advances in the investigation of structure/function relationships and the identification of novel isoforms. Mol. Membr. Biol. 2001;18:53–63. [PubMed] [Google Scholar]
- JARVIS S.M., YOUNG J.D. Nucleoside transport in human and sheep erythrocytes: evidence that nitrobenzylthioinosine binds specifically to functional nucleoside-transport sites. Biochem. J. 1980;190:377–383. doi: 10.1042/bj1900377. [DOI] [PMC free article] [PubMed] [Google Scholar]
- JARVIS S.M., YOUNG J.D. Nucleoside transport in rat erythrocytes: two components with differences in sensitivity to inhibition by nitrobenzylthioinosine and p-chloromercuriphenyl sulfonate. J. Membr. Biol. 1986;93:1–10. doi: 10.1007/BF01871013. [DOI] [PubMed] [Google Scholar]
- JARVIS S.M., HAMMOND J.R., PATERSON A.R.P., CLANACHAN A.S. Species differences in nucleoside transport. Biochem. J. 1982;208:83–88. doi: 10.1042/bj2080083. [DOI] [PMC free article] [PubMed] [Google Scholar]
- KING G.L., BUZNEY S.M., KAHN C.R., HETU N., BUCHWALD S., MACDONALD S.G., RAND L.I. Differential responsiveness to insulin of endothelial and support cells from micro- and macrovessels. J. Clin. Invest. 1983;71:974–979. doi: 10.1172/JCI110852. [DOI] [PMC free article] [PubMed] [Google Scholar]
- KINUGASA Y., OGINO K., FURUSE Y., SHIOMI T., TSUTSUI H., YAMAMOTO T., IGAWA O., HISATOME I., SHIGEMASA C. Allopurinol improves cardiac dysfunction after ischemia–reperfusion via reduction of oxidative stress in isolated perfused rat hearts. Circ. J. 2003;67:781–787. doi: 10.1253/circj.67.781. [DOI] [PubMed] [Google Scholar]
- KISS A., FARAH K., KIM J., GARRIOCK R.J., DRYSDALE T.A., HAMMOND J.R.Molecular cloning and functional characterization of inhibitor-sensitive (mENT1) and inhibitor-resistant (mENT2) equilibrative nucleoside transporters from mouse brain Biochem. J. 2000352363–372.(Part 2) [PMC free article] [PubMed] [Google Scholar]
- KITAKAZE M., MINAMINO T., NODE K., TAKASHIMA S., FUNAYA H., KUZUYA T., HORI M. Adenosine and cardioprotection in the diseased heart. Jpn. Circ. J. 1999;63:231–243. doi: 10.1253/jcj.63.231. [DOI] [PubMed] [Google Scholar]
- LANGBERG H., BJORN C., BOUSHEL R., HELLSTEN Y., KJAER M. Exercise-induced increase in interstitial bradykinin and adenosine concentrations in skeletal muscle and peritendinous tissue in humans. J. Physiol. 2002;542:977–983. doi: 10.1113/jphysiol.2002.018077. [DOI] [PMC free article] [PubMed] [Google Scholar]
- LEUNG G.P., WARD J.L., WONG P.Y., TSE C.M. Characterization of nucleoside transport systems in cultured rat epididymal epithelium. Am. J. Physiol Cell Physiol. 2001;280:C1076–C1082. doi: 10.1152/ajpcell.2001.280.5.C1076. [DOI] [PubMed] [Google Scholar]
- MANI R.S., HAMMOND J.R., MARJAN J.M., GRAHAM K.A., YOUNG J.D., BALDWIN S.A., CASS C.E. Demonstration of equilibrative nucleoside transporters (hENT1 and hENT2) in nuclear envelopes of cultured human choriocarcinoma (BeWo) cells by functional reconstitution in proteoliposomes. J. Biol. Chem. 1998;273:30818–30825. doi: 10.1074/jbc.273.46.30818. [DOI] [PubMed] [Google Scholar]
- MUBAGWA K., FLAMENG W. Adenosine, adenosine receptors and myocardial protection: an updated overview. Cardiovasc. Res. 2001;52:25–39. doi: 10.1016/s0008-6363(01)00358-3. [DOI] [PubMed] [Google Scholar]
- OSSES N., PEARSON J.D., YUDILEVICH D.L., JARVIS S.M. Hypoxanthine enters human vascular endothelial cells (ECV 304) via the nitrobenzylthioinosine-insensitive equilibrative nucleoside transporter. Biochem. J. 1996;317:843–848. doi: 10.1042/bj3170843. [DOI] [PMC free article] [PubMed] [Google Scholar]
- PARKINSON F.E., CLANACHAN A.S. Heterogeneity of nucleoside transport inhibitory sites in heart: a quantitative autoradiographical analysis. Br. J. Pharmacol. 1989;97:361–370. doi: 10.1111/j.1476-5381.1989.tb11962.x. [DOI] [PMC free article] [PubMed] [Google Scholar]
- PARKINSON F.E., FREDHOLM B.B. Effects of propentofylline on adenosine A1 and A2 receptors and nitrobenzylthioinosine-sensitive nucleoside transporters: quantitative autoradiographic analysis. Eur. J. Pharmacol. 1991;202:361–366. doi: 10.1016/0014-2999(91)90279-y. [DOI] [PubMed] [Google Scholar]
- PEARSON J.D., CARLETON J.S., HUTCHINGS A., GORDON J.L. Uptake and metabolism of adenosine by pig aortic endothelial and smooth-muscle cells in culture. Biochem. J. 1978;170:265–271. doi: 10.1042/bj1700265. [DOI] [PMC free article] [PubMed] [Google Scholar]
- PLAGEMANN P.G.W., WOFFENDIN C. Use of formycin B as a general substrate for measuring facilitated nucleoside transport in mammalian cells. Biochim. Biophys. Acta. 1989;1010:7–15. doi: 10.1016/0167-4889(89)90177-8. [DOI] [PubMed] [Google Scholar]
- RITZEL M.W., NG A.M., YAO S.Y., GRAHAM K., LOEWEN S.K., SMITH K.M., HYDE R.J., KARPINSKI E., CASS C.E., BALDWIN S.A., YOUNG J.D. Recent molecular advances in studies of the concentrative Na+-dependent nucleoside transporter (CNT) family: identification and characterization of novel human and mouse proteins (hCNT3 and mCNT3) broadly selective for purine and pyrimidine nucleosides (system cib) Mol. Membr. Biol. 2001;18:65–72. doi: 10.1080/09687680010026313. [DOI] [PubMed] [Google Scholar]
- SHRYOCK J.C., BELARDINELLI L. Adenosine and adenosine receptors in the cardiovascular system: biochemistry, physiology, and pharmacology. Am. J. Cardiol. 1997;79:2–10. doi: 10.1016/s0002-9149(97)00256-7. [DOI] [PubMed] [Google Scholar]
- SINCLAIR C.J., LARIVIERE C.G., YOUNG J.D., CASS C.E., BALDWIN S.A., PARKINSON F.E. Purine uptake and release in rat C6 glioma cells: nucleoside transport and purine metabolism under ATP-depleting conditions. J. Neurochem. 2000;75:1528–1538. doi: 10.1046/j.1471-4159.2000.0751528.x. [DOI] [PubMed] [Google Scholar]
- SOBREVIA L., JARVIS S.M., YUDILEVICH D.L. Adenosine transport in cultured human umbilical vein endothelial cells is reduced in diabetes. Am. J. Physiol. 1994;267:C39–C47. doi: 10.1152/ajpcell.1994.267.1.C39. [DOI] [PubMed] [Google Scholar]
- SOHN H.Y., KROTZ F., GLOE T., KELLER M., THEISEN K., KLAUSS V., POHL U. Differential regulation of xanthine and NAD(P)H oxidase by hypoxia in human umbilical vein endothelial cells. Role of nitric oxide and adenosine. Cardiovasc. Res. 2003;58:638–646. doi: 10.1016/s0008-6363(03)00262-1. [DOI] [PubMed] [Google Scholar]
- THORN J.A., JARVIS S.M. Adenosine transporters. Gen. Pharmacol. 1996;27:613–620. doi: 10.1016/0306-3623(95)02053-5. [DOI] [PubMed] [Google Scholar]
- UNGER R.E., KRUMP-KONVALINKOVA V., PETERS K., KIRKPATRICK C.J. In vitro expression of the endothelial phenotype: comparative study of primary isolated cells and cell lines, including the novel cell line HPMEC-ST1.6R. Microvasc. Res. 2002;64:384–397. doi: 10.1006/mvre.2002.2434. [DOI] [PubMed] [Google Scholar]
- VAN BELLE H. Nucleoside transport inhibition: a therapeutic approach to cardioprotection via adenosine. Cardiovasc. Res. 1993;27:68–76. doi: 10.1093/cvr/27.1.68. [DOI] [PubMed] [Google Scholar]
- VINTEN-JOHANSEN J., THOURANI V.H., RONSON R.S., JORDAN J.E., ZHAO Z.Q., NAKAMURA M., VELEZ D., GUYTON R.A. Broad-spectrum cardioprotection with adenosine. Ann. Thorac. Surg. 1999;68:1942–1948. doi: 10.1016/s0003-4975(99)01018-8. [DOI] [PubMed] [Google Scholar]
- WAKADE A.R., PRZYWARA D.A., WAKADE T.D. Intracellular, nonreceptor-mediated signaling by adenosine: induction and prevention of neuronal apoptosis. Mol. Neurobiol. 2001;23:137–153. doi: 10.1385/MN:23:2-3:137. [DOI] [PubMed] [Google Scholar]
- WARD J.L., SHERALI A., MO Z.P., TSE C.M. Kinetic and pharmacological properties of cloned human equilibrative nucleoside transporters, ENT1 and ENT2, stably expressed in nucleoside transporter-deficient PK15 cells. Ent2 exhibits a low affinity for guanosine and cytidine but a high affinity for inosine. J. Biol. Chem. 2000;275:8375–8381. doi: 10.1074/jbc.275.12.8375. [DOI] [PubMed] [Google Scholar]
- WILSON J.X., DIXON S.J., YU J., NEES S., TYML K. Ascorbate uptake by microvascular endothelial cells of rat skeletal muscle. Microcirculation. 1996;3:211–221. doi: 10.3109/10739689609148290. [DOI] [PubMed] [Google Scholar]
- YAO S.Y., NG A.M., MUZYKA W.R., GRIFFITHS M., CASS C.E., BALDWIN S.A., YOUNG J.D. Molecular cloning and functional characterization of nitrobenzylthioinosine (NBMPR)-sensitive (es) and NBMPR-insensitive (ei) equilibrative nucleoside transporter proteins (rENT1 and rENT2) from rat tissues. J. Biol. Chem. 1997;272:28423–28430. doi: 10.1074/jbc.272.45.28423. [DOI] [PubMed] [Google Scholar]
- YAO S.Y., NG A.M., SUNDARAM M., CASS C.E., BALDWIN S.A., YOUNG J.D. Transport of antiviral 3′-deoxy-nucleoside drugs by recombinant human and rat equilibrative, nitrobenzylthioinosine (NBMPR)-insensitive (ENT2) nucleoside transporter proteins produced in Xenopus oocytes. Mol. Membr. Biol. 2001;18:161–167. doi: 10.1080/09687680110048318. [DOI] [PubMed] [Google Scholar]
- YAO S.Y., NG A.M., VICKERS M.F., SUNDARAM M., CASS C.E., BALDWIN S.A., YOUNG J.D. Functional and molecular characterization of nucleobase transport by recombinant human and rat equilibrative nucleoside transporters 1 and 2. Chimeric constructs reveal a role for the ENT2 helix 5–6 region in nucleobase translocation. J. Biol. Chem. 2002;277:24938–24948. doi: 10.1074/jbc.M200966200. [DOI] [PubMed] [Google Scholar]


