Abstract
The multicellular, slug stage of the slime mould Dictyostelium discoideum lacks specific sensory cells and organs but can nevertheless respond in a very sensitive manner to external stimuli such as temperature and light. Within the migrating slug, the behavior of up to 100,000 individual amoebae is coordinated by cAMP mediated cell–cell signaling and chemotaxis. We report here the striking result that light directly modulates the cAMP cell–cell signaling system. Light-induced secretion of cAMP from the slug tips decreased the period length of optical density waves and speeded up cell movement. A local effect of light on cAMP release within the slug tip could modulate cell movement within the slug and thus control its phototactic turning and orientation toward a light source.
Keywords: phototaxis, cell–cell signaling
Amoebae of the cellular slime mould Dictyostelium discoideum normally live as single cells in forest litter and feed on bacteria. Starvation induces the transition from the unicellular stage to the multicellular stage. Chemotactic aggregation of up to 100,000 cells forms a multicellular mass, which behaves as a single organism and ultimately transforms into a fruiting body consisting of a stalk and a spore head. Beginning ≈4–6 hr after removal of the food source, individual amoebae start to aggregate in response to periodic cAMP signals initiated at the center of aggregation and transmitted outward from cell to cell as a traveling wave of cAMP. In turn, these cAMP waves direct the coordinated inward movement of the amoebae by chemotaxis (for review, see ref. 1).
Aggregation results in the formation of a cylindrical migrating slug. Slugs are sensitive to light, pH, and even slight differences in temperature, which allows them to migrate toward an optimal location for fruiting. Slugs are polar with a tip at the anterior consisting of prestalk cells whereas the posterior consists predominately of prespore cells. Phototactic turning is initiated in the tip and slugs sense light only in the anterior prestalk zone (2–5). Several experiments have shown that waves of cAMP are generated in the tip and relayed to the posterior prespore zone and that these cAMP waves coordinate the movement of cells and hence the movement of the slug (6–12). Consistent with this, transfer of slugs to substrates containing adenosine or caffeine, both cAMP-signaling antagonists, impairs phototaxis (13). Furthermore, overexpression of a mutant regulatory subunit of the cAMP-dependent kinase (PKA), which suppresses the stimulation by cAMP, also impairs slug phototaxis (14). Although individual amoebae show a weak phototactic response, it is much less accurate than that of a slug (15, 16). Thus, the mechanism of phototaxis seems to be linked closely to the multicellular state. Recent observations on slug formation in an adenylyl cyclase mutant (17) are not consistent with the foregoing interpretation but may have an alternative explanation (see Discussion).
To investigate how light produces a phototactic reaction, we analyzed the influence of light irradiation on cell–cell signaling and cell movement at different stages during multicellular development. Cell movement behavior was observed using near infrared light that was inactive for phototaxis. Our results show that light acts directly on the cAMP-signaling system. Aggregating cells changed their periodicity of cAMP signaling, and slug tip cells released cAMP upon light irradiation. Concomitant changes in cell movement also occurred in slug cells. These results suggest that light acts on both cAMP signaling and cell movement activity.
Materials and Methods
Cell Culture and Slug Preparation.
D. discoideum strain NC-4 grown on bacteria Klebsiella aerogenes was used in all experiments. All cell culture and experiments were done at 22 ± 1°C. Cells were grown on nutrient agar plates (18) for 48 ± 4 hr and washed by centrifugation with filter-purified water (Milli-Q Plus water purification system, Millipore) for slug preparation or with KK2 buffer (20 mM K2HPO4/KH2PO4, pH6.8) for cell preparation. For slug preparations, a small drop of concentrated cells (108 cells/ml) was placed on non-nutrient water agar (Difco bacto-agar, 0.8% wt/vol) for development. The agar plates were enclosed in a metal box to keep them absolutely dark during incubation. Slugs formed after ≈24 hr and started to migrate away from the drop; these were used for all experiments. For cell preparations, 1 ml of cell suspension (5 × 10⁶ cells/ml KK2 buffer) was spread on a KK2 agar plate (0.8% wt/vol) and kept still for 30 min for adhesion of the cells to substrate, and then the supernatant was decanted. car1−/car3− Cell line RI-9 (19) was grown in HL5 medium (20) supplemented with 0.1% geneticin (ICN) and 1% penicillin-streptomycin (Sigma) and harvested at the late log phase of development. Further cell preparation followed the same procedure as wild-type NC-4.
Microscopy.
Cell movement was observed with a microscope (Axiovert 100TV, Zeiss) equipped with 10X and 20X objectives (Plan-Neofluor, Zeiss). The illumination light was filtered with a near infrared short pass filter (half-maximum at 800 nm; 800FL07–50s, Andover, Salem, NH) in all experiments. Digital images were acquired with a high sensitivity cooled CCD camera (C4880, Hamamatsu Photonics, Hamamatsu, Japan) controlled by hipic software (Hamamatsu Photonics).
Dark Chamber and Light Stimulation.
An aluminum dark chamber was constructed. Agar plates (85 mm × 15 mm) with slugs or cells were fitted into the chamber, which was then tightly closed to avoid changes in humidity. Slugs and cells were observed from the ventral side through a hole. The lid of the dark chamber was equipped with a long-pass red filter (half-maximum at 695 nm; 695FG-07–50s, Andover) and thus allowing observation of slugs and cells under light illumination well above phototactic action spectrum (2, 21). To irradiate with light within the action spectrum of the slug, the red filter was replaced with short-pass blue filter (half-maximum at 600 nm; 600FL07–50s, Andover).
Effect of Light in Early Aggregation Phase.
Plates with cells were kept in the dark and then transferred to the dark chamber at various times during aggregation and observed with phase contrast microscopy. Time lapse images were acquired every 20 sec and analyzed using a software scionimage (ver. b3, Scion, Frederick, MD). For cell movement analysis, the image sequence was first binarized to obtain cell shapes. Then the t image was subtracted from t+1 image, resulting in an image containing positive or negative pixel values of the cell area that protruded or retracted during the time interval of 20 sec. The number of these pixels represents the movement activity of the cells. Approximately 200 cells were measured in one image and their values were averaged.
Effect of Light in Late Aggregation Phase.
Spores were placed in the center of growing bacteria lawn on nutrient agar plate (18). Amoebae germinated from the spores and eventually formed an enlarging plaque with large cell streams at the edge of the plaque. Recording of dark-field waves in the stream was started after the plate was enclosed in the dark chamber and adapted to the dark condition for 30 min. Light irradiation was initiated by removing the long-pass red filter, and thus the light was irradiated only at a local spot within a stream under the illumination field of microscope. The effect of light irradiation on the parameters of the dark-field waves was analyzed by time-space plots as described in detail elsewhere (22).
Effect of Light on Cell–Cell Signaling in Slugs.
Plates with cells were kept in the dark for 1 hr after washing off bacteria. The anterior tip of a slug from a plate prepared 1 day before was dissected and gently placed in the field of migrating cells. An agar film (2% wt/vol KK2 buffer) was laid over the tip fragment to suppress its three-dimensional movement. The plate was then transferred to the dark chamber and images were recorded every 30 sec. The slug tip attracted cells initially after transfer to the dark chamber. This effect decayed within ≈30 min and was presumably due to light stimulation during tip cutting and transfer. After ≈50–60 min, cell movement became random and light effects could be studied. Cell movement was analyzed during 40 min before and 20 min after light irradiation using scionimage software and by manually tracking the cells. RI-9 cells were assayed for their chemotactic ability by two different methods. In the first assay, cell movement toward glass needle filled with cAMP (≈1–100 μM) or folic acid (100 μM ∼ 1 mM) was analyzed. In the second method, dense cell drops of wild-type or mutant cells (108 cells/ml, ℘ 1 ± 0.3 mm) were placed on chemoattractant containing agar substrate (100 μM cAMP or 1 mM folic acid in 0.8% agar/KK2 buffer). Outward-directed gradients of the chemoattractant were formed from the cell spots by hydrolysis of cAMP or folic acid. Outward migration of the cells was used to assess the chemotaxis ability. Both assays indicated that RI-9 cells did not acquire chemotactic ability to cAMP until 4.5 hr after the starvation. Thus, cells within 4.5 hr after starvation were used for the assay. Mutant cells did show chemotaxis toward folic acid (≈100 μM–1 mM) within the first 4.5 hr after the starvation, indicating that their chemotaxis deficiency was specific to cAMP.
DiR Staining of Cells and Analysis of Cell Movement in Slugs.
The cells of a slug (2–5%) were labeled with DiR [DiIC18(7); Molecular Probes] by incubating 106-washed cells in 1 ml of DiR solution (25 μg of DiR/1 ml of KK2 buffer) for 30 min in the dark. Then the stained cells were washed twice, mixed with unstained cells, and allowed to form slugs as described. To restrict three-dimensional movement, slugs were overlaid with an agar as described. After 1.5 hr incubation in the dark, cell movement was analyzed. The DiR signal was detected with the use of a specific filter set (XF49, Omega Optical, Brattleboro, VT) inserted into the light path between sample and a xenon lamp. Excitation and emission wavelength of DiR were 750 nm and 780 nm, respectively, well above the range of light active in phototaxis (2, 21). Slugs with 100% DiR-labeled cells were normally phototactic (data not shown). DiR-stained cells were manually tracked and analyzed using scionimage software.
Results
Light Induces Release of cAMP from Slug Tips.
To assay light effects on cell–cell signaling, we irradiated slug tips placed in a field of aggregation competent cells. Such tips attract cells and act as aggregation centers by releasing cAMP (23–25). If light affects cAMP signaling in the tips, we expect a change in chemotactic activity of the aggregation competent cells.
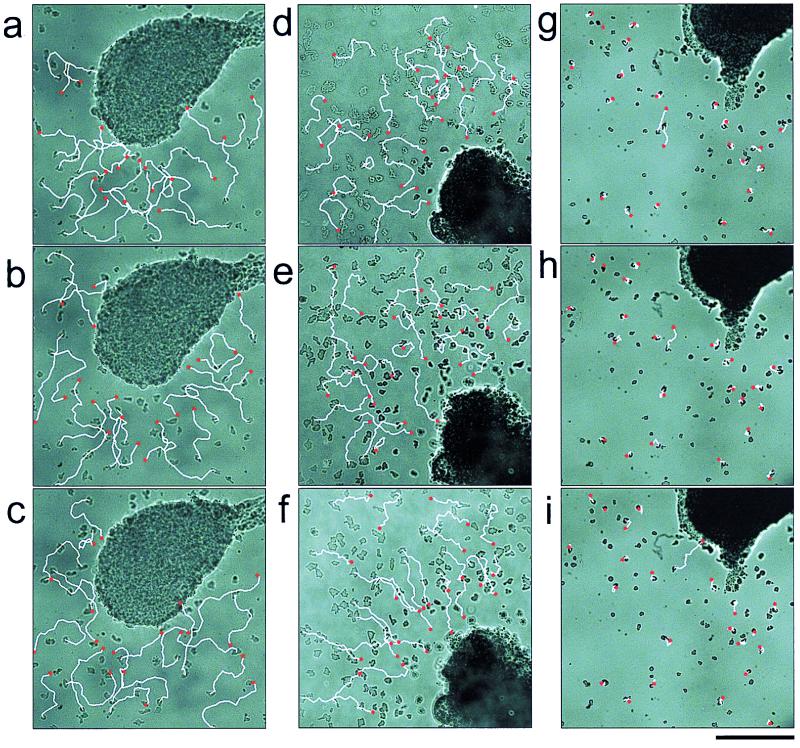
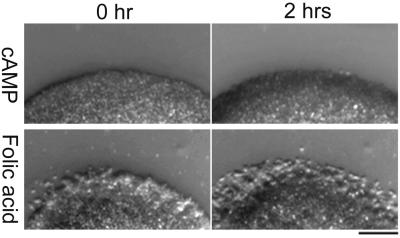
Tips were transplanted to a field of preaggregation cells that could respond to cAMP but not to light (see later, Fig. 3b) In the dark, cells showed a weak tendency to migrate toward the transplanted slug tip due to diffusion of small amounts of cAMP (refs. 24 and 25; Fig. 1 a–c). However, after 10 min of light irradiation we observed a dramatic increase in chemotactic activity (Fig. 1 d–f): most of the cells in the field migrated straight toward the transplanted tip. The velocity of cell movement was not affected by light. To test whether the emitted chemoattractant was cAMP, we repeated the experiment with mutant cells lacking cAMP receptors. In this mutant strain, both the car1 and car3 genes encoding cAMP receptors are deleted. The cells are not chemotactic toward cAMP (Fig. 2) and are not able to aggregate (19). The car1−/car3− cells did not show oriented movement toward transplanted tips either before or after light irradiation (Fig. 1 g–i) and thus we conclude that cAMP is the chemotactic signal released by tips following light irradiation. As a control, we confirmed that the car1−/car3− cells had normal chemotactic activity when folic acid was used as a chemoattractant (Fig. 2).
Figure 3.
Light increases cAMP oscillation frequency during early aggregation. Cells in aggregation phase were analyzed for their change in movement activity upon light irradiation. Cells migrating on an agar substrate in a dark chamber (a) were starved in the dark for 2 hr (b), 4 hr (c), and 6.5 hr (d). Images were taken with infrared light. Irradiation with active light started after recording ≈40 min in the dark. Cell activity is a measure of the change in cell shape between two consecutive image frames (in pixels × 10−6) for the whole field of cells. (Bar = 0.2 mm).
Figure 1.
Slug tips release cAMP upon light irradiation. A dissected slug tip was placed in a field of preaggregation cells and overlaid with an agar film (2% wt/vol KK2 buffer, pH6.8). Each column shows three consecutive 10-min periods from 50 to 80 min after the overlay. White lines indicate cell movement during the 10-min period; red dots indicate the final positions of the cells. (a–c) Wild-type NC-4 cells. Cell tracks of preaggregation cells in the dark. The slug tip is visible at the center of each image. (d–f) Wild-type NC-4 cells. Light irradiation was started 60 min after the agar overlay (e). The tip is visible at the right-bottom corner of each image. The experiment was repeated six times with the same result. (g–i) Mutant car1−/car3− cells. Light irradiation was started 60 min after the agar overlay (h). Mutant cells were not as motile as wild-type cells (short tracks) and showed no orientation toward the tip. (Bar = 0.2 mm).
Figure 2.
Chemotactic behavior of car1−/car3− cells. Washed car1−/car3− cells (108 cells/ml) were spotted on the KK2 agar containing 100 μM cAMP or 1 mM folic acid. Micrographs show edge of spot at 0 hr and 2 hr. Cells migrated out from the spot on folic acid (2 hr) but not on cAMP. (Bar = 0.2 mm).
Light Increases the Frequency of cAMP Waves During Aggregation.
Next, we tested if light had an influence on aggregating cells. Two hours after starvation individual amoebae migrated randomly (Fig. 3a). At this time point, cell movement activity, assayed as net movement between two images of a time lapse series, was constant in dark conditions (Fig. 3b; see Materials and Methods for details). Even though some cells may move periodically (26), the periodicity is averaged out by summing the activity of a few hundred cells. Light irradiation of the whole observation field did not change this constant level of activity (Fig. 3b). By 4 hr after starvation, the amoebae began to show periodic changes in cell movement activity indicating that they were in aggregation phase (Fig. 3c) and that their movement was being synchronized by cAMP waves, which propagated across the field of observation. The amoebae increased their movement activity when cAMP increased and transiently decreased their movement activity when they adapted to the stimulus and the cAMP concentration decreased again (22, 27, 28). In the dark, we observed five oscillations per hour, which corresponds to an average period length of 12 min (Fig. 3c). After light irradiation, the period of oscillation decreased quickly to an average of 8.5 min (Fig. 3c). This effect was even more pronounced at 6.5 hr after starvation (Fig. 3d). When cells were kept in the dark without light stimulation for a similar period of time, no such change in the frequency occurred.
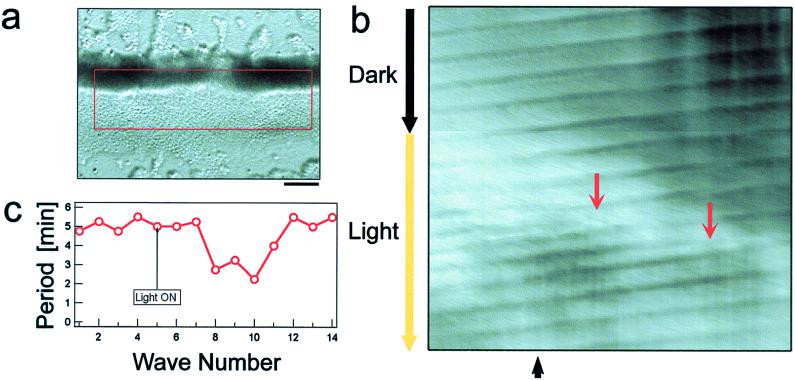
A similar response to light was observed at later stages when cells formed cell–cell contacts and migrated in aggregation streams. In the aggregation stream shown in Fig. 4a, cAMP waves could be detected under the dark-field illumination as waves of periodic cell shape change propagating from right to left. Fig. 4b shows a time-space plot (22) in which the dark-field waves are shown as tilted dark lines (see Fig. 4 legend for details of the time-space plot). Light irradiation was started at the time indicated on the ordinate. A transient increase in the frequency of dark-field waves is visible in the time-space plot as a narrowing of the spacing between successive waves. Because the stimulating light only illuminated a small spot of the stream, which did not include the aggregation center, this increase is due to new waves induced at the irradiated spot and not at the aggregation center (Fig. 4b, red arrows). When the stream was kept in the dark without light stimulation for a similar period of time, no such induction of waves occurred. The propagation speed of the waves remained constant as indicated by the unaltered slope of the band pattern. Fig. 4c shows the period of each of the successive waves. A transient decrease in the period occurred within 10 min after light irradiation. From these experiments, we conclude that light also acts on the dynamics of cAMP relay during late aggregation.
Figure 4.
Light induces the formation of new cAMP waves in aggregation streams. (a) A bright-field image of an aggregation stream. The red square indicates the window that was used for time-space plot acquisition. (b) Time space plot showing dark-field waves propagating from right to left along the stream. The x axis corresponds to the length of the stream in the red window in a. Intensity of vertical one-pixel-wide column in red window was averaged for each column along the length of the stream and then the average values were represented in single pixels in b. This procedure resulted in a horizontal bar with one-pixel height and the width of the red window. The procedure was repeated for every frame of the sequence and the bars were aligned from top to bottom along the y axis to show the temporal change in the position of dark-field wave along the length of the stream. Thus, tilted dark lines in the figure show the change in the position of dark-field waves within the stream. Images were taken every 20 sec. Light irradiation was started at a time point indicated at the left side of the time-space plot and was confined to the region under the illumination field of microscope. Upon light irradiation, new waves formed (red arrows). The spacing between dark-field waves corresponds to the period of each wave. Periods were measured at the position indicated by the black arrow at the bottom of the figure and were plotted in the graph (c). (Bar = 0.2 mm).
Light Activates Movement of Prestalk Cells.
We initially tried to analyze cell movement activity within migrating slugs, but this turned out to be very difficult, because the cells moved out of the field of observation before we were able to detect changes in cell movement. Moreover, the three-dimensional movement of cells in slugs hindered precise cell tracking. For these reasons, we adopted an alternative procedure in which slugs were overlaid with a thin agar film to flatten them slightly. This restricted cell movement to two dimensions and also restricted slug translocation. Under these conditions, slugs became disc shaped after 1–2 hr and showed strong rotational movement that continued for several hours. In some cases we even observed the formation of a fruiting body, thus demonstrating the viability of the cells. The analysis of cell movement was possible under these conditions because slugs rotated rather than migrating away, and cell movement was confirmed within a flat two-dimensional space. To follow cell movement, prestalk cells were stained with the vital dye neutral red (29). Upon light irradiation the disc-shaped slugs showed several pronounced responses: first, neutral red stained prestalk cells speeded up; second, a group of the prestalk cells, the presumptive tip, migrated toward the periphery in a coordinated manner; and third, the whole structure underwent repeated pronounced contractions (data not shown).
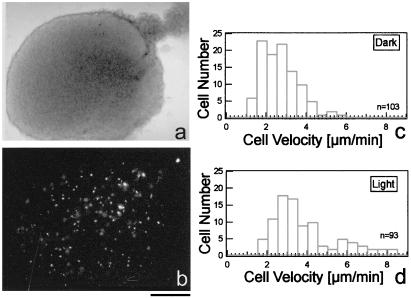
Although changes in cell velocity following light irradiation could be clearly observed in time lapse video sequences, the resolution was not sufficient for a precise measurement of cell speed. Furthermore, observation using near infrared light blurred the images and hindered single cell tracking. To analyze cell movement in slugs more precisely, we labeled ≈2–5% of the slug cells with the cell marker DiR (Fig. 5 a and b) and tracked single-labeled cells in slugs interactively. Fig. 5c shows that average velocity of cells in the dark was ≈2–3 μm/min. The response of the DiR-stained slugs to light was comparable with that of neutral red-stained slugs: there was a visible change in speed of some cells and the slug underwent pronounced contractions (see above). The results of tracking individual DiR-labeled cells indicated a significant increase in cell speed in ≈15% of labeled cells (Fig. 5d). We assume that this subpopulation corresponds to the prestalk cell population (30, 31). There was also an increase in velocity of the remaining cells as shown in Fig. 5d. This increase was delayed relative to the response of the most active prestalk cells, suggesting that the light stimulus was first perceived by the prestalk cells and then transmitted to the prespore cells.
Figure 5.
Light activates prestalk cell movement. The change in cell velocity before and after light irradiation was measured in slugs with ≈2–5% DiR-stained cells. (a) A phase contrast image of a slug 3 hr after the agar overlay. (b) The same slug observed with epi-fluorescence microscopy. Images were taken every 30 sec. (c and d) Distribution of cell velocities in the dark (n = 7, c) and after light irradiation (n = 6, d). The velocity was measured only in cells that could be tracked for the whole sequence before and after light irradiation (180 min). (Bar = 0.1 mm).
Discussion
Our results demonstrate that light affects cAMP signaling in D. discoideum. Light increased the frequency of cAMP pulsing both before and after the formation of cell–cell contacts at the aggregation stage. Light also stimulated the release of cAMP from slug tips. Taken together, these results indicate that light stimulates cAMP pulsing in the cell–cell-signaling system. This result is the first indication of a direct influence of light on cAMP signaling and is in good agreement with previous reports that cAMP signaling is involved in phototaxis (13, 14, 32–34).
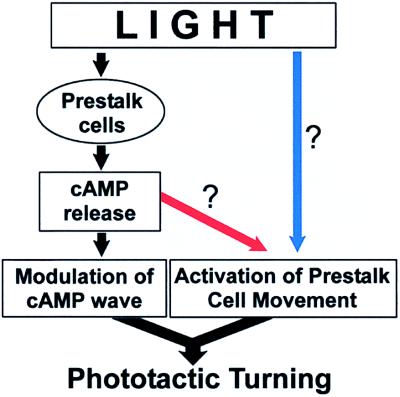
Our results also show that light irradiation increased cell movement activity (Fig. 5). This could be due either to a direct effect (Fig. 6, blue arrow) or to an indirect effect of light on cell movement (Fig. 6, red arrow). Although we have no direct evidence, it appears more likely that the light effect on cell movement is an indirect result of light-induced stimulation of cAMP release. Several results support this view. First, the light only stimulated aggregation and slug stage cells and did not activate the movement of preaggregation cells (Fig. 3b). Thus, the light response required the transition to the multicellular stage and was correlated with the development of cAMP-signaling system. Second, light was shown to stimulate cAMP release from the slug tip cells (Fig. 1), and hence, we expect increased levels of cAMP in the light-irradiated two-dimensional slug. This increase is correlated with an increased movement activity of neutral red-stained prestalk cells (see Results and Fig. 5d) and thus is consistent with published results showing that prestalk cells exhibit a stronger chemotactic response to cAMP than prespore cells (10, 11, 35, 36).
Figure 6.
A possible scheme of light effects in slug phototaxis. Light induces cAMP release from prestalk cells. This modulates cAMP cell–cell signaling and may activate prestalk cell movement. These changes in multicellular coordination act to turn the slug tip. Whether light activates prestalk cell movement directly (blue arrow) or indirectly (red arrow) remains to be clarified.
The present results appear to conflict with a study showing that slug formation and slug movement can occur in a mutant strain carrying a deletion in adenylyl cyclase A gene (acaA-PKA-C; ref. 17). However new measurements have shown that cAMP activity can be detected in the ACA null strain (37). Furthermore, a novel adenylyl cyclase (ACB) has recently been discovered that is active in slugs (38). Both these observations support the idea that cAMP organizes slug behavior and can be involved in phototaxis.
Models for Phototaxis.
Two hypotheses have been proposed to explain phototactic turning (32, 33). The differential speed hypothesis assumes that light locally speeds up cell movement in the tip thus leading to bending of the anterior zone toward the light source. The tip organizer hypothesis assumes that light acts directly on cell–cell signaling by shifting the position of the organizing center in the tip. The hypotheses are not mutually exclusive because the tip organizer entrains cells and possibly accelerates the cell movement (33).
Our findings are consistent with elements of both the differential speed hypothesis and the tip organizer hypothesis. Light speeds up the movement of prestalk cells as proposed in the differential speed hypothesis. At the same time light also stimulates the release of cAMP in agreement with the tip organizer hypothesis. In slugs undergoing phototaxis, unilateral light would affect only one side of the slug tip. This would induce unilateral cAMP release and change the geometry of the propagating cAMP wave, thus orienting the slug tip toward the light source. Because this mechanism of phototaxis depends on cell–cell signaling, it becomes evident why phototaxis is pronounced in the multicellular stage but not in single cells. Fig. 6 summarizes this model schematically. Phototaxis is mediated by two processes: light induces the cAMP release that entrains cells and light affects the speed of prestalk cell movement. Whether the latter effect is direct (blue arrow) or indirect via cAMP release (red arrow) is not clearly resolved although the present experiments appear to favor the chemokinesis hypothesis (see above).
Recently it was reported that, spontaneous turning is not accompanied by a change in cell speed in a flattened two-dimensional slug (39). Because phototaxis was not involved in these experiments and because the mechanism of spontaneous turning and phototactic turning may differ, the question of whether cell speed changes are required for phototactic slug turning cannot be answered present. To address this question, we are now carrying out a detailed analysis of the cell behavior in phototaxing slugs.
Acknowledgments
We are grateful to Dr. C. J. Weijer for his kind gift of mutant cell line RI-9. We thank Dr. C. N. David for his support of this work, for helpful discussions, and for critically reading the manuscript. This work was supported by the Deutsche Forschungsgemeinschaft (SI 571/4–1).
Footnotes
Article published online before print: Proc. Natl. Acad. Sci. USA, 10.1073/pnas.040554497.
Article and publication date are at www.pnas.org/cgi/doi/10.1073/pnas.040554497
References
- 1.Devreotes P. Science. 1989;245:1054–1058. doi: 10.1126/science.2672337. [DOI] [PubMed] [Google Scholar]
- 2.Francis D W. J Cell Compar Physiol. 1964;64:131–138. doi: 10.1002/jcp.1030640113. [DOI] [PubMed] [Google Scholar]
- 3.Poff K L, Loomis W F. Exp Cell Res. 1973;82:236–240. doi: 10.1016/0014-4827(73)90266-8. [DOI] [PubMed] [Google Scholar]
- 4.Hader D P, Burkart U. Exp Mycol. 1983;7:1–8. [Google Scholar]
- 5.Fisher P R, Dohrmann U, Williams K L. In: Modern Cell Biology. Satir B H, editor. New York: Liss; 1984. pp. 197–248. [Google Scholar]
- 6.Durston A J, Vork F. J Cell Sci. 1979;36:261–279. doi: 10.1242/jcs.36.1.261. [DOI] [PubMed] [Google Scholar]
- 7.Rubin J. J Embryol Exp Morphol. 1976;36:261–271. [PubMed] [Google Scholar]
- 8.Siegert F, Weijer C J. Proc Natl Acad Sci USA. 1992;89:6433–6437. doi: 10.1073/pnas.89.14.6433. [DOI] [PMC free article] [PubMed] [Google Scholar]
- 9.Siegert F, Weijer C J. Curr Biol. 1995;5:937–943. doi: 10.1016/s0960-9822(95)00184-9. [DOI] [PubMed] [Google Scholar]
- 10.Sternfeld J, David C N. Differentiation. 1981;20:10–21. [Google Scholar]
- 11.Traynor D, Kessin R H, Williams J G. Proc Natl Acad Sci USA. 1992;89:8303–8307. doi: 10.1073/pnas.89.17.8303. [DOI] [PMC free article] [PubMed] [Google Scholar]
- 12.Bretschneider T, Siegert F, Weijer C J. Proc Natl Acad Sci USA. 1995;92:4387–4391. doi: 10.1073/pnas.92.10.4387. [DOI] [PMC free article] [PubMed] [Google Scholar]
- 13.Darcy P K, Fisher P R. J Cell Sci. 1990;96:661–667. [Google Scholar]
- 14.Bonner J, Williams J. Dev Biol. 1994;164:325–327. doi: 10.1006/dbio.1994.1202. [DOI] [PubMed] [Google Scholar]
- 15.Fisher P R, Williams K L. FEMS Microbiol Lett. 1981;12:87–89. [Google Scholar]
- 16.Fisher P R, Hader D P, Williams K L. FEMS Microbiol Lett. 1985;29:43–47. [Google Scholar]
- 17.Wang B, Kuspa A. Science. 1997;277:251–254. doi: 10.1126/science.277.5323.251. [DOI] [PubMed] [Google Scholar]
- 18.Sussman M. In: Methods in Cell Biology. Spudich J A, editor. Vol. 28. Orlando, FL: Academic; 1987. pp. 9–29. [DOI] [PubMed] [Google Scholar]
- 19.Insall R H, Soede R D M, Schaap P, Devreotes P N. Mol Biol Cell. 1994;5:703–711. doi: 10.1091/mbc.5.6.703. [DOI] [PMC free article] [PubMed] [Google Scholar]
- 20.Watts D J, Ashworth J M. Biochem J. 1970;119:171–174. doi: 10.1042/bj1190171. [DOI] [PMC free article] [PubMed] [Google Scholar]
- 21.Poff K L, Hader D P. Photochem Photobiol. 1984;39:433–436. [Google Scholar]
- 22.Siegert F, Weijer C. J Cell Sci. 1989;93:325–335. [Google Scholar]
- 23.Bonner J T. J Exp Zool. 1949;110:259–271. doi: 10.1002/jez.1401100206. [DOI] [PubMed] [Google Scholar]
- 24.Maeda Y. Dev Growth Differ. 1977;19:201–295. doi: 10.1111/j.1440-169X.1977.00201.x. [DOI] [PubMed] [Google Scholar]
- 25.Rubin J, Robertson A. J Embryol Exp Morphol. 1975;33:227–241. [PubMed] [Google Scholar]
- 26.Wessels D, Vawterhugart H, Murray J, Soll D R. Cell Motil Cytoskeleton. 1994;27:1–12. doi: 10.1002/cm.970270102. [DOI] [PubMed] [Google Scholar]
- 27.Tomchik K J, Devreotes P N. Science. 1981;212:443–446. doi: 10.1126/science.6259734. [DOI] [PubMed] [Google Scholar]
- 28.Alcantara F, Monk M. J Gen Microbiol. 1974;85:321–334. doi: 10.1099/00221287-85-2-321. [DOI] [PubMed] [Google Scholar]
- 29.Weijer C J, David C N, Sternfeld J. In: Methods in Cell Biology. Spudich J A, editor. Vol. 28. Orlando, FL: Academic; 1987. pp. 449–459. [DOI] [PubMed] [Google Scholar]
- 30.Sternfeld J, David C N. Dev Biol. 1982;93:111–118. doi: 10.1016/0012-1606(82)90244-5. [DOI] [PubMed] [Google Scholar]
- 31.Loomis W F. The Development of Dictyostelium Discoideum. New York: Academic; 1982. [Google Scholar]
- 32.Fisher P R. BioEssays. 1997;19:397–407. doi: 10.1002/bies.950190507. [DOI] [PubMed] [Google Scholar]
- 33.Bonner J T. FEMS Microbiol Lett. 1994;120:1–8. [Google Scholar]
- 34.Fisher P R. Review Series on Photobiology. Vol. 1. Amsterdam: Elsevier; 2000. , in press. [Google Scholar]
- 35.Early A, Abe T, Williams J. Cell. 1995;83:91–99. doi: 10.1016/0092-8674(95)90237-6. [DOI] [PubMed] [Google Scholar]
- 36.Mee J D, Tortolo D M, Coukell M B. Biochem Cell Biol. 1986;64:722–732. [Google Scholar]
- 37.Meima E M, Schaap P. Dev Biol. 1999;212:182–190. doi: 10.1006/dbio.1999.9352. [DOI] [PubMed] [Google Scholar]
- 38.Kim H J, Chang W T, Meima M, Gross J D, Schaap P. J Biol Chem. 1998;273:30859–30862. doi: 10.1074/jbc.273.47.30859. [DOI] [PubMed] [Google Scholar]
- 39.Bonner J T. Proc Natl Acad Sci USA. 1998;95:9355–9359. doi: 10.1073/pnas.95.16.9355. [DOI] [PMC free article] [PubMed] [Google Scholar]


