Abstract
Imaging of P-glycoprotein (P-gp) function in the blood–brain barrier (BBB) may support development of strategies, which will improve drug delivery to the brain. [11C]verapamil has been developed as a positron emission tomography (PET) tracer, to image P-gp function in vivo. Ideally, for the purpose of brain imaging, tracers should have a log P between 0.9 and 2.5. The β-receptor antagonist carvedilol is a P-gp substrate with a log P=2.0, and can be labeled with [11C]. The aim of this study was to determine whether the P-gp substrate [11C]carvedilol can be used as a PET tracer for visualisation and quantification of the P-gp function in the BBB.
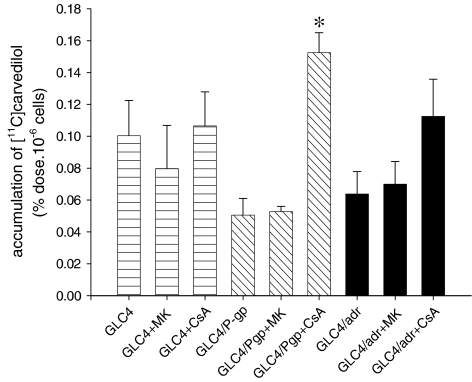
Cellular [11C]carvedilol accumulation in GLC4, GLC4/P-gp, and GLC4/Adr cells increased three-fold in the GLC4/P-gp cells after pretreatment with cyclosporin A (CsA) whereas no effect of MK571 could be determined in the GLC4/Adr cells.
Ex vivo [11C]carvedilol biodistribution studies showed that [11C]carvedilol uptake in the brain was increased by CsA. [11C]carvedilol uptake in other organs was not affected by CsA.
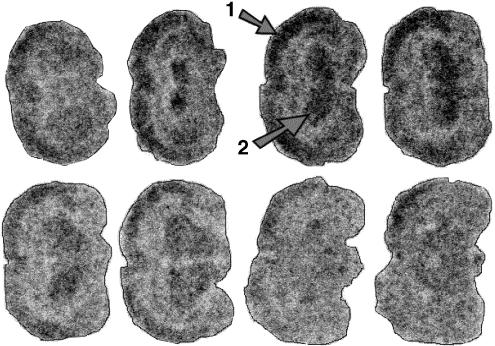
Autoradiography studies of rat brains showed that [11C]carvedilol was homogeneously distributed over the brain and that pretreatment with CsA increased [11C]carvedilol uptake.
In vivo PET experiments were performed with and without P-gp modulation by CsA. P-gp mediated transport was quantified by Logan analysis of the PET data, calculating the distribution volume (DV) of [11C]carvedilol in the brain. Logan analysis resulted in excellent fits, revealing that [11C]carvedilol is not trapped in the brain. Brain DV of [11C]carvedilol showed a dose-dependent increase of maximal three-fold after CsA pretreatment. Above 15 mg kg−1, no change in DV was found. Compared to [11C]verapamil less CsA was needed to reach maximal DV, suggesting that [11C]carvedilol kinetics is a more sensitive tool to in vivo measure P-gp function.
Keywords: [11C]carvedilol, multidrug resistance, P-glycoprotein, positron emission tomography, pharmacokinetic, modelling, radiopharmacology, blood–brain barrier, chemotherapy, cyclosporin A, distribution volume
Introduction
Imaging of P-glycoprotein (P-gp) function in the blood–brain barrier (BBB) may support development of strategies, which will improve delivery of drugs to the brain. The BBB protects the brain by maintaining a physical and functional barrier against harmful toxic environmental compounds. The BBB hampers entrance of multiple drugs targeted to the brain. P-gp is a part of the functional BBB, and functions as an active, ATP-dependent efflux pump, which extrudes such drugs from the brain to the blood. P-gp was initially described in chemotherapy resistant tumours and therefore considered as a prototype of drug-efflux pump involved in multidrug resistance (MDR) (Ling, 1997). Inhibition of P-gp function, for example, by administration of the P-gp inhibitor cyclosporin A (CsA) may lead to an increased delivery of drugs targeted to brain. Since P-gp plays an important role in the BBB, it was suggested that the P-gp substrate [11C]verapamil could be used to study P-gp function in the BBB in vivo. [11C]verapamil has been developed as a positron emission tomography (PET) tracer, suitable to image P-gp function in vivo (Hendrikse et al., 1998; 1999). PET studies in animals, using [11C]verapamil, indeed provided promising results. However, it is known that the octanol/water partition coefficient (log Po/w) of verapamil (log Po/w=3.8 (Hansch et al., 1995)) is not optimal for brain imaging.
A log Po/w=3.8 means that verapamil dilutes 103.8 better in octanol (fat) than in water. Ideally, for the purpose of brain imaging, tracers should have a log P between 0.9 and 2.5 (Dishino et al., 1983; Buchwald & Bodor, 1998). Recent literature revealed that the β-receptor antagonist carvedilol is a P-gp substrate, which modulates P-gp function in vitro approximately twice as effective as verapamil in an equimolar concentration (Jonsson et al., 1999). The log P of carvedilol is 2.0 (Doze et al., 2002). We hypothesised that carvedilol may therefore be more suitable to image P-gp function in the BBB than verapamil.
To study whether the P-gp substrate [11C]carvedilol can be used as a PET tracer for the visualisation and quantification of the P-gp functionality in the BBB, we performed cellular accumulation experiments, ex vivo autoradiography and biodistribution studies, and in vivo PET experiments.
Methods
Chemicals
Ketamine (Ketanest-S®, 25 mg ketamine-S ml−1) was obtained from Parke-Davis (Munich, Germany). Medetomidine (Domitor®, 1 mg medetomidine HCl ml−1) from Pfizer Animal Health B.V. (Capelle a/d IJssel, the Netherlands), CsA (50 mg ml−1) in cremophore EL (650 mg ml−1) (Sandimmune®) from Novartis (Basel, Switzerland), and MK 571 from Alexis Corp. (Lausen, Switzerland). Both methanol and isopentane were purchased from Merck Nederland B.V. (Amsterdam, the Netherlands). Sodium dihydrogen phosphate was obtained from the hospital's pharmacy (AZG, Groningen, the Netherlands) and adjusted to pH=7.6 with sodium hydroxide, obtained from Merck Nederland B.V. (Amsterdam, the Netherlands). RPMI 1640 medium and fetal calf serum (FCS) were purchased from Gibco (Paisley, U.K.).
Synthesis of [11C]carvedilol
[11C]carvedilol has been synthesised as described earlier (Doze et al., 2002), with some modifications. Desmethylcarvedilol reacts with [11C]methyltriflate, in the presence of K2CO3 (4 mg) with kryptofix (4 mg) in 400 μl dry acetone for 5 min at 85°C. The product was purified by HPLC (Platinum C18 column (300 × 7.8 mm2, Alltech, Deerfield, IL, U.S.A.) with a solvent system of 25 mM NaH2PO4 (pH 7.6) : MeOH (43 : 57), at a flow rate of 3 ml min−1 and is detected by UV at 254 nm. After evaporation of the solvent under reduced pressure, [11C]carvedilol was dissolved in 0.3 ml saline. The chemical yield and specific activities ranged from 20 to 33% end of bombardment (EOB) and 13–26 TBq mmol−1 (55 min EOB), respectively.
Cell lines and accumulation experiments
The parental human small-cell lung carcinoma cell line GLC4 and the sublines GLC4/P-gp and GLC4/ADR were cultured in RPMI 1640 medium/10% FCS in a humidified atmosphere with 5% CO2 at 37°C. The P-gp overexpressing cell line GLC4/P-gp was obtained after infection of GLC4 cells with an MDR1-gene-carrying retrovirus (Boesen et al., 1993). The MRP1 overexpressing cell line GLC4/ADR was obtained by culturing the parental cell line GLC4 in the presence of doxorubicin, resulting in spontaneous overexpressing of MRP1, but no P-gp (Versantvoort et al., 1995). Prior to the experiments, the P-gp and MRP1 overexpressing cell lines were drug-free cultured for 14 days. A total of 2 × 10⁶ GLC4, GLC4/P-gp and of GLC4/ADR cells were incubated 60 min at 37°C with [11C]carvedilol in 5 ml RPMI 1640/10% FCS. To study modulating effects, all cell lines were incubated with the P-gp substrate CsA (50 μM) or the MRP1 substrate MK 571 (50 μM). Of each cell line one sample served as negative control. Thereafter, the cells were washed with ice cold phosphate-buffered saline (PBS) (0.14 M NaCl, 2.7 M KCl, 6.4 mM Na2HPO4, 1.5 mM KH2PO4, pH 7.4), followed by centrifugation (5 min, 180 × g, 4°C). The supernatant was removed and the pellet was resuspended in 3 ml water and radioactivity was measured in a γ counter (LKB Wallac, Turku, Finland). Correction for extracellular adhesion of radioactivity was performed by subtracting the results obtained after incubation with [11C]carvedilol at 4°C. The cellular accumulation is expressed as percentage dose 10−6 cells (mean±s.e.m.).
Animals
All animal studies were performed in compliance with the Law of Animal Experimentation of the Netherlands and with local guidelines. Male Wistar rats (HsdCpb:Wu) weighing 300±20 g were used. The rats were anaesthetised by an intraperitoneal injection of a Ketanest-S® (25 mg kg−1)/Domitor® (0.2 mg kg−1)/NaCl (0.9 %) solution. [11C]carvedilol is injected in the tail vein. For modulation studies, rats were pretreated with intravenous CsA (5, 10, 25, 50 mg kg−1 body weight).
Autoradiography/phosphor storage imaging
[11C]carvedilol (100 MBq) was injected. At 15 min after injection of [11C]carvedilol, the animals were killed by extirpation of the heart, the brain was removed, snap frozen, and cut into slices of 80 μm thickness, by means of a microtome, model 840 (American Optical Corp., Buffalo, NY, U.S.A.) at −7°C. The bregma levels of the slices were: 6.20, 4.70, 4.20, 2.20, 1.70, 0.20, −0.30, −1.60, −2.56, −3.30, −4.30, −6.04 and −7.04 mm. The slices were placed on slides and dried at room temperature. Cyclone™ storage phosphor screens (Super Sensitive, Packard Instrument Company, Inc., Meriden, CT, U.S.A.) were exposed to the slices for at least 400 min (20 half-lives of [11C]) and subsequently analysed with Optiquant analysis software (version 03.00, Packard Instrument Company, Inc., Meriden, CT, U.S.A.).
With the aid of a calibration line, the photo-stimulated luminescence (PSL) of the exposed screen was converted to Bequerel (Bq). Regions of interest (ROIs) were drawn over the brain and the exposition in each area was quantified and corrected for the injected dose of [11C]carvedilol and the animal body weight (Murata et al., 1996; Sihver et al., 1997; Ishiwata et al., 1999).
Calibration lines
In each experiment, a solution of [11C]carvedilol was prepared at the concentration of 1 MBq ml−1 in saline. The solution was diluted to 714, 625, 500, 250, 125, 55.6, 26.3 and 17.2 kBq ml−1 and 10 μl of each dilution was loaded on a piece of filter-paper. In a γ counter, the radioactivity (counts per min (c.p.m.)) of the filter paper was measured for 15 s, corrected for decay and converted to Bq. The filter paper and the brain slices were placed at the phosphor storage screen and exposed for the same time. The PSL of the calibration-spots was measured and corrected for background PSL. The calibration lines were highly reproducible. The mean direction-coefficients of the individual calibration lines was 63 × 103 (s.d.=4.8 × 10³, n=10). The equation of the linear relationship between PSL and Bq from the combined calibration line was PSL=65.3 kBq (r2=0.99). The calibration lines showed a good linearity between the radiation intensity (Bq) and the PSL of the calibration samples in an order of 10 magnitudes.
Ex vivo biodistribution
At 60 min after intravenous injection of [11C]carvedilol (50 MBq), the animals were killed by extirpation of the heart. Several tissues were dissected and the radioactivity was measured using a calibrated gamma counter (Compu Gamma, LKB Wallac, Turku, Finland). Uptake values were expressed as differential absorption ratios (DAR).
The DAR is defined as:
Dynamic PET studies in rats
The rats were anaesthetised as described above. The carotid artery and the tail vein were canulated, and CsA was administered. The P-gp substrate kinetics was studied with an ECAT EXACT HR+ positron camera (Siemens/CTI, Knoxville, TN, U.S.A.). The long axes of the rats were positioned in the PET camera. Subsequently a transmission scan, a [15O]H2O scan for anatomical localisation and for perfusion measurements of the brain tissue (35 MBq), and a [11C]carvedilol scan (35–50 MBq) were carried out as described earlier for [11C]verapamil (Hendrikse et al., 1999). The brain time–activity curves were obtained by drawing a small elliptical ROI over the rat brain. This ROI was drawn with the aid of the [15O]H2O images, and copied to the [11C]carvedilol images. The plasma time–activity curves were obtained by arterial blood sampling from the carotid artery, during the [11C]carvedilol scan. Plasma and red blood cells were separated by centrifugation (3 min, 1000 × g). Radioactivity in plasma samples (50 μl) was measured with a γ-counter (LKB Wallac, Turku, Finland), which was cross calibrated with the PET camera.
Fitting the dynamic PET camera data
The dynamic PET modulation data were fitted by Logan–Patlak analysis (Logan et al., 1990). Logan analysis is a graphical method of analysis, applicable to ligands that bind reversibly to receptors or enzymes (Logan et al., 1990; Logan, 2000). This method can calculate the DV for dynamic PET data before steady state is actually reached. Logan analysis revealed to be useful to quantitate P-gp mediated efflux of [11C]carvedilol.
 |
in which ROI(t′) is the time–activity curve in a specific ROI (Bq); DV the distribution volume (see below); Vp the fractionated blood volume in ROI; Cp(t′) the time–activity curve in plasma (Bq); K1 the influx rate constant plasma to tissue transport (min−1); k4, in general k4 represents dissociation from a receptor, transporter or enzyme (Logan, 2000); C2 the ‘associated' bound concentration of [11C]carvedilol in tissue, and C1 the free concentration of [11C]carvedilol in tissue.
When Vp is small compared to DV, and when the second term becomes constant this equation transforms to a linear regression in which the slope is represented by DV. An estimate of K1 can be calculated by dividing DV by the absolute value of the y-intercept.
DV can approximately be described as follows:
 |
As starting point for the linear regression in the Logan analysis we used 5 min in all rats. This point was determined empirically, since after 5 min all analyses resulted in straight lines, which fitted the data very well. Since P-gp modulation decreases the efflux from tissue to blood, which results in an increase of the tissue concentration, it follows from the above definition that the DV will increase also (Bart et al., 2003).
Statistics
Statistics were performed by univariate analysis of variance in the cellular accumulation studies, the ex vivo autoradiograpic and biodistribution in vivo studies, and the in vivo PET studies. Dose–response curves were also fitted with a Hill, four parameter sigmoidal plot. Software packages used were SPSS for Windows, version 10.0, Sigmaplot® 2001 for Windows, version 7.0, and Microsoft Excel version 2000. P-values <0.05 were considered significant.
Results
In vitro cell experiments
The in vitro cell experiments results are shown in Figure 1. In the parental cell line GLC4, [11C]carvedilol accumulation was not affected by MK571 or CsA. In GLC4/P-gp CsA treatment resulted in 3.0-fold increase of [11C]carvedilol accumulation (P=0.0001), while no effect of MK 571 was found. In GLC4/ADR CsA treatment induced a nonsignificant 1.8-fold increase of [11C]carvedilol accumulation and also no effect of MK 571 was found. These results demonstrate that [11C]carvedilol is a specific P-gp substrate and no MRP1 substrate.
Figure 1.
The mean (±s.e.m.) accumulation of [11C]carvedilol in control cells (GLC4), MRP containing cells (GLC4/ADR150x) and P-gp containing cells (GLC4/P-gp) in the presence and absence of an MRP1 (MK571) and a P-gp (CsA) modulator (n=3 in duplicate). Significance is depicted by *.
Ex vivo autoradiography studies
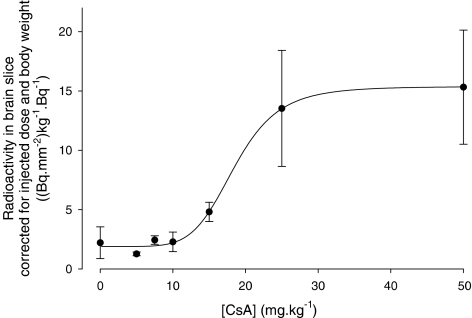
Figure 2 illustrates a representative image of the accumulation of radioactivity in the brain of Wistar rats in the presence of 25 mg kg−1 CsA. Although this figure indicates a regional distribution of the radioactivity over different parts of the brain, no significant differences could be proved. Figure 3 shows the quantified autoradiography data. The data illustrate a sigmoidal relation between the [11C]carvedilol uptake in brain and CsA dose (r2=0.66). A 7 (±3)-fold increase in [11C]carvedilol accumulation was found after 30 mg kg−1 CsA. Uptake of [11C]carvedilol in brain slices remains unaffected by CsA between 30 and 50 mg kg−1 CsA.
Figure 2.
Representative rat brain slices after injection of 50 MBq [11C]carvedilol in the presence of CsA (25 mg kg−1). The cortex and the striatum are indicated by (1) and (2) respectively. Although the distribution of [11C]carvedilol is not homogeneous, no specific binding to brain regions (e.g. β receptor expressing regions) has been found. Templates: bregma level.
Figure 3.
 |
Ex vivo biodistribution
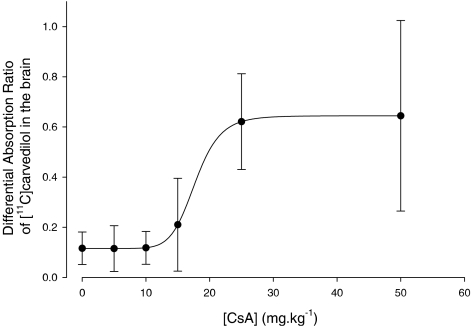
The ex vivo biodistribution results along with the 0–50 mg kg−1 CsA dosages are shown in Table 1. Only the brain uptake of [11C]carvedilol increases after treatment with CsA (P=0.003). The brain DAR-values illustrate a sigmoidal relation between the amount of CsA and the tissue level radioactivity, as shown in Figure 4. A 5 (±2)-fold increase was found after 30 mg kg−1 CsA (r2=0.63). The DAR-value remains unaffected by CsA between 30 and 50 mg kg−1 CsA. These results are consistent with the results of the autoradiography studies.
Table 1.
Biodistribution studies of [11C]carvedilol in male Wistar rats 60 min post injection, expressed as DAR
| CsA dosage (mg kg−1) | ||||||
|---|---|---|---|---|---|---|
| Organ | 0 (n=5) | 5 (n=5) | 10 (n=3) | 15 (n=5) | 25 (n=3) | 50 (n=3) |
| Brain* | 0.12 (0.06) | 0.12 (0.09) | 0.12 (0.07) | 0.21 (0.19) | 0.62 (0.19) | 0.64 (0.38) |
| Heart | 0.66 (0.13) | 0.52 (0.19) | 0.43 (0.16) | 0.60 (0.33) | 0.77 (0.22) | 0.67 (0.45) |
| Lung | 6.08 (2.58) | 3.81 (1.47) | 3.14 (1.91) | 3.34 (1.69) | 6.48 (1.81) | 5.00 (3.83) |
| Liver | 3.02 (1.58) | 3.10 (2.34) | 2.30 (1.39) | 2.59 (1.73) | 3.19 (1.49) | 2.45 (1.87) |
| Kidney | 1.33 (0.49) | 1.01 (0.34) | 0.81 (0.43) | 1.02 (0.61) | 2.34 (1.47) | 1.92 (1.52) |
| Testis | 0.28 (0.23) | 0.30 (0.20) | 0.24 (0.12) | 0.18 (0.13) | 0.30 (0.10) | 0.37 (0.25) |
| Plasma | 0.41 (0.31) | 0.43 (0.30) | 0.40 (0.36) | 0.39 (0.33) | 0.74 (0.48) | 0.53 (0.19) |
*P=0.003.
Figure 4.
 |
In vivo PET camera studies
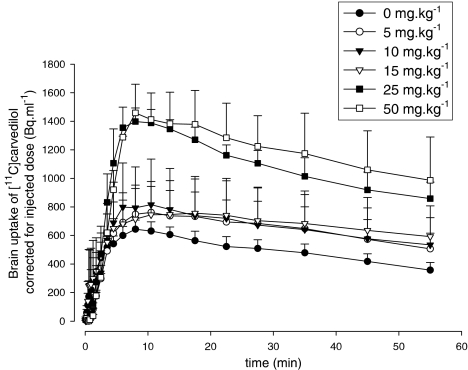
Brain kinetics of [11C]carvedilol is shown without CsA (n=6), and after 5 (n=5), 10 (n=3), 15 (n=6), 25 (n=3), and 50 mg kg−1 CsA (n=4) (Figure 5). Rats treated with CsA demonstrated a maximum radioactivity level in the brain about 10 min after [11C]carvedilol injection. [15O]H2O PET revealed that brain perfusion was equal within errors in all rats and unrelated to carvedilol kinetics (data not shown).
Figure 5.
Time–activity curves of [11C]carvedilol in the brain with several dosages cyclosporin A, measured by PET. Each point represents mean±s.e.m.
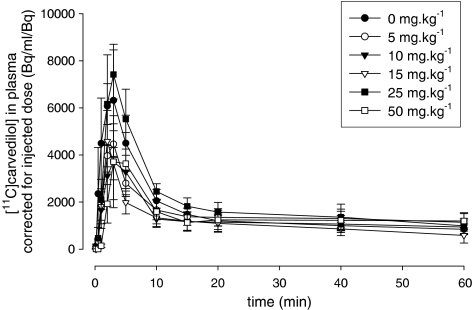
Plasma kinetics of [11C]carvedilol showed no significant differences between groups of rats irrespective of the CsA dose (Figure 6). The biological plasma clearance curve of [11C]carvedilol is biphasic, which is in accordance with [11C]verapamil kinetics (Hendrikse et al., 1999). A fast distribution phase (t1/2=2.33 min) is followed by a much slower washout phase (t1/2=107.8 min) in all rats.
Figure 6.
Plasma clearance of [11C]carvedilol in the presence of several dosages cyclosporin A. Each point represents the mean±s.e.m.
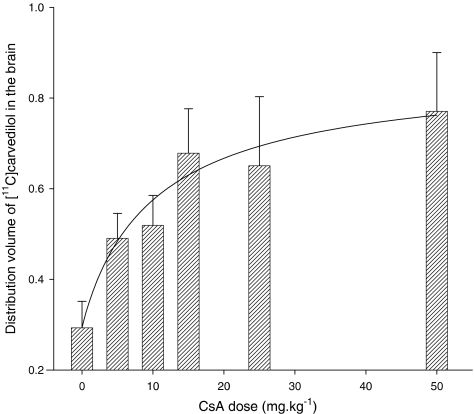
Logan analysis demonstrated excellent fits of plasma versus tissue time–activity curves in all rats, suggesting that [11C]carvedilol is not trapped in brain tissue. From a theoretical point of view, P-gp mediated transport is probably saturable, since the physical amount of P-gp pumps on a certain cell surface is limited. For that reason we fitted the dose–response curve of DV versus CsA dosage with a sigmoidal shaped four-parameter Hill plot (R2=0.49). The calculated DV of [11C]carvedilol in the brain without CsA and after 5, 10, 15, 25, and 50 mg kg−1 CsA and the fitted curve are shown in Figure 7. The maximal increase of the DV was three-fold after 15 mg kg−1 of CsA. No further increase in DV was found with higher dosages of CsA. The rats that received 50 mg kg−1 CsA showed a large variability of the time–activity curves and DV, which may be due to very unphysiologic conditions induced by CsA.
Figure 7.
 |
Discussion
The present study demontrates clearly that [11C]carvedilol is a P-gp substrate, and that the brain kinetics of [11C]carvedilol can be modulated by CsA.
Since carvedilol has a favorable log Po/w value for brain imaging (log Po/w of carvedilol=2.0) (Doze et al., 2002) compared to verapamil log Po/w=3.8 (Hansch et al., 1995) it is interesting whether [11C]carvedilol is really a better tracer for brain imaging with PET than [11C]verapamil.
The accumulation experiments in cell lines show that [11C]carvedilol accumulation can be increased 3.0-fold by CsA in GLC4/P-gp. Previously it has been demonstrated that [11C]verapamil accumulation can be increased 2.0-fold by an equal dosage of CsA in the same cell line (Hendrikse et al., 1999). Thus, the response of [11C]carvedilol accumulation to CsA modulation is greater than that of [11C]verapamil, allowing more specific discrimination between baseline and modulated condition.
The in vivo PET experiments show a clear relationship between the amount of CsA administered and the DV of [11C]carvedilol in the brain, with a three-fold increase after treatment. The maximal increase happens between 0 and 15 mg kg−1 CsA and is unaffected above 15 mg kg−1 CsA. This is less than the maximal 5.8-fold increase in DV, which we found in the case of [11C]verapamil, but maximal increase in DV of [11C]verapamil occurred at 25 mg kg−1 CsA and above (Bart et al., 2003). So, although the increase in DV of [11C]carvedilol is less than that of [11C]verapamil, it occurs at lower dosages of CsA, which suggests that [11C]carvedilol is more sensitive to reveal in vivo P-gp modulation than [11C]verapamil.
In the rat and human liver, [11C]carvedilol is intensively metabolised to several more hydrophilic compounds (Neugebauer & Neubert, 1991; Schaefer et al., 1998). Since the PET-camera is unable to discriminate between radioactive parental compound and radioactive metabolites, it cannot be ruled out that the latter with a possible other P-gp affinity (Neuhoff et al., 2000) are involved in the visualisation and quantification of the P-gp functionality. Metabolisation of carvedilol consists mainly of glucuronidation and sulfatation in the liver, where the metabolites are secreted into the enterohepatic cycle. It was demonstrated in male rats that 76.4% of i.v. injected of [11C]carvedilol was eliminated in bile within 0–6 h. In plasma, it was shown that 3 h after carvedilol injection that 61.6% of measurable radioactivity consisted of identifiable carvedilol (36.8%), glucuronidated metabolites (24.0%) and a lipofilic metabolite (0.8%) (Schaefer et al., 1998). These glucuronidated, hydrophylic metabolites hardly enter the brain (Neugebauer & Neubert, 1991). Therefore, the input curve of the Logan analysis may be overestimated a little bit, resulting in a little underestimation of the brain DV of [11C]carvedilol at the end of the experiment (see equation 2). Compared to [11C]verapamil, the results of the in vivo experiments with [11C]carvedilol are more consistent with the results of ex vivo and in vitro experiments (Hendrikse et al., 1999). The current results are a promising starting point for the execution of human PET studies with the new P-gp tracer [11C]carvedilol.
Theoretically, inhibition of P-gp mediated efflux, for example, by CsA, should result in better delivery of P-gp substrates to P-gp expressing tumours. Although some investigators reported better treatment results with P-gp inhibitors than without P-gp inhibitors (Advani et al., 1999; List et al., 2001), most investigators are, based on randomised studies, sceptical about a clinical break-through of P-gp inhibition in leukemias and solid tumours. However, using the P-gp substrate 99mTc-Sestamibi, as an imaging agent, increased uptake has been observed in normal liver and kidney after inhibition of P-gp function with PSC 833, VX710, and XR9576 (Chen et al., 1997; Luker et al., 1997; Peck et al., 2001). These studies confirm that the concentrations of modulator achieved in patients are able to increase uptake of a Pgp substrate. XR9576 has also been shown to increase 99mTc-Sestamibi uptake in drug resistant tumours (Agrawal et al., 2003).
PET experiments in mice and rats have clearly shown that inhibition of P-gp function in the BBB results in an increased uptake of the P-gp substrate [11C]verapamil, up to the level of P-gp knock-out (mdr1a−/−) mice (Hendrikse et al., 1998). Since the functionality of P-gp in the BBB is only poorly understood, imaging and quantification of P-gp function in the BBB, is necessary to translate the concept of P-gp inhibition from rodents to patients. If this concept will work, patients eligible for cotreatment with anticancer or other CNS active drugs and a P-gp modulator could be selected, and potentially could the amount of modulator, required for adequate modulation, individually be determined.
Conclusion
This study shows that PET with [11C]carvedilol is more sensitive to measure P-gp modulation than with [11C]verapamil at lower dosages of CsA. Therefore, this study is a promising starting point for human PET studies with [11C]carvedilol.
Acknowledgments
This work was supported by Grant RUG 99-1882 of the Dutch Cancer Society.
Abbreviations
- BBB
blood–brain barrier
- CsA
cyclosporin A
- DAR
differential absorption ratio
- DV
distribution volume
- EOB
end of bombardment
- MDR
multidrug resistance
- P-gp
P-glycoprotein
- PET
positron emission tomography
- PSL
photo-stimulated luminescense
- ROI
region of interest
References
- ADVANI R., SABA H.I., TALLMAN M.S., ROWE J.M., WIERNIK P.H., RAMEK J., DUGAN K., LUM B.L., VILLENA J., DAVIS E., PAIETTA E., LITCHMAN M., SIKIC B.I., GREENBERG P.L. Treatment of refractory and relapsed acute myelogenous leukemia with combination chemotherapy plus the multidrug resistance modulator PSC 833 (Valspodar) Blood. 1999;93:787–795. [PubMed] [Google Scholar]
- AGRAWAL M., ABRAHAM J., BALIS F.M., EDGERLY M., STEIN W.D., BATES S., FOJO T., CHEN C.C. Increased (99m)Tc-Sestamibi accumulation in normal liver and drug-resistant tumors after the administration of the glycoprotein inhibitor, XR9576. Clin. Cancer Res. 2003;9:650–656. [PubMed] [Google Scholar]
- BART J., WILLEMSEN A.T.M., GROEN H.J.M., VAN DER GRAAF W.T.A., WEGMAN T.D., VAALBURG W., DE VRIES E.G.E., HENDRIKSE N.H. Quantitative assessment of P-glycoprotein function in the rat blood–brain barrier by distribution volume of [11C]verapamil measured with PET. Neuroimage. 2003;20:1775–1782. doi: 10.1016/s1053-8119(03)00405-1. [DOI] [PubMed] [Google Scholar]
- BOESEN J.J.B., NOOTER K., VALERIO D. Circumvention of chemotherapy-induced myelosuppression by transfer of the mdr1 gene. Biotherapy. 1993;6:291–302. doi: 10.1007/BF01878359. [DOI] [PubMed] [Google Scholar]
- BUCHWALD P., BODOR N. Octanol-water partition: searching for predictive models. Curr. Med. Chem. 1998;5:353–380. [PubMed] [Google Scholar]
- CHEN C.C., MEADOWS B., REGIS J., KALAFSKY G., FOJO T., CARRASQUILLO J.A., BATES S.E. Detection of in vivo P-glycoprotein inhibition by PSC 833 using [99mTc]sestamibi. Clin. Cancer Res. 1997;3:545–552. [PubMed] [Google Scholar]
- DISHINO D.D., WELCH M.J., KILBOURN M.R., RAICHLE M.E. Relationship between lipophilicity and brain extraction of 11C-labeled radiopharmaceuticals. J. Nucl. Med. 1983;24:1030–1038. [PubMed] [Google Scholar]
- DOZE P., ELSINGA P.H., MAAS B., VAN WAARDE A., WEGMAN T.D., VAALBURG W. Synthesis and evaluation of radiolabeled antagonists for imaging of beta-adrenoceptors in the brain with PET. Neurochem. Int. 2002;40:145–155. doi: 10.1016/s0197-0186(01)00081-x. [DOI] [PubMed] [Google Scholar]
- HANSCH C., LEO A., HOEKMAN D. Exploring QSAR: Hydrophobic, Electronic, and Steric Constants. Washington, DC: American Chemistry Society; 1995. [Google Scholar]
- HENDRIKSE N.H., DE VRIES E.G.E., ERIKS-FLUKS L., VAN DER GRAAF W.T.A., HOSPERS G.A., WILLEMSEN A.T.M., VAALBURG W., FRANSSEN E.J.F. A new in vivo method to study P-glycoprotein transport in tumors and the blood–brain barrier. Cancer Res. 1999;59:2411–2416. [PubMed] [Google Scholar]
- HENDRIKSE N.H., SCHINKEL A.H., DE VRIES E.G.E., FLUKS E., VAN DER GRAAF W.T.A., WILLEMSEN A.T.M., VAALBURG W., FRANSSEN E.J.F. Complete in vivo reversal of P-glycoprotein pump function in the blood–brain barrier visualised with positron emission tomography. Br. J. Pharmacol. 1998;124:1413–1418. doi: 10.1038/sj.bjp.0701979. [DOI] [PMC free article] [PubMed] [Google Scholar]
- ISHIWATA K., OGI N., TANAKA A., SENDA M. Quantitative ex vivo and in vitro receptor autoradiography using 11C-labeled ligands and an imaging plate: a study with a dopamine D2-like receptor ligand [11C]nemonapride. Nucl. Med. Biol. 1999;26:291–296. doi: 10.1016/s0969-8051(98)00115-2. [DOI] [PubMed] [Google Scholar]
- JONSSON O., BEHNAM-MOTLAGH P., PERSSON M., HENRIKSSON R., GRANKVIST K. Increase in doxorubicin cytotoxicity by carvedilol inhibition of P-glycoprotein activity. Biochem. Pharmacol. 1999;58:1801–1806. doi: 10.1016/s0006-2952(99)00262-2. [DOI] [PubMed] [Google Scholar]
- LING V. Multidrug resistance: molecular mechanisms and clinical relevance. Cancer Chemother. Pharmacol. 1997;40 Suppl:S3–S8. doi: 10.1007/s002800051053. [DOI] [PubMed] [Google Scholar]
- LIST A.F., KOPECKY K.J., WILLMAN C.L., HEAD D.R., PERSONS D.L., SLOVAK M.L., DORR R., KARANES C., HYNES H.E., DOROSHOW J.H., SHURAFA M., APPELBAUM F.R. Benefit of cyclosporine modulation of drug resistance in patients with poor-risk acute myeloid leukemia: a Southwest Oncology Group study. Blood. 2001;98:3212–3220. doi: 10.1182/blood.v98.12.3212. [DOI] [PubMed] [Google Scholar]
- LOGAN J. Graphical analysis of PET data applied to reversible and irreversible tracers. Nucl. Med. Biol. 2000;27:661–670. doi: 10.1016/s0969-8051(00)00137-2. [DOI] [PubMed] [Google Scholar]
- LOGAN J., FOWLER J.S., VOLKOW N.D., WOLF A.P., DEWEY S.L., SCHLYER D.J., MACGREGOR R.R., HITZEMANN R., BENDRIEM B., GATLEY S.J. Graphical analysis of reversible radioligand binding from time–activity measurements applied to [N-11C-methyl]-(−)-cocaine PET studies in human subjects. J. Cereb. Blood Flow Metab. 1990;10:740–747. doi: 10.1038/jcbfm.1990.127. [DOI] [PubMed] [Google Scholar]
- LUKER G.D., FRACASSO P.M., DOBKIN J., PIWNICA-WORMS D. Modulation of the multidrug resistance P-glycoprotein: detection with [99mTc]sestamibi in vivo. J. Nucl. Med. 1997;38:369–372. [PubMed] [Google Scholar]
- MURATA T., MATSUMURA K., ONOE H., BERGSTROM M., TAKECHI H., SIHVER S., SIHVER W., NEU H., ANDERSSON Y., OGREN M., FASTH K.J., LANGSTROM B., WATANABE Y. Receptor imaging technique with 11C-labeled receptor ligands in living brain slices: its application to time-resolved imaging and saturation analysis of benzodiazepine receptor using [11C]Ro15-1788. Neurosci. Res. 1996;25:145–154. doi: 10.1016/0168-0102(96)01037-1. [DOI] [PubMed] [Google Scholar]
- NEUGEBAUER G., NEUBERT P. Metabolism of carvedilol in man. Eur. J. Drug Metab. Pharmacokinet. 1991;16:257–260. doi: 10.1007/BF03189969. [DOI] [PubMed] [Google Scholar]
- NEUHOFF S., LANGGUTH P., DRESSLER C., ANDERSSON T.B., REGARDH C.G., SPAHN-LANGGUTH H. Affinities at the verapamil binding site of MDR1-encoded P-glycoprotein: drugs and analogs, stereoisomers and metabolites. Int. J. Clin. Pharmacol. Ther. 2000;38:168–179. doi: 10.5414/cpp38168. [DOI] [PubMed] [Google Scholar]
- PECK R.A., HEWETT J., HARDING M.W., WANG Y.M., CHATURVEDI P.R., BHATNAGAR A., ZIESSMAN H., ATKINS F., HAWKINS M.J. Phase I and pharmacokinetic study of the novel MDR1 and MRP1 inhibitor biricodar administered alone and in combination with doxorubicin. J. Clin. Oncol. 2001;19:3130–3141. doi: 10.1200/JCO.2001.19.12.3130. [DOI] [PubMed] [Google Scholar]
- SCHAEFER W.H., POLITOWSKI J., HWANG B., DIXON F., JR., GOALWIN A., GUTZAIT L., ANDERSON K., DEBROSSE C., BEAN M., RHODES G.R. Metabolism of carvedilol in dogs, rats, and mice. Drug Metab. Dispos. 1998;26:958–969. [PubMed] [Google Scholar]
- SIHVER W., SIHVER S., BERGSTROM M., MURATA T., MATSUMURA K., ONOE H., ANDERSSON Y., BJURLING P., FASTH K.J., WESTERBERG G., OGREN M., JACOBSSON G., LUNDQVIST H., ORELAND L., WATANABE Y., LANGSTROM B. Methodological aspects for in vitro characterization of receptor binding using 11C-labeled receptor ligands: a detailed study with the benzodiazepine receptor antagonist [11C]Ro 15-1788. Nucl. Med. Biol. 1997;24:723–731. doi: 10.1016/s0969-8051(97)00113-3. [DOI] [PubMed] [Google Scholar]
- VERSANTVOORT C.H., WITHOFF S., BROXTERMAN H.J., KUIPER C.M., SCHEPER R.J., MULDER N.H., DE VRIES E.G.E. Resistance-associated factors in human small-cell lung-carcinoma GLC4 sub-lines with increasing adriamycin resistance. Int. J. Cancer. 1995;61:375–380. doi: 10.1002/ijc.2910610317. [DOI] [PubMed] [Google Scholar]


