Abstract
Mushroom bodies (MBs) are the centers for olfactory associative learning and elementary cognitive functions in the Drosophila brain. By high-resolution neuroanatomy, we show that eyeless (ey), twin of eyeless, and dachshund (dac), which are implicated in eye development, also are expressed in the developing MBs. Mutations of ey completely disrupted the MB neuropils, and a null mutation of dac resulted in marked disruption and aberrant axonal projections. Genetic analyses demonstrated that, whereas ey and dac synergistically control the structural development of the MBs, the two genes are regulated independently in the course of MB development. These data argue for a distinct combinatorial code of regulatory genes for MBs as compared with eye development and suggest conserved roles of Pax6 homologs in the genetic programs of the olfactory learning centers of complex brains.
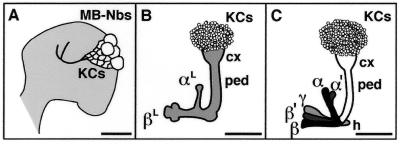
Mushroom bodies (MBs) are a pair of prominent neuropil structures in the insect brain that are implicated as centers for higher-order behaviors including olfactory associative learning and elementary cognitive functions (1). Anatomically, each MB comprises a large number of densely packed parallel fibers organized into distinct neuronal structures in the brain (2, 3). The MB cell bodies, Kenyon cells, are located at the dorsal cortex, extending their dendrites into the calyx and their axonal projections through the peduncles, which split dorsally into two lobes, α and α′, and medially into three lobes, β, β′, and γ (Fig. 1C). The calyces of MBs receive olfactory information from the antennal lobes via the prominent antennoglomerular tracts. The peduncles and lobes send neural commands through their connections to the major brain regions including the lateral protocerebrum. These anatomical structures are consistent with the putative MB function: that MBs integrate various sensory information to compute behavioral outputs.
Figure 1.
Development of the MBs. (A) Embryonic MB primordium. Lateral image of an embryonic brain hemisphere at stage 17 showing the four MB neuroblasts (MB-NBs) that are located at the anterior end (in neuraxis) of the brain and give rise to the embryonic Kenyon cells (KCs). Axonal tracts of the peduncle and two orthogonal lobes are pioneered by this stage. (Bar = 10 μm.) (B) Larval MB. The larval MB structure is basically an extension of the embryonic one with increasing numbers of Kenyon cells (KCs) and their axons. The peduncle (ped) split into the dorsal (αL) and medial (βL) lobes. cx, calyx. Third instar. (Bar = 50 μm.) (C) Late pupal and adult MBs. After massive reorganization during the first half of the pupal stage, two dorsal (α and α′) and three medial lobes (β, β′, and γ) are formed. Together with the heel (h), these adult-type structures can be classified into three axonal projection groups (α/β, α′/β′, and γ/heel), which are indicated with different shadings. (Bar = 60 μm.)
In the course of development, Kenyon cells are produced by four neuroblasts, which are active from the embryonic stage (4). The MB primordia can be identified with a specific marker at the most anterior (in neuraxis) region of the embryonic brain shortly after the protocerebrum anlagen are formed (Fig. 1A; ref. 5). By late embryonic stages, the major neural tracts of the MBs are established with a peduncle projection that splits into the medial and dorsal axonal tracts. This relatively simple architecture of the early MBs is kept during the larval instars with increasing number of Kenyon cells and their axonal projections (Fig. 1B). At the beginning of the pupal stage, MBs undergo massive degeneration and reorganization to form the complex adult architecture with five lobes and a heel (Fig. 1C), which can be classified into three axonal-projecting groups (3, 6).
The Drosophila Pax6 genes, eyeless (ey; refs. 7 and 8) and twin of eyeless (toy; ref. 9), have important functions in eye development as master control genes. Whereas regulatory functions of Pax6 homologs in eye development are evolutionarily conserved (10, 11), studies in vertebrates have shown that Pax6 genes play important roles in brain development (10, 12–14). The mouse Pax6 gene is expressed in the telencephalon anlage, and mutations of Pax6 result in profound defects in many of the forebrain structures including the olfactory cortex. In Drosophila, both ey and toy are expressed in the embryonic brain (7, 9), as are the vertebrate homologs, but the neuroanatomical identities of the expressing cells and the functions of the two genes in brain development were unknown. In this paper, we show that ey, toy, and dachshund (dac; refs. 15 and 16), another regulatory gene in eye development, are coexpressed in the developing MBs and that ey and dac have pivotal functions in the structural development of the MBs.
Materials and Methods
Fly Stocks.
The ey null mutants were eyJ5.71 and eyC7.20 (S.F. and W.J.G., unpublished data). The dac null mutant was dac4 (15). The wild-type strain was Oregon-R.
Immunocytochemistry and in Situ Hybridization.
Anatomical examinations of embryonic brains were done as described (17). Primary antibodies were rabbit FITC-conjugated anti-horseradish peroxidase diluted 1:300 (Jackson ImmunoResearch); rabbit anti-EY (U.W., unpublished data) diluted 1:300; mouse anti-DAC (mABdac2–3; ref. 15) diluted 1:250; mouse anti-EYA (mAB10H6; ref. 18) diluted 1:250; mouse anti-Fasciclin II (FAS II, 1D4; ref. 19) diluted 1:5; and rabbit anti-DIF (20) diluted 1:250. FITC-, Cy3-, or Cy5-conjugated secondary antibodies (Jackson ImmunoResearch) were used at a dilution of 1:400. Fluorescent in situ hybridization was done as described (21). Confocal images were captured by using Zeiss LSM410. Optical sections were made at 2 μm for embryonic brains and 4 μm for larval and pupal brains. Images were processed digitally and then arranged by using Adobe photoshop.
Results and Discussion
Gene Expression in Embryonic MB Primordia.
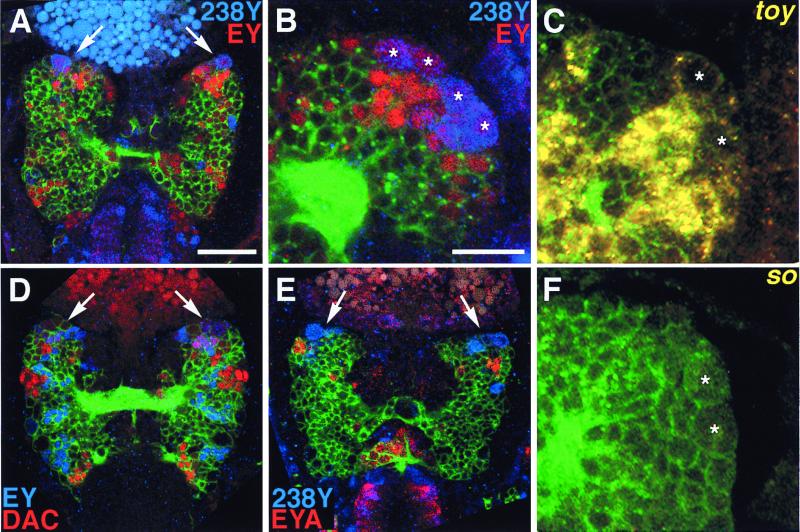
A Gal4 MB marker, 238Y, identifies the MB primordia in the embryonic brain (5). Neuroanatomical examination of the developing brains double-stained for 238Y and the EY protein revealed that EY is expressed in the embryonic MB primordia (Fig. 2A). High-resolution imaging shows that EY is expressed in the MB neuroblasts, ganglion mother cells, and their progenies, suggesting pivotal functions of EY in various stages of cell differentiation in MB development (Fig. 2B and Table 1). In addition to ey, studies on Drosophila eye development have revealed a cascade of regulatory genes that function synergistically in the early specification of eye primordia (9, 22–25). Among such regulatory genes involved in eye development, we found that toy also is expressed in the embryonic MBs (Fig. 2C). Moreover, dac, another gene involved in eye development, also is expressed in the embryonic MBs (Fig. 2D; see also Fig. 5A for higher magnification). However, the expression of the DAC protein is rather confined to ganglion mother cells and embryonic Kenyon cells (Table 1). On the other hand, in contrast to the eye development cascade, neither sine oculis (so; refs. 26 and 27) nor eyes absent (eya; refs. 18 and 28) is expressed in the embryonic MBs (Fig. 2 E and F), though EYA was detected in nearby cell clusters in the anterior region of the embryonic brain.
Figure 2.
Expression of nuclear regulatory genes in the embryonic MB primordia. Laser confocal microscopy of embryonic brains at stage 16 (A) and stage 15 (B–F). The brain was visualized with neuron-specific anti-horseradish peroxidase antibody (green). (A and B) Expression of an embryonic MB marker, 238Y (blue), and EY (red) in the embryonic brain. Dorsal view of whole brain (A) and lateral view of the MB primordium (B) at higher magnification. Note coexpression (pink/violet) of EY and 238Y. 238Y expression is particularly strong in two of the MB neuroblasts and their progenies. Arrows, MB primordia. Stars, MB neuroblasts. [Bar = 10 μm (A) and 25 μm (B).] (C) Expression of toy transcripts (yellow) in the embryonic MB; fluorescent in situ hybridization. Lateral view of the MB primordium at higher magnification. Stars, MB neuroblasts. (D) Expression of EY (blue) and DAC (red) in the embryonic brain. Note the coexpression (pink/violet) of EY and DAC in the MB primordia (arrows). (E) Expression of EYA (red) and 238Y (blue) in the embryonic brain. EYA is expressed in nearby cells but not in the MB primordia (arrows). (F) Expression of so transcripts (yellow) in the embryonic MB; fluorescent in situ hybridization. Lateral view of the MB primordium at higher magnification. Stars, MB neuroblasts.
Table 1.
Expression of Pax6 and other regulatory genes in the embryonic MBs
| ey | toy | dac | eya | so | 238Y | |
|---|---|---|---|---|---|---|
| NBs | ++ | + | ± | − | − | ++ |
| GMCs | ++ | ++ | ++ | − | − | ++ |
| KCs | ++ | ++ | ++ | − | − | ++ |
NBs, neuroblasts; GMCs, ganglion mother cells; KCs, Kenyon cells.
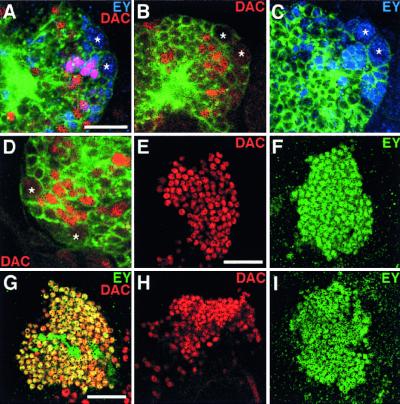
Figure 5.
Expression of EY and DAC in mutant backgrounds. (A–D) Expression of EY (blue) and DAC (red) in embryonic MBs. Lateral (A–C) and dorsal (D) views. Brain is visualized with neuron-specific anti-horseradish peroxidase antibody (green). Stars, MB neuroblasts. (A) Wild-type brain at stage 14. Note clear coexpression (pink) of EY and DAC in embryonic Kenyon cells. (B) DAC (red) expression in ey mutant; stage 15. (C) EY (blue) expression in dac mutant; stage 15. (D) DAC (red) expression in nullo 4 embryo; dorsal view. (E and F) Expression of DAC and EY in larval Kenyon cells; third instar. (E) DAC expression in ey mutant. (F) EY expression in dac mutant. (G–I) Expression of DAC (red) and EY (green) in pupal Kenyon cells 50 hr after puparium formation. (G) Wild type. DAC is coexpressed with EY in most Kenyon cells except for the central cells. (H) DAC (red) expression in ey mutant. (I) EY (green) expression in dac mutant. [Bars = 10 μm (A) and 25 μm (E and G).]
Gene Expression in Larval MBs.
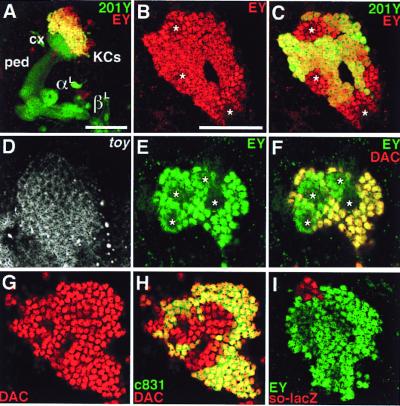
The characteristic expression of ey, toy, and dac in the developing MBs is maintained in the larval brain. EY is expressed in all of the larval MB cells at a significant level whereas expression of a Gal4 MB marker, 201Y (2), is absent in the central cells (Fig. 3 A–C and E). Expression of toy is also evident in the Kenyon cells (Fig. 3D). As with ey, toy is expressed in all of the MB cells (Table 2). On the other hand, DAC is not expressed in the central cells, including neuroblasts and ganglion mother cells, whereas it is clearly detected in distantly located cells (Fig. 3F). Double staining for DAC and Gal4 MB markers (2), 201Y, c831 and 238Y, demonstrated that the Gal4 MB markers are expressed in outer cells, which are located several cells diameters away from the central cells (Fig. 3H). Neither so nor eya is expressed in the larval MBs though they are expressed in nearby cells (Fig. 3I and data not shown).
Figure 3.
Expression of nuclear regulatory genes in the larval MBs; laser confocal microscopy of third instar larval brains. Reconstruction from optical sections (A) and single optical sections (B–I). (A) Larval MB labeled for a Gal4 MB marker (201Y, green) and EY (red). Lateral view shows the Kenyon cells (KCs), calyx (cx), peduncle (ped), and the larval lobes (αL and βL). Note prominent coexpression (yellow) of EY and 201Y in Kenyon cells located above the calyx. (Bar = 50 μm.) (B and C) Expression of EY (red/yellow) and 201Y (green/yellow) in larval Kenyon cells; dorsal views. (B) EY expression. (C) Same as B but shows both EY and 201Y. Star, MB neuroblasts. (Bar = 40 μm.) (D) Expression of toy in Kenyon cells; fluorescent in situ hybridization; dorsal view. Identical pattern was confirmed with anti-TOY antibody (U.W., unpublished data). (E and F) Differential expression of EY (green/yellow) and DAC (red/yellow) in the larval Kenyon cells around the four MB neuroblasts (stars). (E) EY expression. (F) Same as E but shows both EY and DAC. (G and H) Differential expression of DAC (red/yellow) and Gal4 MB marker c831 (green/yellow) in larval Kenyon cells. (G) DAC expression. (H) Same as G but shows both DAC and c831. (I) Expression of EY (green) and so-lacZ (red) in larval brain. Similar result was obtained by in situ hybridization for so transcripts.
Table 2.
Expression of Pax6 and other regulatory genes in the larval MBs
| ey | toy | dac | eya | so | MB-Gal4 | |
|---|---|---|---|---|---|---|
| NBs | + | + | − | − | − | − |
| GMCs | ++ | ++ | ± | − | − | − |
| Inner KCs | ++ | ++ | ++ | − | − | − |
| Outer KCs | ++ | ++ | ++ | − | − | ++ |
NBs, neuroblasts; GMCs, ganglion mother cells; KCs, Kenyon cells. MB-Gal4 includes 201Y, c831, and 238Y, which show identical patterns in larval Kenyon cells.
The differential expression of ey, toy, and dac initially observed in the embryonic MBs thus is pronounced in the larval brain as the neuropil structures of the MBs are developed. The expression patterns of these genes in the Kenyon cells also are maintained in the pupal stage (see Fig. 5G).
Structural Defects in ey and dac Mutants.
The distinctive expression profiles of ey, toy, and dac in the embryonic and larval MBs suggest combinatorial regulatory mechanisms in the initial formation and structural development of the MBs. To examine functional significance of these genes in the MBs, we examined the neural structures of the developing MBs in mutant backgrounds of either ey or dac.
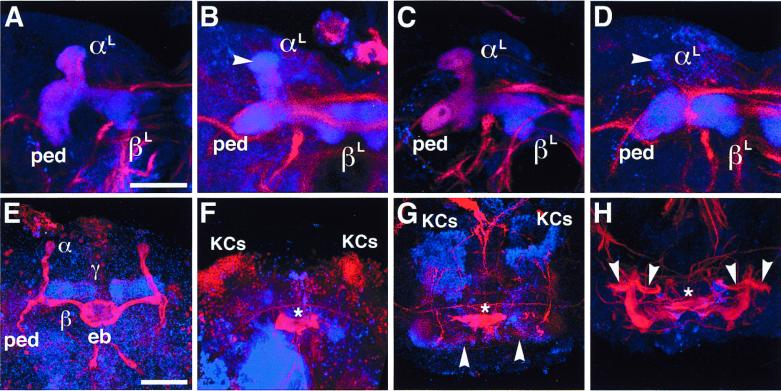
As described in Fig. 1B, the larval MBs are topologically similar to the adult MBs but have only two orthogonal lobes, αL and βL (3, 5, 6). Internally, the peduncles and lobes have simple concentric organization, in which the FAS II (19) and DIF (20) proteins are expressed homogeneously except for the central, unstained core (Fig. 4A). Mutational inactivation of ey resulted in moderate defects in the larval MBs in all the cases examined, with weak but consistent suppression of FAS II in the peduncles and lobes (Fig. 4B). The distribution of FAS II also is affected: the globular end of the αL-lobe is often devoid of FAS II. On the other hand, a null mutation of dac (dac4) barely affected the larval MBs (Fig. 4C). However, 50% reduction of dac activity in heterozygous larvae enhanced the structural defects of ey mutants, suggesting synergistic regulatory functions of the two genes in the development of the MB structures (Fig. 4D). In the double mutant for ey and dac, most parts of the peduncles and lobes showed clear symptoms of neural degeneration including significant degeneration of the αL-lobe in many cases (10–20%). Furthermore, FAS II expression is markedly suppressed, leaving uneven residual expression in the peduncles and remaining lobes.
Figure 4.
Structural defects of larval and pupal MBs. Laser confocal microscopy of larval and pupal brains labeled with anti-FAS II (red) and anti-DIF (blue). (A–D) Larval MBs at the third-instar stage. (Bar = 50 μm.) (A) Wild-type MB showing peduncle (ped) and lobes (αL and βL). (B) MB in ey mutant. Note reduced and irregular FAS II expression whereas DIF staining supports structural retention of the lobes and peduncle. FAS II is lost from the globular end of the αL-lobe (arrowhead). (C) MB in dac mutant; wild-type-like MB with homogeneous and concentric FAS II and DIF staining. (D) MB in ey mutant heterozygous for dac. Note enhanced irregularity in FAS II expression and structural degeneration of the αL-lobe (arrowhead). (E–H) MBs at 50 hr after puparium formation. Neuropils were labeled with anti-FAS II (red) and anti-DIF (blue); nuclei of the Kenyon cells (KCs) were labeled with anti-EY (blue) and anti-DAC (red). (Bar = 50 μm.) (E) Wild-type MBs showing strong FAS II expression in the α- and β-lobes and DIF expression in the γ-lobe. Both FAS II and DIF were moderately expressed in the peduncles and the other lobes. eb, ellipsoid body. (F) MBs in ey mutant. All the MB structures are abolished except for Kenyon cells, which retain DAC expression (red). (G) MBs in dac mutant. Note the significant degeneration in the FAS II tracts. The lobes and peduncles are structurally irregular as revealed by weak DIF staining. Arrowheads, abnormal medial lobes. Kenyon cells expressing EY (blue) are retained. (H) MBs in dac mutant; moderate case, retaining larval-like architecture. Arrowheads indicate aberrant branching of ectopic peduncles. Stars in F–H indicate central complex remnants.
The significance of ey and dac in MB development was examined further in the early pupal stage, in which MBs undergo massive degeneration and reorganization to form the complex adult MB structures (3, 6). Fifty hours after puparium formation, most of the MB structures are reorganized into the adult architecture, in which FAS II is strongly expressed in the α/β-lobes and peduncles and moderately in the γ-lobe (Fig. 4E). In addition, it is heavily expressed in the ellipsoid body, which belongs to the central complex. On the other hand, DIF is strongly expressed in the γ-lobe and weakly in the other lobes and the peduncle.
Mutations of ey abolished all the neuropil structures of the pupal MBs in all the cases examined whereas Kenyon cells expressing DAC are retained (Fig. 4F). Notably, the ellipsoid body also is disrupted in the mutant. The dac4 mutation disrupted most of the neuropil structures of the pupal MBs (Fig. 4G), leaving Kenyon cells expressing EY protein intact. Occasionally dac4 caused ectopic projections of peduncles (Fig. 4H). In these cases, the structural profile of the FAS II expression resembled that of the larval MB structures, with homogeneous concentric patterns suggesting failure of reorganization of the MB structures at the onset of pupation. Thus, these results clearly demonstrate the functional importance of ey and dac in the structural formation of the adult MBs in the course of the massive neural reorganization in the early pupal stage.
Independent Regulation of ey and dac in MB Development.
Studies of eye development have revealed a combinatorial network of key regulatory genes, in which toy acts upstream of ey, which initiates the regulatory feedback loop that additionally includes so, eya, and dac (9). These nuclear regulatory genes then synergistically control the subsequent stages of eye development. To dissect the regulatory network of MB development, we examined expression of ey, toy, and dac in various mutant backgrounds.
Whereas EY and DAC are clearly coexpressed in the embryonic primordia, ey expression was not affected by the loss of dac activity and vice versa (Fig. 5 A–C). Likewise, expression of EY and DAC was independent of each other's activity in the larval MBs (Fig. 5 E and F). EY and DAC are coexpressed in most of the Kenyon cells at the pupal stage except for the central cells, which express only EY (Fig. 5G). Again, mutation of ey did not alter the DAC expression though the number of the Kenyon cells was slightly reduced (Fig. 5H). Mutation of dac did not alter EY expression at all with the normal number of Kenyon cells (Fig. 5I).
Expression of toy is initiated from the cellular blastoderm stage earlier than the onset of ey and dac in both the eye and brain (9). Consistent with this temporal order of gene expression, neither ey nor dac mutation affected the expression of toy in the developing MBs (data not shown). Moreover, we examined DAC expression in nullo 4 embryos, which lack both ey and toy genes because of the loss of the fourth chromosome. Despite that the brain was largely deformed in nullo 4 embryos, characteristic MB neuroblasts expressing a nuclear marker (M.K. and K.F.T., unpublished data) were found at a dorsolateral position of each brain hemisphere with DAC-expressing progenies (Fig. 5D). Taken together, in contrast to the intricate feedback cascade in eye development, these results argue for distinct parallel cascades for the regulation of ey and dac in the developing MBs.
In eye development, ey plays important functions as a master control gene. Targeted expression of ey is sufficient to induce the development of ectopic eyes on wings, legs, and antennae (8). Recent studies have revealed that toy regulates expression of ey through binding its eye-specific enhancer sequences (9). toy is also able to induce ectopic eyes on various epidermal tissues. Both toy and ey are expressed in subsequent larval stages in the eye primordia. In addition to ey and toy, several genes encoding nuclear transcription factors are required for eye development and have been implicated to function synergistically. Targeted expression of dac or eya on their own induces ectopic eyes though albeit much less efficiently than ey (16, 28). Combined expression of so and eya (22) or dac and eya (23) synergistically induces ectopic eyes with positive feedback stimulation on ey.
In the present study, we have shown that three of the eye development genes, ey, toy, and dac, are expressed in the developing MBs and that ey and dac have pivotal functions in the structural formation of the MBs. However, in contrast to the regulatory cascade in eye development, two of the key regulators, so and eya, are not expressed in the developing MBs. Furthermore, we have shown that ey and dac are independently regulated in the MBs, suggesting a distinct combinatorial code of regulatory genes and parallel cascades in the development of the MBs.
In vertebrates, Pax6 is expressed in various regions of forebrain, including the anlagen of the olfactory bulb, piriform cortex, and amygdala, which are important to olfactory information processing and emotional learning (12). Mutations of Pax6 result in profound defects in these forebrain structures as well as other telencephalon regions (14). Intriguingly, a mouse dac homolog also is expressed in the developing telencephalon in overlapping regions with the Pax6 gene (29–31). The findings that, in both Drosophila and mouse, homologs of Pax6 genes are expressed in and required for the development of the neural structures that are important to the olfactory perception and learning raises the possibility that these structures arose very early in brain evolution.
Acknowledgments
We thank Drs. G. Mardon, Y. Engström, N. Bonini, F. Pignoni, C. Goodman, K. Kaiser, as well as the Bloomington Stock Center and Developmental Studies Hybridoma Bank for fly stocks and antibodies. This work was supported by the Grant-in-Aid for Scientific Research on Priority Areas, MESSC of Japan, and the Special Research Project on Dynamic Brain Function of the University of Tsukuba to K.F.T., by the Swiss National Science Foundation and the Kantons of Basel to W.J.G., and by a grant from the Deutsche Forschungsgemeinschaft to U.W. (WA556/4–2).
Abbreviations
- MB
mushroom body
- FAS II
Fasciclin II
Footnotes
Article published online before print: Proc. Natl. Acad. Sci. USA, 10.1073/pnas.040564497.
Article and publication date are at www.pnas.org/cgi/doi/10.1073/pnas.040564497
References
- 1.Heisenberg M. Learn Mem. 1998;5:1–10. [PMC free article] [PubMed] [Google Scholar]
- 2.Yang M Y, Armstrong J D, Vilinsky I, Strausfeld N J, Kaiser K. Neuron. 1995;15:45–54. doi: 10.1016/0896-6273(95)90063-2. [DOI] [PubMed] [Google Scholar]
- 3.Crittenden J R, Skoulakis E M C, Han K-A, Kalderon D, Davis R L. Learn Mem. 1998;5:38–51. [PMC free article] [PubMed] [Google Scholar]
- 4.Ito K, Awano W, Suzuki K, Hiromi Y, Yamamoto D. Development (Cambridge, UK) 1997;124:761–771. doi: 10.1242/dev.124.4.761. [DOI] [PubMed] [Google Scholar]
- 5.Tettamanti M, Armstrong J D, Endo K, Yang M Y, Furukubo-Tokunaga K, Kaiser K, Reichert H. Dev Gene Evol. 1997;207:242–252. doi: 10.1007/s004270050112. [DOI] [PubMed] [Google Scholar]
- 6.Armstrong J D, de Belle J S, Wang Z, Kaiser K. Learn Mem. 1998;5:102–114. [PMC free article] [PubMed] [Google Scholar]
- 7.Quiring R, Walldorf U, Kloter U, Gehring W J. Science. 1994;265:785–789. doi: 10.1126/science.7914031. [DOI] [PubMed] [Google Scholar]
- 8.Halder G, Callaerts P, Gehring W J. Science. 1995;267:1788–1792. doi: 10.1126/science.7892602. [DOI] [PubMed] [Google Scholar]
- 9.Czerny T, Halder G, Kloter U, Souabni A, Gehring W J, Busslinger M. Mol Cell. 1999;3:297–307. doi: 10.1016/s1097-2765(00)80457-8. [DOI] [PubMed] [Google Scholar]
- 10.Callaerts P, Halder G, Gehring W J. Annu Rev Neurosci. 1997;20:483–532. doi: 10.1146/annurev.neuro.20.1.483. [DOI] [PubMed] [Google Scholar]
- 11.Gehring W J, Ikeo K. Trends Genet. 1999;15:371–377. doi: 10.1016/s0168-9525(99)01776-x. [DOI] [PubMed] [Google Scholar]
- 12.Stoykova A, Gruss P. J Neurosci. 1994;14:1395–1412. doi: 10.1523/JNEUROSCI.14-03-01395.1994. [DOI] [PMC free article] [PubMed] [Google Scholar]
- 13.Hanson I, Heyningen V V. Trends Genet. 1995;11:268–272. doi: 10.1016/s0168-9525(00)89073-3. [DOI] [PubMed] [Google Scholar]
- 14.Stoykova A, Fritsch R, Walther C, Gruss P. Development (Cambridge, UK) 1996;122:3453–3465. doi: 10.1242/dev.122.11.3453. [DOI] [PubMed] [Google Scholar]
- 15.Mardon G, Solomon N, Rubin G M. Development (Cambridge, UK) 1994;120:3473–3486. doi: 10.1242/dev.120.12.3473. [DOI] [PubMed] [Google Scholar]
- 16.Shen W, Mardon G. Development (Cambridge, UK) 1997;124:45–52. doi: 10.1242/dev.124.1.45. [DOI] [PubMed] [Google Scholar]
- 17.Hirth F, Therianos S, Loop T, Gehring W J, Reichert H, Furukubo-Tokunaga K. Neuron. 1995;15:769–778. doi: 10.1016/0896-6273(95)90169-8. [DOI] [PubMed] [Google Scholar]
- 18.Bonini N M, Leiserson W M, Benzer S. Cell. 1993;72:379–395. doi: 10.1016/0092-8674(93)90115-7. [DOI] [PubMed] [Google Scholar]
- 19.Grenningloh G, Rehm E J, Goodman C S. Cell. 1991;67:45–57. doi: 10.1016/0092-8674(91)90571-f. [DOI] [PubMed] [Google Scholar]
- 20.Cantera R, Roos E, Engström Y. J Neurobiol. 1999;38:16–26. [PubMed] [Google Scholar]
- 21.Goto S, Hayashi S. Dev Genes Evol. 1997;207:194–198. doi: 10.1007/s004270050107. [DOI] [PubMed] [Google Scholar]
- 22.Pignoni F, Hu B, Zavitz K H, Xiao J, Garrity P A, Zipursky S L. Cell. 1997;91:881–891. doi: 10.1016/s0092-8674(00)80480-8. [DOI] [PubMed] [Google Scholar]
- 23.Chen R, Amoui M, Zhang Z, Mardon G. Cell. 1997;91:893–903. doi: 10.1016/s0092-8674(00)80481-x. [DOI] [PubMed] [Google Scholar]
- 24.Halder G, Callaerts P, Flister S, Walldorf U, Kloter U, Gehring W J. Development (Cambridge, UK) 1998;125:2181–2191. doi: 10.1242/dev.125.12.2181. [DOI] [PubMed] [Google Scholar]
- 25.Niimi T, Seimiya M, Kloter U, Flister S, Gehring W J. Development (Cambridge, UK) 1999;126:2253–2260. doi: 10.1242/dev.126.10.2253. [DOI] [PubMed] [Google Scholar]
- 26.Benjamin N R C, Green P, Martin K, Garren H, Hartenstein V, Zipursky S L. Neuron. 1994;12:977–996. doi: 10.1016/0896-6273(94)90308-5. [DOI] [PubMed] [Google Scholar]
- 27.Serikaku M A, O'Tousa J E. Genetics. 1994;138:1137–1150. doi: 10.1093/genetics/138.4.1137. [DOI] [PMC free article] [PubMed] [Google Scholar]
- 28.Bonini N M, Bui Q T, Gray-board L, Warrick J M. Development (Cambridge, UK) 1997;124:4819–4826. doi: 10.1242/dev.124.23.4819. [DOI] [PubMed] [Google Scholar]
- 29.Caubit X, Thangarajah R, Theil T, Wirth J, Nothwang H-G, Rüther U, Krauss S. Dev Dyn. 1999;214:66–80. doi: 10.1002/(SICI)1097-0177(199901)214:1<66::AID-DVDY7>3.0.CO;2-7. [DOI] [PubMed] [Google Scholar]
- 30.Davis R J, Shen W, Heanue T A, Mardon G. Dev Genes Evol. 1999;209:526–536. doi: 10.1007/s004270050285. [DOI] [PubMed] [Google Scholar]
- 31.Kozmik Z, Pfeffer P, Kralova J, Paces J, Paces V, Kalousova A, Cvekl A. Dev Genes Evol. 1999;209:537–545. doi: 10.1007/s004270050286. [DOI] [PubMed] [Google Scholar]


