Abstract
Hereditary hemochromatosis (HH) is a common autosomal recessive disorder characterized by excess absorption of dietary iron and progressive iron deposition in several tissues, particularly liver. Liver disease resulting from iron toxicity is the major cause of death in HH. Hepatic iron loading in HH is progressive despite down-regulation of the classical transferrin receptor (TfR). Recently a human cDNA highly homologous to TfR was identified and reported to encode a protein (TfR2) that binds holotransferrin and mediates uptake of transferrin-bound iron. We independently identified a full-length murine EST encoding the mouse orthologue of the human TfR2. Although homologous to murine TfR in the coding region, the TfR2 transcript does not contain the iron-responsive elements found in the 3′ untranslated sequence of TfR mRNA. To determine the potential role for TfR2 in iron uptake by liver, we investigated TfR and TfR2 expression in normal mice and murine models of dietary iron overload (2% carbonyl iron), dietary iron deficiency (gastric parietal cell ablation), and HH (HFE −/−). Northern blot analyses demonstrated distinct tissue-specific patterns of expression for TfR and TfR2, with TfR2 expressed highly only in liver where TfR expression is low. In situ hybridization demonstrated abundant TfR2 expression in hepatocytes. In contrast to TfR, TfR2 expression in liver was not increased in iron deficiency. Furthermore, hepatic expression of TfR2 was not down-regulated with dietary iron loading or in the HFE −/− model of HH. From these observations, we propose that TfR2 allows continued uptake of Tf-bound iron by hepatocytes even after TfR has been down-regulated by iron overload, and this uptake contributes to the susceptibility of liver to iron loading in HH.
Hereditary hemochromatosis (HH) is a common disorder of iron homeostasis in which intestinal absorption of iron is excessive, leading to iron deposition in several tissues (for reviews, see refs. 1 and 2). The liver is particularly susceptible to excessive iron deposition, the clinical consequences of which include fibrosis, cirrhosis, and increased risk for hepatocellular carcinoma (2). Liver damage is the major cause of mortality in HH.
The majority of hepatic iron uptake under normal conditions is transferrin mediated (3). However, expression of the classical transferrin receptor (TfR) in hepatocytes (as in other nonreticuloendothelial cell types) has been shown to be down-regulated in response to increased intracellular iron (4, 5). As a consequence, TfR expression in liver is undetectable in HH patients with hepatic iron loading (6–8). Nonetheless, hepatic iron loading in HH patients is progressive. Two mechanisms have been proposed to explain the continued hepatic iron uptake in this setting: (i) the receptor-independent uptake of transferrin-bound iron and (ii) the uptake of iron as free nontransferrin bound iron (3). We provide here support for an alternative mechanism that involves the uptake of transferrin-bound iron by a recently discovered second transferrin receptor (TfR2).
While screening TfR clones in the murine EST database, we identified a cDNA encoding a protein homologous to the classical murine TfR. The human orthologue of this cDNA was independently discovered by Kawabata et al. (9) and designated transferrin receptor 2 (TfR2). Expression of human TfR2 was reported to confer binding of holotransferrin and uptake of transferrin-bound iron to a CHO cell line lacking endogenous TfR. In this report, we characterize the murine TfR2 orthologue and compare expression of murine TfR and TfR2 in normal mice, mice with iron deficiency, and mice with iron overload. These data demonstrate that, unlike TfR, the TfR2 transcript is highly expressed in hepatocytes, not regulated by tissue iron status, and not down-regulated in a murine model of HH. From these observations, we propose that TfR2 continues to mediate uptake of Tf-bound iron by the liver after TfR is down-regulated by iron overload, and thus can explain the increased susceptibility of the liver to iron loading in HH.
Methods
Isolation and Characterization of Murine TfR2 cDNA.
While screening the murine EST database for TfR sequences, we identified and characterized an EST clone (GenBank accession no. AA511579) that demonstrated partial homology to the classical murine TfR. Searches of GenBank against the nucleotide sequence of this EST identified a homologous region on human chromosome 7 predicted to be exon sequence of an uncharacterized human gene, which was designated “transferrin receptor 2,” hereafter referred to as TfR2, based on homology to the TfR gene (10). Search of the murine EST database against putative exon 1 sequences of the human TfR2 gene identified a potentially full-length clone (AI663104) in a mouse embryo library. The nucleotide sequence of each strand was determined by using an Applied Biosystems Prism 373 automated sequencer (Perkin–Elmer), and the deduced amino acid sequence (Vector NTI) was compared with that of the classical TfR.
Animal Models.
Dietary iron loading.
Five C57/B6 mice at 6 wk of age were placed on a diet supplemented with 2% carbonyl iron (Harlan Breeders, Indianapolis) for 6 wk. Five C57/B6 littermates were maintained on the same chow without iron supplementation (0.02% iron). At 12 wk of age, the animals were fasted for 14 hr, bled, killed, and liver tissue snap frozen in liquid nitrogen.
Dietary iron deficiency.
A murine transgenic model of dietary iron deficiency produced by gastric parietal cell ablation (H+/K+-ATPase β subunit −1035 to +24/DT-A) (11) was generously provided by Jeffrey I. Gordon, Washington University School of Medicine, St. Louis, MO. Adult iron-deficient mice were killed and liver tissue snap frozen in liquid nitrogen.
Hereditary hemochromatosis.
A murine model of HH in which the HFE gene had been disrupted by homologous recombination was utilized (12). Five HFE −/− mice and five HFE +/+ littermates were analyzed at 10 wk of age. Animals were fasted for 14 hr, bled, killed, and liver tissue and duodenum (the 1.5-cm length of small intestine distal to the pylorus) were dissected and snap frozen in liquid nitrogen.
Northern Blot Analyses.
Total cellular RNA was isolated from tissues by using a guanidinium/phenol solution (RNA-Stat60, Tel-Test, Friendswood, TX). Fifteen micrograms of total cellular RNA from each sample was electrophoresed in 1% agarose/2.2 M formaldehyde gels. Transcript sizes were estimated by using RNA standards (Promega). The RNA was transferred to Nytran membranes (Schleicher & Schuell) and immobilized by UV crosslinking. Blots were prehybridized for 1 hr, then hybridized with 32P-labeled cRNA probes for murine TfR or TfR2. The template for the TfR2 probe consisted of an EcoRI to PstI fragment (nucleotides 1 to 276) of EST clone AA511579 subcloned into pGEM4 (Promega). The template for the TfR probe consisted of linearized EST clone AA619986 in pSPORT. After overnight hybridization at 65°C in 50% formamide/5× standard saline phosphate/EDTA (0.18 M NaCl/10 mM phosphate, pH 7.4 (SSPE)/1 mM EDTA/5× Denhardt's/50 mM sodium phosphate (pH 6.5)/200 μg/ml salmon sperm DNA/1 mM EDTA/0.1% SDS, the blots were washed in 2× SSPE at room temperature (RT) for 20 min, 0.2× SSPE at RT for 20 min, twice in 0.2× SSPE/0.1% SDS at 65°C for 20 min, and subjected to autoradiography and phosphorimagery. Blots were subsequently rehybridized with a 32P-labeled cRNA probe for the rat β-actin transcript, as described (13). Signal intensities were quantified by using imagequant software (Molecular Dynamics), and values for TfR and TfR2 transcripts were normalized to those obtained for β-actin.
In Situ Hybridization.
Liver tissue was harvested, rinsed in cold PBS, placed in OCT compound, and immediately frozen in 2-methylbutane immersed in liquid nitrogen. Cryostat sections (6 μm) were obtained, dried for 2 hr at RT, and delipidated in chloroform for 5 min. Sections were fixed in 4% paraformaldehyde/PBS for 7 min, rinsed in PBS for 3 min, rinsed twice in 2× SSC for 5 min, and prehybridized at 47°C for 60 min in 4× SSC/10% dextran sulfate/1× Denhardt's solution/2 mM EDTA/50% deionized formamide/500 μg/ml salmon sperm DNA. Hybridization was for 16 hr in 100 μl of prehybridization solution and 200 ng/ml of cRNA. TfR2 probes were prepared by in vitro transcription by using digoxigenin-labeled UTP and linearized template. The antisense probe template is described above. The sense probe template consisted of the same TfR2 sequences in the sense orientation. Both probes were transcribed by using T7 RNA polymerase, subjected to limited alkaline hydrolysis, analyzed on agarose gels, and quantified. After hybridization, sections were rinsed twice in 2× SSC for 5 min at 37°C, 3 times for 5 min each in 60% formamide and 0.2× SSC at 37°C, and twice for 5 min each in 2× SSC at RT. Sections were then rinsed in 100 mM Tris ⋅ HCl, pH 7.5/150 mM NaCl for 5 min, and treated with the same solution saturated with blocking mix for 30 min, and then reacted with a 1:200 dilution of alkaline phosphatase-conjugated sheep antidigoxigenin Fab fragments (750 units/ml) in the same solution. They were rinsed twice in 100 mM Tris ⋅ HCl, pH 7.5 and 150 mM NaCl for 5 min each, then in 100 mM Tris ⋅ HCl, pH 9.5/100 mM NaCl/50 mM MgCl2 for 10 min, and then reacted with 0.18 mg/ml 5-bromo-4-chloro-3-indolyl phosphate, 0.34 mg/ml nitroblue tetrazolium, and 240 μg/ml levamisole (Sigma) in the same solution for 6 hr in the dark at RT. The reaction was stopped with 10 mM Tris ⋅ HCl (pH 8.0) and 1 mM EDTA. Sections were counterstained in nuclear fast red, mounted with aqueous solution, and analyzed by light microscopy.
Measurement of Hepatic Iron Concentration.
Liver tissue was analyzed for nonheme iron by using the bathophenanthroline method as described by Torrance and Bothwell (14), and the values expressed as micrograms of iron per gram of dry weight.
Measurement of Serum Transferrin Saturation.
Blood was obtained by cardiac puncture. Serum iron and total iron-binding capacity (TIBC) were measured by using the protocol of Fielding (15). Transferrin saturation was calculated as: (serum iron ÷ TIBC) × 100%.
Statistical Analysis.
Values are expressed as mean ± SEM. Differences between means were determined by using Student's t test, with Welch's correction for unequal variance.
Results
Characterization of Murine TfR2 cDNA.
The murine EST AI663104 clone was found to contain a full-length cDNA that encodes a gene product homologous to the TfR. This cDNA sequence (AF222895) contains 81 nucleotides of 5′ untranslated sequence, 2,394 nucleotides of ORF, and 364 nucleotides of 3′ untranslated sequence, including a canonical polyadenlyation signal 14 nt upstream of a poly(A) tail. In the coding region, the nucleotide sequence is 50% homologous to the classical murine TfR transcript (16). However, the TfR2 cDNA has a shorter 3′ untranslated region and does not contain the iron-responsive elements found in the TfR transcript (Fig. 1). In fact, analysis of the entire murine TfR2 cDNA revealed no regions of homology to consensus sequences for iron-responsive elements (17).
Figure 1.
Comparison of TfR and TfR2 transcripts. The relative sizes and composition of the TfR and TfR2 transcripts are represented. The TfR transcript is 4.9 kb and the TfR2 2.8 kb, with the size difference accountable to a shorter 3′ untranslated region in TfR2 that excludes the region containing the iron-responsive elements.
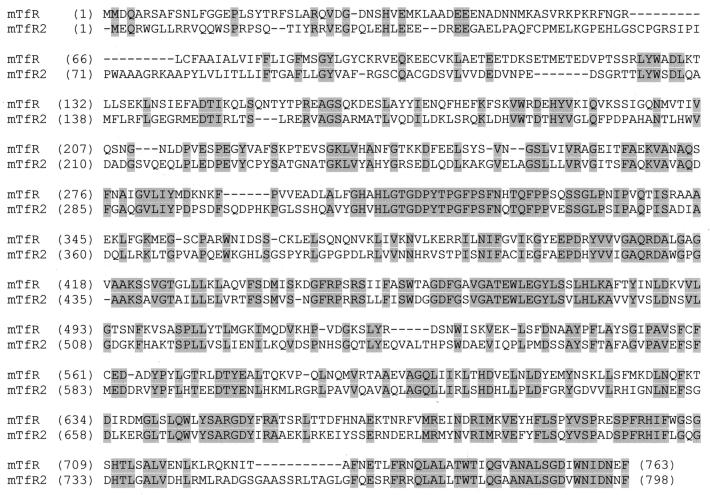
The ORF of the murine TfR2 cDNA encodes a 798-aa protein that demonstrates 39% identity (and 53% similarity) to the classical TfR (Fig. 2). Kawabata et al. (9) independently characterized the human orthologue of murine TfR2 and demonstrated that the expressed protein bound transferrin and mediated cellular iron uptake. The human orthologue is 3 aa longer than the deduced murine TfR2 protein, but the amino acid sequences are otherwise highly conserved (84%). Based on homology comparisons and sequence analysis, the murine TfR2 protein is predicted to include a short intracellular domain (amino acids 1 to 78), followed by a single transmembrane domain (amino acids 79 to 102) and an extensive extracellular domain (amino acids 103 to 798). The predicted topology is thus similar to that of the classical TfR, which is a type II membrane protein. The putative intracellular domain of TfR2 is poorly conserved compared with the classical TfR but does contain the sequence YRRV (YQRV in the human) similar to the internalization signal (YTRF) of the classical TfR (18). The predicted ectodomains of the TfR and TfR2 proteins are quite conserved and each include the RGD sequence (amino acids 673–675 of murine TfR2) reported to be necessary for binding of transferrin to the classical TfR (19).
Figure 2.
Comparison of deduced amino acid sequences of mouse TfR2 and TfR. The deduced amino acid sequence of murine TfR2 is compared with that of the classical murine TfR. Strictly conserved amino acids are shaded.
Tissue Distribution of TfR2 mRNA.
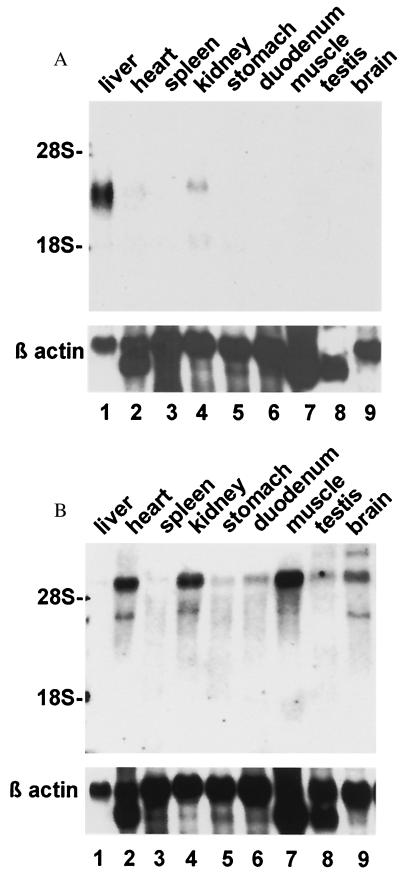
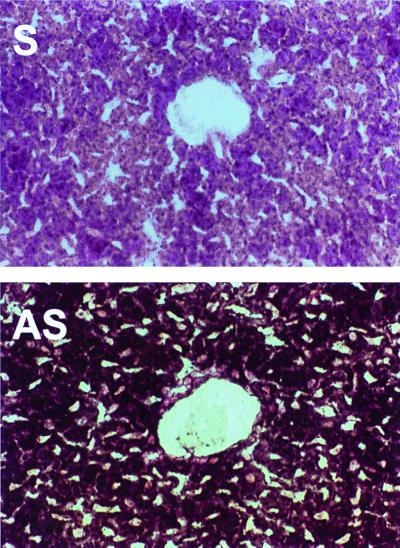
The patterns of expression of TfR2 and the classical TfR in mouse tissues were compared by using Northern blot analyses. A single TfR2 transcript of ≈2.8 kb (consistent with the size predicted by the cDNA) was abundant only in liver (Fig. 3A, lane 1). A faint signal was also detected in kidney (lane 4) and (on prolonged exposure) in small intestine and muscle (not shown). No signal was detected in mRNA from mouse placenta (data not shown). By contrast, the mRNA for the classical TfR was found to be widely expressed (Fig. 3B). Although abundant in heart, kidney, and muscle and easily detected in other tissues, levels were low in liver (lane 1). From these data, it appears that basal expression of TfR2 mRNA exceeds that of TfR mRNA in normal liver. Consistent with a high level of expression of TfR2 in liver, 2% of the clones in a murine liver cDNA library were found to represent TfR2 (http://www.ncbi.nlm.nih.gov/UniGene/lib.cgi?ORG=Mm&LID=195). ESTs representing TfR2 have also been identified in cDNA libraries from muscle and mammary gland. Using in situ hybridization, we found the signal corresponding to TfR2 mRNA to be particularly strong in hepatocytes (Fig. 4).
Figure 3.
Northern blot analysis of the tissue-specific expression of TfR2 and TfR. Fifteen micrograms of total cellular RNA from the murine tissues indicated (Top) was electrophoresed in duplicate and blotted. Blots were hybridized with 32P-labeled probe for mouse TfR2 (A) or mouse TfR (B). The blots were washed under high stringency and exposed to film for 18 hr with an intensifying screen, then rehybridized with a probe for β-actin (Bottom). Positions of the 28S and 18S ribosomal RNA bands are indicated (Left).
Figure 4.
In situ hybridization analysis of TfR2 mRNA expression in liver. Frozen sections of mouse liver were hybridized with sense (S) or antisense (AS) digoxigenin-labeled probes transcribed from the TfR2 cDNA. Signal was detected as alkaline phosphatase activity by using NBT as a substrate and appears as a dark blue product. The sections were counterstained with nuclear fast red and analyzed by light microscopy (×400).
Effect of Iron Status on TfR2 mRNA in Liver.
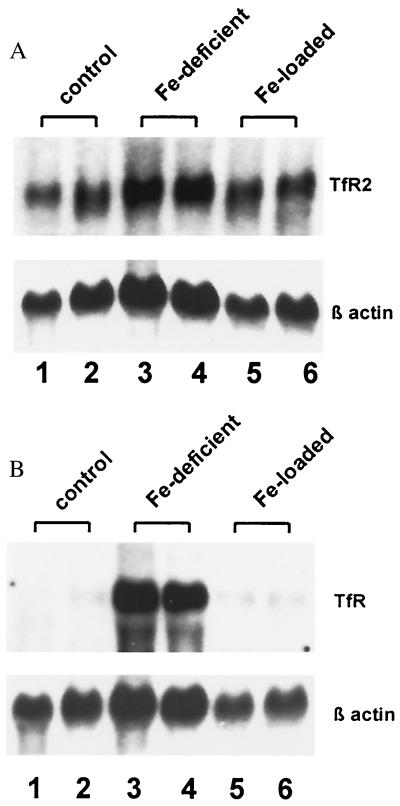
Hepatic expression of the TfR has been reported to be up-regulated in rodent models of dietary iron deficiency and down-regulated by dietary iron loading (20, 21). To determine whether TfR2 expression is regulated by iron status, we analyzed TfR2 mRNA in control, iron-deficient, and iron-loaded mice. No significant difference in hepatic TfR2 mRNA content was observed between control and iron-deficient mice (Fig. 5A). In contrast, hepatic expression of the classical TfR mRNA was markedly increased (≈20-fold) by iron deficiency (Fig. 5B). Furthermore, abundant hepatic expression of TfR2 persisted in the animals after dietary iron loading (Fig. 5A). The data in Fig. 6 demonstrate that TfR2 mRNA is not down-regulated (Fig. 6C), even when dietary iron loading has produced complete saturation of serum transferrin (Fig. 6A) and dramatic liver iron loading (Fig. 6B).
Figure 5.
Northern blot analysis of TfR2 and TfR expression in mice with dietary iron deficiency or overload. Liver RNA was isolated from mice maintained on a standard (0.02% iron) diet (lanes 1 and 2), mice with dietary iron deficiency (lanes 3 and 4), and mice maintained on a diet supplemented with 2% carbonyl iron for 6 wk (lanes 5 and 6). Fifteen micrograms of total cellular RNA was electrophoresed in duplicate and blotted. Blots were hybridized with 32P-labeled probes for mouse TfR2 (A) or mouse TfR (B). Blots were washed under high stringency, exposed to film for 18 hr with an intensifying screen, and rehybridized with a probe for β-actin (Bottom).
Figure 6.
Iron status and hepatic TfR2 mRNA expression in control mice and mice with dietary iron overload. Serum transferrin saturations (A), hepatic iron concentrations (B), and relative TfR2 liver mRNA contents (C) were compared in mice maintained on a standard diet (open bars) and mice maintained on a diet supplemented with 2% carbonyl iron for 6 wk (shaded bars). TfR2 mRNA levels were normalized to those for β-actin and are expressed relative to the mean of the control group. Values are expressed as mean +/− SEM, n = 5, each group. *, P < 0.05 by Student's t test, with Welch's correction for unequal variance.
TfR2 mRNA levels in Murine Model of Hereditary Hemochromatosis.
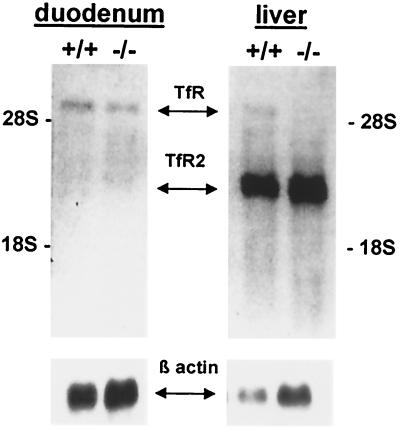
Hepatic expression of the classical TfR protein (6–8) and mRNA (22) was reported to be down-regulated in patients with HH. We compared hepatic expression of TfR and TfR2 mRNA in livers of control mice and mice with a targeted disruption of the HFE gene (12). TfR mRNA was quite low in liver from control mice (Fig. 7, lane 3) and was undetectable in liver from HFE −/− mice (Fig. 7, lane 4). By contrast, TfR2 mRNA was abundant in both control and HFE −/− mouse liver (Fig. 7, lanes 1 and 2).
Figure 7.
Northern blot analysis of duodenal and hepatic TfR and TfR2 expression in control and HFE knockout mice. Duodenal and liver RNA was isolated from HFE knockout mice (−/−) and wild-type littermates (+/+) maintained on a standard diet. Fifteen micrograms of total cellular RNA was electrophoresed in duplicate and blotted. The blot was hybridized with a 32P-labeled probe for mouse TfR2 and rehybridized without removing the TfR2 signal with a 32P-labeled probe for TfR. The blot was exposed to film for 18 hr with an intensifying screen. The results after the second hybridization are presented and relative positions of the TfR and TfR2 signals indicated. The blot was subsequently hybridized with a probe for β-actin (Bottom).
Fig. 8 presents results showing that hepatic iron loading (Fig. 8B), which has been demonstrated in HFE −/− mice (12, 23, 24), occurred before transferrin was fully saturated (Fig. 8A). Despite the substantial iron loading in liver, TfR2 mRNA was still highly expressed (Fig. 8C).
Figure 8.
Iron status and hepatic TfR2 mRNA expression in control and HFE knockout mice. Serum transferrin saturations (A), hepatic iron concentrations (B), and relative TfR2 liver mRNA contents (C) are compared in control mice (HFE +/+, open bars) and HFE knockout mice (−/−, shaded bars) maintained on a standard diet. TfR2 mRNA levels were normalized to those for β-actin and are expressed relative to the mean of the control (+/+) group. TfR mRNA levels were not significantly different between HFE −/− and control mice. Values are expressed as mean +/− SEM (n = 5, each group). *, P < 0.05 by Student's t test, with Welch's correction for unequal variance.
Discussion
The regulation of hepatocellular iron uptake is an important determinant of overall iron homeostasis of the organism. Under normal conditions, the majority of hepatic iron uptake is transferrin mediated and is thought to occur by both receptor-dependent and receptor-independent mechanisms (25, 26). The first of these mechanisms, receptor-mediated uptake, has been attributed solely to the activity of the classical TfR. However, data presented here show that under normal conditions, as well as in hepatic iron overload, expression of TfR2 mRNA in liver exceeds that of TfR mRNA. Thus, even under basal conditions, at least a portion of the receptor-mediated uptake of iron by hepatocytes is likely to be mediated by TfR2.
Other proposed mechanisms of transferrin-mediated iron uptake by hepatocytes are receptor independent and involve internalization of holotransferrin bound to low-affinity nonspecific cell surface-binding sites and internalization of holotransferrin in the fluid phase (25). These nonsaturable forms of uptake would not be confused with TfR2-mediated uptake and are of questionable significance in vivo (27).
A transferrin-independent mechanism of iron uptake by hepatocytes has been demonstrated in hypotransferrinemia (28) and may become important when transferrin is abundant but highly saturated. As transferrin becomes highly saturated, iron circulates in the plasma unbound to transferrin in low molecular weight complexes (29). This nontransferrin-bound iron (NTBI) undergoes rapid and efficient first-pass extraction by the liver (30). Data suggest that NTBI may contribute to hepatic iron loading in HH patients, particularly late in the disease (31, 32). However, observations of young patients with HH (33, 34) and on HFE knockout mice at 4 wk of age (35) demonstrate that the liver begins to load iron well before plasma transferrin becomes highly saturated. These observations suggest that the uptake of transferrin-bound iron is important in early stages of hepatic iron loading. We suggest that expression of TfR2 can account for this iron loading by mediating uptake of transferrin-bound iron from serum, even in the face of hepatic iron loading that would down-regulate the classical TfR.
The observation that expression of murine TfR2 is not regulated by tissue iron status correlates with the absence of iron-responsive elements (IREs) in the TfR2 cDNA. Comparison of the human TfR2 and TfR genes also demonstrates that none of the IRE elements in the TfR gene is conserved in the TfR2 gene. Thus, it is likely that the human TfR2 transcript is also insensitive to regulation by cellular iron status and that TfR2 contributes to iron loading of liver in human HH.
The existence of two transferrin receptors—one that is regulated by iron and one that is not—raises interesting questions. On the one hand, the high level of TfR2 expression in hepatocytes suggests a particular role for this receptor in liver. Hepatocytes play an important role in the storage of body iron. Possibly TfR2 normally contributes substantially to the liver's ability to capture and store iron. Observing the phenotype of the TfR2 knockout mice may shed light on its role in normal iron homeostasis. On the other hand, the observation that the TfR knockout mutation in the mouse leads to an embryonic lethal phenotype shows that TfR and TfR2 are not redundant (36). The absence of expression of TfR2 in placenta and other differences in tissue-specific expression (Fig. 3 A and B) probably explain why the TfR2 cannot compensate for the absence of TfR.
The iron-insensitive hepatic expression of TfR2 may be important to the organism in conditions of iron excess where TfR2-mediated uptake of transferrin-bound iron by hepatocytes may sequester iron and protect parenchymal cells in other organs from iron toxicity. Crossing the TfR2 knockout mutation onto the HFE −/− background would test the hypothesis that TfR2-mediated uptake of iron accounts for iron loading in HH before transferrin is fully saturated and also indicate whether failure of the liver to take up iron by this mechanism would lead to greater sensitivity of parenchymal cells in other organs to iron toxicity.
Acknowledgments
We acknowledge Dr. Jeffrey I. Gordon for providing the H+/K+-ATPase β subunit −1035 to +24/DT-A mouse tissues, Dr. Karen O'Malley for providing the rat β-actin cDNA (Washington University School of Medicine, St. Louis, MO), Rosemary O'Neill and Joni Kneer for technical assistance, and Elizabeth Torno for editorial assistance. This work was supported by grants DK53405 (W.S.S.), GM34182 (W.S.S.), and DK41816 (B.R.B.) from the National Institutes of Health and by support from the Fleur de Lis Foundation.
Abbreviations
- HH
hereditary hemochromatosis
- Tf
transferrin
- TfR
transferrin receptor
- TfR2
transferrin receptor 2
- EST
expressed sequence tag
- RT
room temperature
Footnotes
Data deposition: The sequence reprinted in this paper has been deposited in the GenBank database (accession no. AF222895).
Article published online before print: Proc. Natl. Acad. Sci. USA, 10.1073/pnas.040548097.
Article and publication date are at www.pnas.org/cgi/doi/10.1073/pnas.040548097
References
- 1.Bacon B R, Powell L W, Adams P C, Kresina T F, Hoofnagle J H. Gastroenterology. 1999;116:193–207. doi: 10.1016/s0016-5085(99)70244-1. [DOI] [PubMed] [Google Scholar]
- 2.Niederau C, Erhardt A, Häussinger D, Strohmeyer G. J Hepatol. 1999;30:6–11. [PubMed] [Google Scholar]
- 3.Bonkovsky H L. Am J Med Sci. 1991;301:32–43. doi: 10.1097/00000441-199101000-00006. [DOI] [PubMed] [Google Scholar]
- 4.Hubert N, Lescoat G, Sciot R, Moirand R, Jego P, Leroyer P, Brissot P. J Hepatol. 1993;18:301–312. doi: 10.1016/s0168-8278(05)80274-0. [DOI] [PubMed] [Google Scholar]
- 5.Testa U, Pelosi E, Peschle C. Crit Rev Oncog. 1993;4:241–276. [PubMed] [Google Scholar]
- 6.Sciot R, Paterson A C, Van den Oord J J, Desmet V J. Hepatology. 1987;7:831–837. doi: 10.1002/hep.1840070507. [DOI] [PubMed] [Google Scholar]
- 7.De Vos R, Sciot R, van Eyken P, Desmet V J. Virchows Arch B Cell Pathol Incl Mol Pathol. 1988;55:11–17. doi: 10.1007/BF02896555. [DOI] [PubMed] [Google Scholar]
- 8.Lombard M, Bomford A, Hynes M, Naoumov N V, Roberts S, Crowe J, Williams R. Hepatology. 1989;9:1–5. doi: 10.1002/hep.1840090102. [DOI] [PubMed] [Google Scholar]
- 9.Kawabata H, Yang R, Hirama T, Vuong P T, Kawano S, Gombart A F, Koeffler H P. J Biol Chem. 1999;274:20826–20832. doi: 10.1074/jbc.274.30.20826. [DOI] [PubMed] [Google Scholar]
- 10.Glockner G, Scherer S, Schattevoy R, Boright A, Weber J, Tsui L C, Rosenthal A. Genome Res. 1998;8:1060–1073. doi: 10.1101/gr.8.10.1060. [DOI] [PMC free article] [PubMed] [Google Scholar]
- 11.Li Q, Karam S M, Gordon J I. J Biol Chem. 1996;271:3671–3676. [PubMed] [Google Scholar]
- 12.Zhou X Y, Tomatsu S, Fleming R E, Parkkila S, Waheed A, Jiang J, Fei Y, Brunt E M, Ruddy D A, Prass C E, et al. Proc Natl Acad Sci USA. 1998;95:2492–2497. doi: 10.1073/pnas.95.5.2492. [DOI] [PMC free article] [PubMed] [Google Scholar]
- 13.Fleming R E, Gitlin J D. J Biol Chem. 1990;265:7701–7707. [PubMed] [Google Scholar]
- 14.Torrance J D, Bothwell T H. Methods Haematol. 1980;1:90–115. [Google Scholar]
- 15.Fielding J. Methods Haematol. 1980;1:15–43. [Google Scholar]
- 16.Stearne P A, Pietersz G A, Goding J W. J Immunol. 1985;134:3474–3479. [PubMed] [Google Scholar]
- 17.Theil E C. Biofactors. 1993;4:87–93. [PubMed] [Google Scholar]
- 18.Collawn J F, Lai A, Domingo D, Fitch M, Hatton S, Trowbridge I S. J Biol Chem. 1993;268:21686–21692. [PubMed] [Google Scholar]
- 19.Dubljevic V, Sali A, Goding J W. Biochem J. 1999;341:11–14. [PMC free article] [PubMed] [Google Scholar]
- 20.Lu J P, Hayashi K, Awai M. Acta Pathol Jpn. 1989;39:759–764. doi: 10.1111/j.1440-1827.1989.tb02427.x. [DOI] [PubMed] [Google Scholar]
- 21.Sciot R, Verhoeven G, Van Eyken P, Cailleau J, Desmet V J. Hepatology. 1990;11:416–427. doi: 10.1002/hep.1840110313. [DOI] [PubMed] [Google Scholar]
- 22.Pietrangelo A, Rocchi E, Ferrari A, Ventura E, Cairo G. Hepatology. 1991;14:1083–1089. [PubMed] [Google Scholar]
- 23.Levy J E, Montross L K, Cohen D E, Fleming M D, Andrews N C. Blood. 1999;94:9–11. [PubMed] [Google Scholar]
- 24.Bahram S, Gilfillan S, Kühn L C, Moret R, Schulze J B, Lebeau A, Schümann K. Proc Natl Acad Sci USA. 1999;96:13312–13317. doi: 10.1073/pnas.96.23.13312. [DOI] [PMC free article] [PubMed] [Google Scholar]
- 25.Sciot R, van Eyken P, Desmet V J. APMIS Suppl. 1991;23:21–31. [PubMed] [Google Scholar]
- 26.Aisen P. Ann N Y Acad Sci. 1988;526:93–100. doi: 10.1111/j.1749-6632.1988.tb55495.x. , 1988. [DOI] [PubMed] [Google Scholar]
- 27.Morgan E H. Comp Biochem Physiol A. 1991;99:91–95. doi: 10.1016/0300-9629(91)90240-d. [DOI] [PubMed] [Google Scholar]
- 28.Buys S S, Martin C B, Eldridge M, Kushner J P, Kaplan J. Blood. 1992;78:3288–3290. [PubMed] [Google Scholar]
- 29.Gosriwatana I, Loreal O, Lu S, Brissot P, Porter J, Hider R C. Anal Biochem. 1999;273:212–220. doi: 10.1006/abio.1999.4216. [DOI] [PubMed] [Google Scholar]
- 30.Wright T L, Brissot P, Ma W L, Weisiger R A. J Biol Chem. 1986;261:10909–10914. [PubMed] [Google Scholar]
- 31.Batey R G, Lai Chung Fong P, Shamir S, Sherlock S. Dig Dis Sci. 1980;25:340–346. doi: 10.1007/BF01308057. [DOI] [PubMed] [Google Scholar]
- 32.Aruoma O I, Bomford A, Polson R J, Halliwell B. Blood. 1988;72:1416–1419. [PubMed] [Google Scholar]
- 33.Kaikov Y, Wadsworth L D, Hassall E, Dimmick J E, Rogers P C. Pediatrics. 1992;90:37–42. [PubMed] [Google Scholar]
- 34.Adams P C, Kertesz A E, Valberg L S. Hepatology. 1995;22:1720–1727. [PubMed] [Google Scholar]
- 35.Fleming R E, Migas M C, Zhou X, Jiang J, Britton R S, Brunt E M, Tomatsu S, Waheed A, Bacon B R, Sly W S. Proc Natl Acad Sci USA. 1999;96:3143–3148. doi: 10.1073/pnas.96.6.3143. [DOI] [PMC free article] [PubMed] [Google Scholar]
- 36.Levy J E, Jin O, Fujiwara Y, Kuo F, Andrews N C. Nat Genet. 1999;21:396–399. doi: 10.1038/7727. [DOI] [PubMed] [Google Scholar]


