Abstract
In many multi-disciplinary fields of science, such as tissue engineering, where material and biological sciences are combined, there is a need for a tool that combines ultrastructural and chemical data analysis in a non-destructive manner at high resolution. We show that a combination of confocal Raman spectroscopy (CRS) and scanning electron microscopy (SEM) can be used for such analysis. Studies of atomic composition can be done by X-ray microanalysis in SEM, but this is only possible for atomic numbers greater than five and does not reveal molecular identity. Raman spectroscopy, however, can provide information on molecular composition and identity by detection of wavelength shifts caused by molecular vibrations. In this study, CRS–SEM revealed that early in vitro-formed bone extracellular matrix (ECM) produced by rat osteoprogenitor cells resembles mature bone chemically. We gained insight into the structure and chemical composition of the ECM, which was composed of mainly mineralized collagen type I fibres and areas of dense carbonated calcium phosphate related to the collagen fibre density, as revealed by Raman imaging of SEM samples. We found that CRS–SEM allows the study of specimens in a non-destructive manner and provides high-resolution structural and chemical information about inorganic and organic constituents by parallel measurements on the same sample.
Keywords: scanning electron microscopy, confocal Raman spectroscopy, osteoblasts, extracellular matrix, Raman imaging
1. Introduction
Raman spectroscopy provides information on molecular vibrations. Raman spectroscopy is a method based on an inelastic scattering effect. In short, a monochromatic light source (laser) irradiation can excite molecules to a higher vibration state, which then relax to a different vibration level from their original state. As a result, a photon is emitted with less energy and, therefore, a longer wavelength than the initial photons from the laser. This event is called Stokes Raman scattering. The energy difference between the incident and scattered radiations appears as a frequency shift from the incident light. These frequency shifts are specific for a given chemical bond and, therefore, allow molecular analysis. Not only can scanning electron microscopy (SEM) be used for structural analysis, but also it can provide chemical information as well, by using X-ray microanalysis (XRMA). XRMA is, however, limited because no molecular information can be obtained from these data and moreover, detection of elements is limited to the higher atomic numbers (greater than five). In contrast, Raman spectroscopy can give information on molecular identity, composition, orientation and crystal form by detection of wavelength shifts caused by molecular vibrations. Therefore, combining SEM with confocal Raman spectroscopy (CRS) not only allows structural and elemental analysis of a sample, but also can provide information about the presence of inorganic and organic molecules in a non-invasive manner. In general, highly sensitive systems, containing high-power lasers and liquid-cooled CCD cameras are needed to obtain high signal-to-noise ratio data when studying biological samples with Raman spectroscopy. A clear example of such a system was shown in a study done on polytene chromosomes showing different DNA-protein ratios in their interbands (Puppels et al. 1990). However, the above-mentioned systems are in general too large to fit into a vacuum chamber of a SEM. We have built a compact confocal Raman microscope that was incorporated into the vacuum chamber of an environmental SEM, thus allowing us to do non-invasive chemical and ultrastructure research on typical biological samples. In tissue engineering, (bio)materials are commonly combined with biological components, such as the addition of specific cells or proteins for drug release, etc. In most cases, inorganic and organic components are present and preferably need to be evaluated in the most non-invasive way possible, in order to maintain the structure of the sample. Several different authors investigated the mineralization of a collagen matrix made by osteoprogenitor cells in vitro on different substrata by electron microscopy. In these cases, a network of collagen fibres was observed that had undergone calcification (Oghusi et al. 1992; Yoshikawa et al. 1997; Yamamoto et al. 2002). Separate FTIR and XRD analysis showed that the observed mineralization consisted of carbonated apatite-like calcium phosphate (CO3-AP) comparable to bone (Oghusi et al. 1992; Ou-Yang et al. 2001). In previous studies on bone, by using Raman spectroscopy in all cases, the samples used were bulk-like and sometimes treated specifically with hydrazine (Walters et al. 1990; Rehman et al. 1995) or H2O2 (Penel et al. 1998; Freeman & Silva 2002) to decrease fluorescence of the samples. Although these approaches produce compositional data, they do not allow for both chemical and ultrastructural analysis at the same time. Recently, a combination of transmission light microscopy and Raman spectroscopy has been used to study micro-damage in bovine bone and to image damage at low magnifications (Timlin et al. 2000), showing that different types of carbonated apatite were present around micro-cracks. This proved that high-resolution Raman analysis on a micrometer scale can reveal crucial information about sample composition, which can then be related to 2D histology. In 3D cell cultures, it was found by CRS that human osteoblasts produced bone cell spheroids, under the influence of TGF-β1, containing microspicules, composed of CO3-AP similar, to mature bone (Kale et al. 2000). These examples illustrate that there is an increasing demand for combining ultrastructural with chemical analysis at high resolution, to gain a better understanding of the formation of extracellular matrix (ECM) in active cellular processes. In this study, we investigated in vitro-formed bone ECM, produced by osteoprogenitor cells obtained from rats, on titanium alloy plates.
2. Methods
Biomimetic CO3-AP coatings were provided by IsoTis SA (The Netherlands). The coatings were prepared according to a precipitation method by Barrere et al. (1999, 2001) on sandblasted Ti6Al4V (Smitford Staal BV, The Netherlands) square plates with a surface area of 100 mm2, and 1 mm thickness. The plates were ultrasonically cleaned for 15 min in acetone, 70% ethanol and demi-water, in sequence. The coatings were analysed by XRMA, SEM (FEI, model XL-30 ESEM-FEG) and combined confocal Raman scanning electron microscopy (CRSEM) as described in the following.
2.1 Cell culture
Rat bone marrow cells were isolated from the femora of young (150 g) male Wistar rats (Maniatopoulos et al. 1988) and cultured in T75 flasks. Cell culture medium used during culture and seeding was composed of α-MEM medium (Life technologies, The Netherlands) containing 0.2×10⁻³ M l-ascorbic-acid-2 phosphate (ASAP, Life technologies), 0.01 M β-glycerophosphate (βGP, Sigma, The Netherlands), 1×10⁻⁸ M dexamethasone (DEX, Sigma), 15% foetal bovine serum (FBS, Life technologies) and 1% penicillin–streptomycin. At the third passage, the cells were seeded onto Ti6Al4V plates at a density of 1×10⁴ cells cm−2 and then cultured for two weeks to allow sufficient ECM formation. As a control, the cells were also seeded on tissue culture polystyrene to monitor the growth and morphology of the cells. After 14 days of culture the cells were fixated with 1.5% glutaraldehyde in 0.14 M cacoadylate buffer (pH 7.4). After fixation, the cells were dehydrated by immersion in an increasing ethanol series (70–100%) and then critical point dried (Balzers CPD 030). In order to reveal the ECM structure underneath the cultured cells, the top cell layer was removed by gently applying either pressurized air to blow of the cell layer, or Scotch tape to reveal the underlying ECM and cells. The samples were analysed by CRSEM and XRMA. Pure collagen type I (Sigma) from bovine tendon was used as a positive control for collagen present in the ECM measured by Raman spectroscopy.
2.2 Combined confocal Raman scanning electron microscope
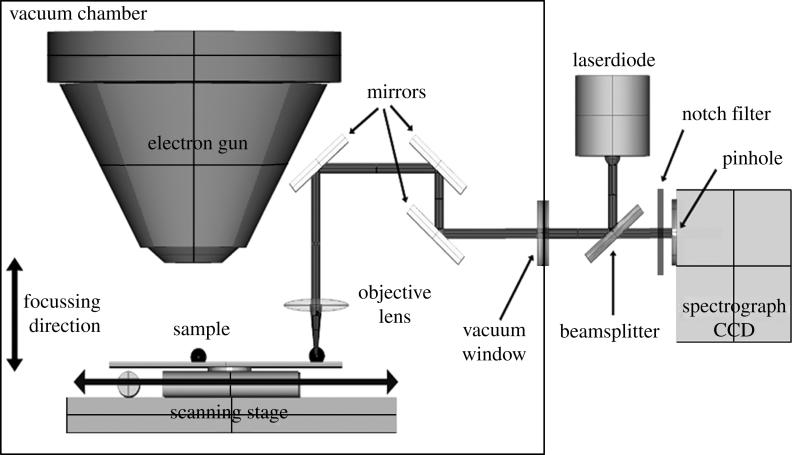
A collimated and circularly symmetrical beam from a diode laser with a frequency of 685 nm is reflected by a dichroïc beam splitter (BS) into the vacuum chamber of the SEM through a coupling window (figure 1). The beam is then focused by a 60× objective (numerical aperture 0.65) on a sample of interest. The excited Raman scattering is collected by the same objective, and the Stokes components of Raman frequencies pass through the BS, a notch filter and a pinhole (∅ 0.25 μm), which allows for confocality of the system. The scattering is collected by spectrograph–monochromator, in which the incoming light is decomposed by a concave holographic diffraction grating and focused on a thermo-electrically cooled CCD (1056×256 pixels, Princeton Instruments Spec10). The theoretical spatial resolution of the system is ∼700 nm with an effective laser power of 6 mW on the sample. The CCD is connected with a computer for data collection and analysis using WinSpec (Roper Scientific Inc., USA) and Microcal Origin (Microcal Software Inc., USA) data analysis software. The set-up was calibrated by using 2, 5 and 10 μm ∅ polystyrene beads to establish the coordinates needed for lateral movement from the electron gun to the laser spot. Raman measurements were taken of the ECM observed by SEM in such a way that the focal plane always just touched the titanium alloy substrate surface; in this way all measurements were done the same. After collection of whole Raman spectra, images were collected on chosen frequencies by using a nanometre scanning stage (Kleindiek, Germany). The stage was controlled by LabView software (National Instruments, USA), and images were then generated from WinSpec data files by programming in LabView.
Figure 1.
Schematic of the CRSEM. Samples are analysed by selecting a location by EM and then shifting the sample into the confocal laser spot at exact coordinates. The laser source consists of a laser diode with a wavelength of 685 nm and is diverted through a side port into the vacuum chamber by a BS. The laser is then emitted onto the sample by a set of gold-coated mirrors through a 60× objective. The induced Raman scatter is then collected by the same objective and diverted in the opposite direction, through a pinhole allowing for confocality of the system. Inside the spectrograph, the Raman scattering is subsequently focused on a holographic diffraction grating, and the decomposed wavelengths are then detected by a thermo-electrically cooled CCD. The scanning stage (nanometre movement) is equipped with a small light source to use transmission light microscopic observation for easy calibration of stage movement.
3. Results
3.1 Confocal Raman scanning electron microscopy
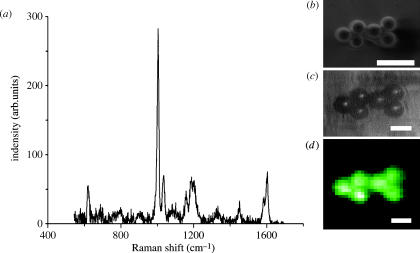
We used polystyrene beads of sizes 10–2 μm to calibrate sample stage positioning. In this manner, we established the exact movement of our samples from our electron micrograph to the laser spot of the confocal Raman microscope. We were able to obtain clear polystyrene spectra (figure 2a) from these samples and, furthermore, were able to select a specific band (1004 cm−1) for vibration of the aromatic ring group of polystyrene for chemical imaging. We decided to image (figure 2d) the samples with a step size of 1 μm, by using a nanometre scanning stage to build onto the SEM sample stage to show the efficacy of the system. We found that sample movement was very accurate and that the analysis of very small samples was possible.
Figure 2.
Raman spectrum (a) of the first bead from the left, show in electron micrograph (b). (c) Five μm diameter polystyrene beads, transmission light micrograph observed trough the objective lens; inset (d) corresponding Raman image (1 pixel=1 μm) using the 1004 cm−1 band of polystyrene. Scale bar in (b) represents 10 μm, and in (c) and (d) 5 μm.
3.2 CRSEM and biomimetic carbonated apatite-like coatings (CO3-AP)
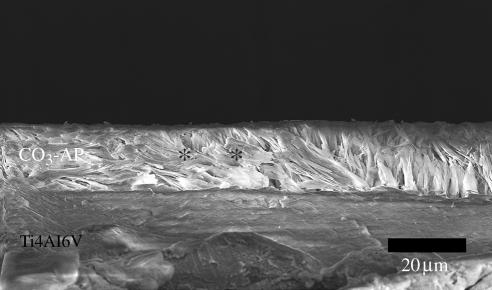
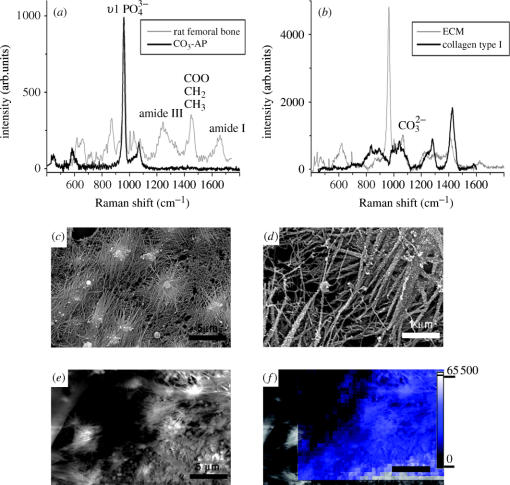
After establishing the feasibility of our measurement system, we measured several cross-sections of thin CO3-AP coatings on titanium alloy plates to check if we could reproducibly measure a more complex sample. Cross-sections of coatings were all measured in the centre to ensure that all measurements were performed in the same manner (figure 3). The obtained spectra (figure 4a) show Raman bands belonging to the phosphate group vibration modes: 960 cm−1 υ1, 430–450 cm−1 υ2, 1030–1040 cm−1 υ3, 580–590 cm−1 υ4 and also a band around 1070 cm−1, which is due to the presence of the stretch vibration of the carbonate group.
Figure 3.
Electron micrograph showing a cross-section of CO3-AP coating, Raman spectra were collected at the centre of the cross-section (asterisks). Scale bar represents 20 μm.
Figure 4.
(a) Raman spectra of femoral rat bone, CO3-AP; (b) ECM and collagen type I; (c)–(e) electron micrographs of ECM produced by rat osteoprogenitor cells, showing mineralized collagen fibre bundles (width 0.1–0.5 μm); (f) Raman image from an area of (e), which was subsequently imaged using the 960 cm−1 band (1 pixel=0.5 μm). Scale bars in (c), (e) represent 5 μm and in (d) 1 μm.
3.3 CRSEM and bone ECM by rat osteoprogenitor cells
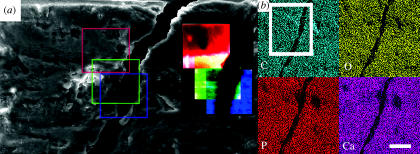
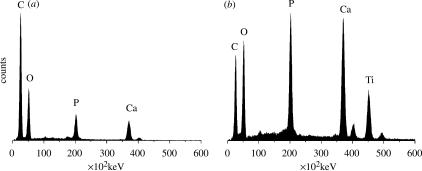
After 14 days of culture, osteogenic medium rat osteoprogenitor cells had produced a vast amount of well-organized ECM on the surface of the titanium alloy discs. In all cases, the samples were covered with a smooth layer of cells. In order to reveal the underlying ECM structure and study the matrix without interference of possible contribution of cells to our Raman spectra, we had to gently remove this top layer. After removing the top layer of cells according to the method described in §2, a network of fibres could be observed, which upon closer examination had a roughened surface (figure 4c,d). We selected locations free of cells and with abundant ECM for our Raman measurements. As a reference, although not exactly similar to native rat bone collagen type I, we measured biochemically purified bovine collagen type I obtained from tendons (commercially available from Sigma). The Raman spectra of ECM (figure 4a) show both bands belonging to carbonated apatite and bands belonging to protein, mainly collagen type I. The spectra obtained from ECM were comparable to spectra from mature bone. Raman imaging revealed that mineralization of the matrix was found to be heterogeneous (figure 4f), whereas in mature bone, this is found to be homogenous (figure 5a). XRMA of the same areas revealed the presence of calcium, phosphorus, carbon and oxygen, which confirms the data obtained by Raman spectroscopy (figures 5 and 6).
Figure 5.
(a) Electron micrograph of the surface of bone, showing a 15–20 μm microcrack and subsequent corresponding Raman images 50×50 μm (1 pixel=1 μm) of protein (1400–1440 cm−1, red square), (1070 cm−1, green square) and (960 cm−1, blue square); (b) XRMA maps for C, O, P and Ca, the area covered by the white square corresponds to the electron micrograph in (a). Scale bar in (a) represents 50 μm and in (b) 25 μm.
Figure 6.
XRMA spectra of (a) rat femoral bone and (b) ECM, all measurement parameters were kept the same (15 keV, spotsize 4, collection time 260 s, working distance 10 mm).
4. Discussion
In this study, we investigated the feasibility of combining CRS with SEM and report on the performance of this system on tissue engineered samples. Measurements of 2–10 μm diameter polystyrene beads showed that clear Raman spectra, with low signal-to-noise ratio can be obtained, which in turn can be used for chemical imaging. Investigation of thin layers of carbonated apatite, a major component of bone, on titanium alloy plates revealed the presence of Raman bands belonging to both and . SEM investigation of rat osteoprogenitor cells on titanium alloy plates after 14 days showed that ECM had formed and was composed of a network of fibres that have a mineralized appearance. Measurements taken from different spots of this matrix revealed that Raman bands belonging to , and protein could be found, which could not be deduced initially from XRMA data from the same sites. It is clear that, when comparing the ECM spectra to the spectra of CO3-AP coatings, pure collagen type I and the histological observations made by SEM, the extra bands in these spectra are mainly contributed by the presence of collagen type I in the ECM. This was also concluded in studies done on dentin (Kirchner & Edwards 1997; Wang & Spencer 2002), bone (Dopner et al. 2002; Tarnowski et al. 2002) and osteoblast cultures (Stewart et al. 2002), in which CRS showed similar bands for collagen as in our study. The spectra of pure collagen type I show differences in intensity of peaks when compared with the spectra of ECM. This can be explained by the fact that we measured biochemically purified protein as a standard, whereas the ECM also contains other proteins and inorganic components, each contributing to the total ECM spectrum. The amide III protein band position observed in both ECM (1270–1300 cm−1) and pure collagen type I (1242–1282 cm−1) spectra indicate that collagen type I in the ECM is likely to be in the form of a α-helical structure, while the purified collagen type I is probably more disordered and in an irregular form (Guan et al. 1991; Renugopalakrishnan et al. 1998; Barron et al. 2000; Carden et al. 2003), probably caused by the biochemical purification process of this material. Collagen type I is the major contributing protein to bone ECM, but it is certainly not the only one present in the matrix. It is well established that bone ECM also contains proteins, such as osteopontin, bone sialoprotein, bone morphogenic proteins, osteocalcin and many more, but in much lower amounts. The above-mentioned details, added to the fact that the amount and purified form are different, might explain the slight shape differences in the collagen type I specific peaks observed in figure 4. Interestingly, the ratio of the protein to phosphate group Raman band intensities seems to be higher in mature bone than in ECM. It is known that, during the development of bone, ECM deposition of carbonated apatite takes place before a collagen network can accumulate (Davies 1996, 1998); this probably explains the difference in ratio found in our study. High-resolution Raman imaging revealed that ECM contains areas that are more mineralized than others, caused by the distribution of collagen fibres and the presence of small spherical structures composed of carbonated apatite. Raman images and XRMA maps of mature bone on amide III, and revealed that the composition of bone is much more homogenous than ECM, possibly because in bone the ECM is compacted to a dense structure. Raman imaging of these surfaces showed that, with the increase in surface topography complexity, the interpretation of the generated Raman image becomes increasingly more difficult. The difficulty in analysis can be explained by the fact that the confocality of the system allows for so-called ‘optical sectioning’, meaning that scanning of the surface of a sample is done in one focal plane. The focal spot, in turn, has a certain measuring volume and, therefore, the appearance of an electron micrograph, which is a 3D observation, and a Raman micrograph, which is a 2D observation, can be slightly different. An example of this effect is shown in figure 2, where the edges of the polystyrene beads show clearly a lower intensity compared with the centre and also, to some extent, in the Raman micrographs shown of bone (figure 5). Therefore, the information in the Raman image not only reveals chemical, but also topographical data as well, more than could be found by XRMA (see figure 5), which adds to structural information obtained by SEM. Future research on in vivo bone formation using the above-mentioned combined technique can possibly reveal more detailed information on bone growth in defect areas; the data found in this study suggest that bone-forming cells start producing ECM resembling mature bone from an early time point. The use of CRS in a SEM can enlarge the field of applications of sample analysis by electron microscopy to a great extent. Although in this paper we investigated bone ECM, this application can also be used for other sample types where information about molecular composition is necessary. Newly, non-resonant Raman imaging of single cells has been used to map DNA and protein distributions in human cells (Uzunbajakava et al. 2003a,b). This revealed that protein distribution varies with cell type and that the presence of RNA inside the nucleus of HeLA cells could be detected for the first time. However, light microscopy used in these studies in order to study these distributions, is extremely limited as the physical properties of light limit the ultimate resolution for observation. Combining CRS with SEM as described in this manuscript could be interesting for studying intracellular processes, such as phagocytosis, cellular differentiation and apoptosis, while at the same time being able to study cell morphology with very high resolution at very high magnifications. Moreover, this technique allows one to pinpoint structures with submicron dimensions by SEM, and then subsequently analyse them by CRS. In addition, Raman imaging in combination with environmental SEM would allow one to image directly, without prior labelling of molecules of interest, while in the meantime maintaining the normal functioning of the cells.
Acknowledgments
This research is supported by the Dutch Technological Sciences Foundation (STW).
References
- Barrere F, Layrolle P, van Blitterswijk C.A, de Groot K. Biomimetic calcium phosphate coatings on Ti6AI4V: a crystal growth study of octacalcium phosphate and inhibition by Mg2+ and HCO3−. Bone. 1999;25:107S–111S. doi: 10.1016/s8756-3282(99)00145-3. [DOI] [PubMed] [Google Scholar]
- Barrere F, Layrolle P, van Blitterswijk C.A, de Groot K. Biomimetic coatings on titanium: a crystal growth study of octacalcium phosphate. J. Mater. Res. Mater. Med. 2001;12:529–534. doi: 10.1023/a:1011271713758. [DOI] [PubMed] [Google Scholar]
- Barron L, Hecht L, Blanch E.W, Bell A.F. Solution structure and dynamics of biomolecules from Raman optical activity. Prog. Biophys. Mol. Biol. 2000;73:1–49. doi: 10.1016/s0079-6107(99)00017-6. [DOI] [PubMed] [Google Scholar]
- Carden A, Rajachar R, Morris M, Kohn D. Ultrastructural changes accompanying the mechanical deformation of bone tissue: a Raman imaging study. Calcif. Tissue Int. 2003;72:166–175. doi: 10.1007/s00223-002-1039-0. [DOI] [PubMed] [Google Scholar]
- Davies J. In vitro modeling of the bone/implant interface. Anat. Rec. 1996;245:426–445. doi: 10.1002/(SICI)1097-0185(199606)245:2<426::AID-AR21>3.0.CO;2-Q. [DOI] [PubMed] [Google Scholar]
- Davies J. Mechanisms of endosseous integration. Int. J. Prosthodont. 1998;11:391–401. [PubMed] [Google Scholar]
- Dopner S, Muller F, Hildebrandt P, Muller R.T. Integration of metallic endoprotheses in dog femur studied by near-infrared Fourier-transform Raman microscopy. Biomaterials. 2002;23:1337–1345. doi: 10.1016/s0142-9612(01)00252-6. [DOI] [PubMed] [Google Scholar]
- Freeman J.J, Silva M.J. Separation of the Raman spectral signatures of bioapatite and collagen in compact mouse bone bleached with hydrogen peroxide. Appl. Spectrosc. 2002;56:770–775. [Google Scholar]
- Guan Y, Lewis E.N, Levin I.W. In: Raman spectroscopy. Pelletier M.J, editor. Blackwell Science Ltd; London: 1991. [Google Scholar]
- Kale S, Biermann S, Edwards C, Tarnowski C, Morris M, Long M.W. Three-dimensional cellular development is essential for ex vivo formation of human bone. Nat. Biotechnol. 2000;18:954–958. doi: 10.1038/79439. [DOI] [PubMed] [Google Scholar]
- Kirchner M.T, Edwards H.G.M. Ancient and modern specimens of human teeth: a Fourier transform Raman spectroscopic study. J. Raman Spectrosc. 1997;28:171–178. [Google Scholar]
- Maniatopoulos C, Sodek J, Melcher A. Bone formation in vitro by stromal cells obtained from bone marrow of young adult rats. Cell Tissue Res. 1988;254:317–330. doi: 10.1007/BF00225804. [DOI] [PubMed] [Google Scholar]
- Oghusi H, Dohi Y, Katuda T, Tamai S, Tabata S, Suwa Y. In vitro bone formation by rat marrow cell culture. J. Biomed. Mater. Res. 1992;32:333–340. doi: 10.1002/(SICI)1097-4636(199611)32:3<333::AID-JBM5>3.0.CO;2-T. [DOI] [PubMed] [Google Scholar]
- Ou-Yang H, Paschalis E, Mayo W, Boskey A, Mendelsohn R. Infrared microscopic imaging of bone: spatial distribution of . J. Bone Miner. Res. 2001;16:893–900. doi: 10.1359/jbmr.2001.16.5.893. [DOI] [PubMed] [Google Scholar]
- Penel G, Leroy G, Bres E. New preparation method of bone samples for Raman microspectroscopy. Appl. Spectrosc. 1998;52:312–313. [Google Scholar]
- Puppels G.J, de Mul F.F.M, Otto C, Greve J, Robert-Nicoud M, Arndt-Jovin D.J, Jovin T.M. Studying single living cells and chromosomes by confocal Raman microspectroscopy. Nature. 1990;347:301–303. doi: 10.1038/347301a0. [DOI] [PubMed] [Google Scholar]
- Rehman I, Smith R, Hench L, Bonfield W. Structural evaluation of human and sheep bone and comparison with synthetic hydroxyapatite by FT-Raman spectroscopy. J. Biomed. Mater. Res. 1995;29:1287–1294. doi: 10.1002/jbm.820291016. [DOI] [PubMed] [Google Scholar]
- Renugopalakrishnan V, Carreira L.A, Collette T.W, Dobbs J.C, Chandraksasan G, Lord R.C. Non-uniform triple helical structure in chick skin type I collagen on thermal denaturation: Raman spectroscopic study. Z. Naturforsch. C. 1998;53:383–388. doi: 10.1515/znc-1998-5-613. [DOI] [PubMed] [Google Scholar]
- Stewart S, Shea D.A, Tarnowski C.P, Morris M.D, Wang D, Franscheschi R, Lin D.L, Keller E. Trends in early mineralization of murine calvarial osteoblastic cultures: a Raman microscopic study. J. Raman Spectrosc. 2002;33:536–543. [Google Scholar]
- Tarnowski C.P, Ignelzi M.A, Jr., Morris M.D. Mineralization of developing mouse calvaria as revealed by Raman microspectroscopy. J. Bone Miner. Res. 2002;17:1118–1126. doi: 10.1359/jbmr.2002.17.6.1118. [DOI] [PubMed] [Google Scholar]
- Timlin J.A, Carden A, Morris M.D, Rajachar R.M, Kohn D.H. Raman spectroscopic imaging markers for fatigue-related microdamage in bovine bone. Anal. Chem. 2000;72:2229–2236. doi: 10.1021/ac9913560. [DOI] [PubMed] [Google Scholar]
- Uzunbajakava N, Lenferink A, Kraan Y, Volokhina E, Vrensen G, Greve J, Otto C. Nonresonant confocal Raman imaging of DNA and protein distribution in apoptotic cells. Biophys. J. 2003a;84:3968–3981. doi: 10.1016/S0006-3495(03)75124-8. [DOI] [PMC free article] [PubMed] [Google Scholar]
- Uzunbajakava N, Lenferink A, Kraan Y, Willekens B, Vrensen G, Greve J, Otto C. Nonresonant Raman imaging of protein distribution in single human cells. Biopolymers. 2003b;72:1–9. doi: 10.1002/bip.10246. [DOI] [PubMed] [Google Scholar]
- Walters M, Leung Y, Blumenthal N, LeGeros R.Z, Konsker K.A. A Raman and infrared spectroscopic investigation of biological hydroxyapatite. J. Inorg. Biochem. 1990;39:193–200. doi: 10.1016/0162-0134(90)84002-7. [DOI] [PubMed] [Google Scholar]
- Wang Y, Spencer P. Analysis of acid-treated dentin smear debris and smear layers using confocal Raman microspectroscopy. J. Biomed. Mater. Res. 2002;60:300–308. doi: 10.1002/jbm.10108. [DOI] [PubMed] [Google Scholar]
- Yamamoto N, Furuya K, Hanada K. Progressive development of the osteoblast phenotype during differentiation of osteoprogenitor cells derived from fetal rat calvaria: model for in vitro bone formation. Biol. Pharm. Bull. 2002;25:509–515. doi: 10.1248/bpb.25.509. [DOI] [PubMed] [Google Scholar]
- Yoshikawa T, Ohgushi H, Dohi Y, Davies J. Viable bone formation in porous hydroxyapatite: marrow cell-derived in vitro bone on the surface of ceramics. Biomed. Mater. Eng. 1997;7:49–58. [PubMed] [Google Scholar]


