Abstract
We investigate the interaction of hepatitis B virus capsids lacking a nuclear localization signal with nuclear pore complexes (NPCs) in permeabilized HeLa cells. Confocal and wide-field optical images of the nuclear envelope show well-spaced individual NPCs. Specific interactions of capsids with single NPCs are characterized by extended residence times of capsids in the focal volume which are characterized by fluorescence correlation spectroscopy. In addition, single-capsid-tracking experiments using fast wide-field fluorescence microscopy at 50 frames/s allow us to directly observe specific binding via a dual-color colocalization of capsids and NPCs. We find that binding occurs with high probability on the nuclear-pore ring moiety, at 44 ± 9 nm radial distance from the central axis.
INTRODUCTION
In eukaryotic cells, the nuclear envelope (NE) creates distinct nuclear and cytoplasmic compartments. Nuclear pore complexes (NPCs) form aqueous channels across the NE that mediate the trafficking of macromolecules between the nucleus and the cytoplasm. Many viruses depend on the host cell machinery and replicate in the nucleus. Infection involves transport of the virus or viral capsids to the nucleus, binding to the NPCs, and importing of the genome and accessory proteins through the NPC (1). Therefore, the study of virus-nucleus interactions is of importance for the basic understanding of virology and cell biology as well as for important technological applications, like gene therapy vector systems.
Hepatitis B virus (HBV) is a major human infectious pathogen that causes acute and chronic hepatitis and eventually hepatocellular carcinoma. Its capsid exhibits icosahedral symmetry and is built of 180 or 240 copies of a single, virally encoded core protein (2). The mechanism by which HBV cores are targeted and transported into the nucleus without disassembly has been of great interest, since its capsid diameter (∼35 nm) is close to the physical diameter (∼45 nm) of the NPC central pore (3–5). Previous bulk transport studies suggest that binding to and transport through the NPC is mediated by transport receptors called importins. The association with importin a has been shown to take place at the COOH-terminus of the HBV core protein, which harbors nuclear localization signal (NLS)-like amino acid sequences (6,7). However, cryoelectron microscopy has shown that the COOH-terminus is not surface exposed in capsids (2,7).
Single-particle-tracking experiments have recently gained substantial attention for their ability to trace specific interactions in living cells. Experiments with single particles have distinct advantages compared to ensemble experiments because they can: i), unravel dynamic processes at the molecular level taking place on various timescales without synchronizing the experiment; and ii), reveal the presence of subensembles in complex, heterogeneous systems (8–10). This is because, by definition, single-particle experiments avoid ensemble averaging. For example, properties of lipid membranes supported on solid substrates (11,12) or in living cells (13–17) have been investigated by single-molecule diffusion studies in the past. Also, viral infection pathways have been studied using single-molecule-labeled viruses to follow the entry of viruses into cells and their transport to the nucleus in real time (18). Furthermore, a study on nuclear trafficking of viral genes by single-particle tracking (19) showed heterogeneous interactions between the viral genes and NPCs with a large range of dissociation rate constants. Recently, single-molecule studies of the nuclear transport of a model protein substrate (20) and of nuclear transport receptors (21) have been performed.
Here, we apply single-molecule fluorescence techniques to investigate the interaction of single HBV core capsids with individual NPCs to study the initial steps of capsid import in detail. As a model system we have selected a recombinant HBV core capsid assembled from a 149-amino-acid version of its core capsid protein (22). The core capsid protein was COOH-terminally truncated to lack the NLS-like sequence and the phosphorylation sites. To render the capsids fluorescent, green fluorescent protein (GFP) was inserted into the immunodominant loop (amino acids 78–83) of the capsid protein. FCS and wide-field fluorescence microscopy are applied to study the interaction of single capsids with individual NPCs. In contrast to previous studies (20,21), we were able to suppress to a large extent the frequent transient nonspecific encounters of the capsids with the NE by single-capsid FCS and two-color colocalization of the NPCs and capsids. Thus, long-lasting specific binding events of single capsids to individual NPCs could be isolated. Our investigations reveal the capsids' capability to interact specifically with NPCs even in the absence of the COOH-terminal domain that is generally thought to harbor an NLS. This finding, in turn, suggests the occurrence of a direct HBV core capsid-NPC association that is not mediated by importins.
EXPERIMENTAL
Materials and methods
HBV-GFP core capsids
Cloning of a plasmid for the HBV core capsids tagged with GFP was performed as described previously (22). In brief, the sequence encoding the GFP was inserted in a parental PET15-derived plasmid containing the truncated HBV core protein (amino acids 1–149) in the immunodominant loop (amino acids 238–243). The HBV-GFP construct was overexpressed by transforming into Escherichia coli BL21 cells and purified using a Ni-loaded chelating sepharose column (GE Healthcare, München, Germany). This recombinant construct was chosen because it efficiently self-assembles into icosahedral capsids in the test tube (22). The resulting capsids are of two size classes, T = 3 (180 subunits) and T = 4 (240 subunits) (2), thus yielding fluorescent capsids tagged with either 180 or 240 copies of GFP. Capsid formation and size of the assembled particles were controlled by negative stain electron microscopy.
Cell culturing and immunocytochemistry
HeLa cells were cultured on glass coverslips in Dulbecco's Modified Eagle Medium supplemented with 10% fetal calf serum overnight. On the day of the experiment, the cells were permeabilized with digitonin (40 μg/ml). NPCs were labeled in transport buffer (20 mM Hepes, pH 7.3, 110 mM potassium acetate, 5 mM sodium acetate, 2 mM magnesium acetate, 1 mM EGTA, 2 mM dithiothreitol, 2% bovine serum albumin and proteases) with a monoclonal antibody, mAb414 (BABCO, Berkeley, CA), that recognizes the FG-repeat domain of the nucleoporins (23). The primary antibody was fluorescently labeled with a secondary Texas-Red-conjugated monoclonal antibody.
Single-molecule experiments
The HeLa cell cultures labeled with mAb414 were employed immediately for confocal or wide-field microscopy. The cells were kept at room temperature throughout the measurement. Directly before the experiment, the transport buffer was exchanged by a transport mixture containing the transport buffer, a HeLa cell cytosolic extract, ATP, creatine phosphokinase, and creatine phosphatase. HBV core capsids tagged with GFP were added at a concentration of ∼10−9 M, low enough for single-particle detection.
Microscopy methods
Confocal and wide-field microscopy setups
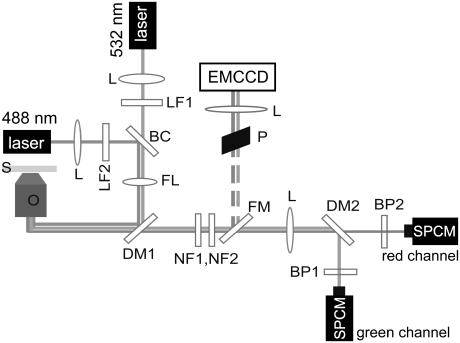
An epifluorescence microscope was arranged to perform both confocal and wide-field microscopy (Fig. 1). Two laser beams, one at 532 nm (ps-pulsed (pulse width 8 ps, repetition rate 80 MHz), frequency-doubled Nd:Van laser GE-100, Time-Bandwidth Products, Zurich, Switzerland), and one at 488 nm (Ar+-laser, SpectraPhysics, Mountain View, CA), were coupled into the back aperture of an oil immersion microscope objective (Nikon, Tokyo, Japan; ×100, 1.45 numerical aperture) using a suitable color beam splitter (505dclp, Chroma Technology, Brattleboro, VT). For wide-field microscopy, the illumination spot was widened to a diameter of ∼10 μm using a lens. The resulting fluorescent emission was collected by the same objective lens and passed through holographic notch filters before reaching a flipping mirror that enabled the switching of the detection pathway between a charge-coupled device camera (EMCCD, IXon, Andor, Ireland) and single-photon counting modules (SPCM-AQR-13, Perkin Elmer, Fremont, CA). After flipping the mirror the fluorescence is divided into a red and green part by a dichroic beamsplitter (545dclp, Chroma Technology) and filtered by respective band-pass filters (HQ510/20 and D605/50, Chroma Technology).
FIGURE 1.
Combination of a fluorescence scanning confocal optical microscope and a wide-field fluorescence microscope. The detection beam path can be switched by a flipping mirror. S, sample; O, objective; DM1, dichroic mirror; FL, flippable lens; BC, beam combiner (488/532pc, Chroma Technology); LF1, LF2, line filters; L, lens; P, periscope; NF1, NF2, notch filters; FM, flappable mirror; DM2, dichroic mirror; BP1, BP2, band-pass filters; SPCM, single-photon counting module.
Single capsids tracing
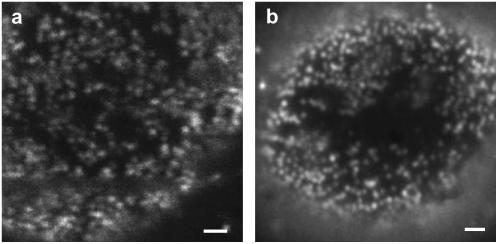
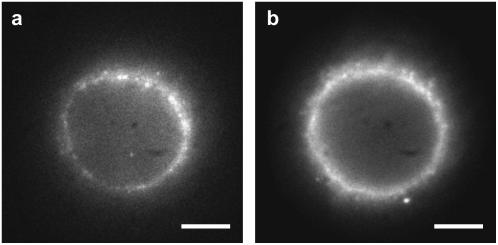
Series of fluorescence images of single HBV core capsids diffusing within the near field of individual NPCs were recorded continuously at 50 frames/s using the wide-field microscopy mode of the setup (see Fig. 1). The NPCs within the ventral plane of the NE were brought into focus (Fig. 2 b) by exciting the Texas red tagged antibodies bound to the NPCs with an average power of 1 mW at 532 nm. Acquisition of GFP emission from the diffusing HBV core capsids with an excitation power of 0.7 mW at 488 nm was started immediately after the ventral plane of the NE was in focus. In both cases, a spot ∼10 μm in diameter was illuminated, resulting in an excitation intensity of 0.9–1.3 kW/cm2. Series of single-molecule fluorescence images recorded by wide-field microscopy were analyzed using the software Igor Pro (WaveMetrics, Lake Oswego, OR). Within each image showing fluorescent NPCs, close encounters of NPCs with HBV core capsids, being possible candidates for binding events, were preselected if their peak-to-peak distance was <2 pixels (∼220 nm). The HBV core capsid image series with nearby NPCs were then analyzed to track down binding events. To determine the position, width, amplitude, and local background of spots representing either single NPCs or single HBV core capsids bound to the NE, an asymmetric two-dimensional Gaussian was fitted to a 7 × 7 pixel subregion of the images that contained the selected spot using the Levenberg-Marquardt algorithm. From the spatial positions of a capsid appearing in subsequent images, trajectories were obtained by standard procedures (11,24). In addition to the numerical values of the fit parameters, the nonlinear fit routine also provides estimates for the uncertainty of the parameters. Fits that resulted in positional errors relative to the spot size of >35% were discarded from further analysis. Spots and trajectories of HBV core capsids residing within a radius of 110 nm around a given NPC in the ventral NE were scored for colocalization. This distance criterion is based on the physical size of an NPC (5,25,26) including the length of the cytoplasmic filaments.
FIGURE 2.
Imaging of single NPCs at the ventral plane of NE by (a) scanning confocal optical microscope and (b) wide-field fluorescence microscope. Compared to scanning confocal optical microscopy, wide-field microscopy obviously suffers from a higher background while providing similar resolution. (scale bars, 1 mm).
Fluorescence correlation spectroscopy
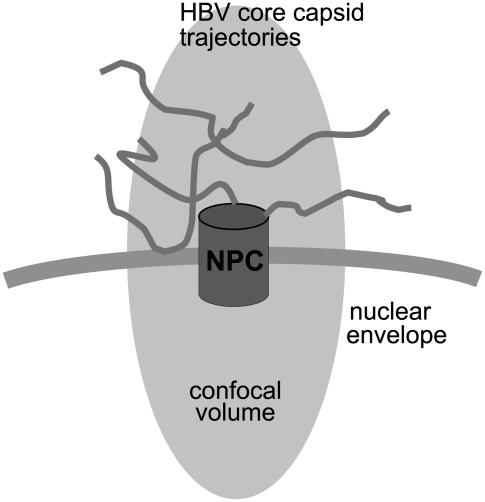
To perform fluorescence correlation spectroscopy (FCS) experiments at the positions of individual NPCs, in a first step, a confocal image of an NE was recorded using green excitation (1–2 μW, λ = 532 nm) showing the spatial positions of individual red fluorescent NPCs (see Fig. 2 a). Then a single, well-isolated NPC was positioned within the confocal volume and the excitation was switched to blue (1–2 μW, λ = 488 nm). Time traces revealing fluorescence intensity fluctuations in the green (GFP) channel due to diffusing GFP-tagged HBV core capsids were recorded for 200 s from that confocal volume. Autocorrelation functions of such fluorescence time traces were calculated offline. Rare specific binding events which presumably have longer durations than diffusive events are expected to be difficult to detect in such an analysis. This is due to the fact that a major fraction of the fluorescence fluctuation detected in the confocal volume stems from capsids that do enter the confocal volume but do not specifically interact with the NPC (see Fig. 4). To capture the occasional specific binding of an HBV core capsid to an NPC, the time traces were also analyzed by determining the length of the observed fluorescence bursts. To identify a burst as an event originating from the capsids, the average fluorescence intensity of the corresponding trace plus three times its standard deviation was taken as the threshold for the start of that burst. A burst was assumed to last until the signal fell under the average fluorescence intensity plus twice its standard deviation. By plotting histograms of burst durations, we are able to distinguish between long, specific and short, nonspecific events.
FIGURE 4.
FCS experiment. Scheme of the confocal volume positioned at the location of an NPC showing different possible causes for fluorescence bursts.
To ensure the positional stability of the NPCs surrounding the selected NPC, confocal images of the NPCs in a small area of ∼7 × 7 μm were acquired before and after recording a time series of a single NPC. Individual NPCs exhibited hardly any movement over the timescale of our experiment, consistent with a previous finding (27) and as expected for permeabilized cells. To monitor nonspecific binding of the GFP-tagged HBV core capsids to the nuclear membrane, the confocal volume was positioned at spots along the ventral area of the NE where no labeled NPCs were present. The cytoplasmic diffusion of HBV core capsids was monitored by focusing into the cytoplasm away from the nucleus.
Simulation of FCS measurements
To aid the interpretation of the FCS data, we performed Monte Carlo simulations employing NPCSim, developed for this investigation. Initially, HBV core capsid particles are distributed randomly in a 3 × 3 × 3 μm3 box. The box has a structure that constitutes a random distribution of obstacles to represent cytoplasm-containing components such as organelles, protein, and RNA with which the capsids may interact (see Fig. 6, insets). The energy of a capsid configuration is determined by its interaction with obstacles. The latter are represented by square-well potentials of depth V and width r (“valley” model) (28). The parameters V and r are assigned to each obstacle separately using a random number generator. Periodic boundary conditions are assigned to the x-z- and y-z-plane; reflective boundary conditions were implemented for the x-y-plane representing the NE where an NPC could be inserted. An NPC is treated as a single, separate obstacle modeled as a square-well potential with variable diameter and depth. During each time interval, Δt, the particles move in space by a distance, Δx, which is computed from a normal distribution representing random diffusion:
 |
(1) |
where D is the diffusion constant. However, the particle only moves by the distance Δx if it fulfills the Boltzmann criterion, i.e.,  , that forces the system in the canonical ensemble at a constant temperature. Here, ΔE is the energy difference between the previous and actual capsid position and
  is the probability that the trial move is accepted. If a random number is smaller than
  , the move is performed, but if it is larger than
  , the move is rejected and the capsid remains in its actual position.
FIGURE 6.
Simulation of FCS experiment. Histograms of lengths of fluorescence bursts. Identical to the plots in Fig. 5, the plots in panels a and c are fitted by an exponential decay, whereas the plot in b is fitted by a double-exponential decay, with one decay rate retained fixed with the value obtained in panel a. The decay rates obtained are (a)  , (b)
, (b)  and
and  , and (c)
  . Sketches of the simulated structure for each situation are shown as insets.
The confocal volume of the FCS configuration was modeled by a three-dimensional Gaussian. Consequently, the intensity of the fluorescence signal of a given HBV core capsid particle is calculated by
 |
(2) |
where r0 and z0 are the radial and axial beam waists, respectively.
We used a diffusion constant D that was obtained from FCS studies in the cytoplasm. Unknown parameters such as the density of capsids and obstacles, the maximum capsids-obstacles interaction, and the maximum depth of the square-well potential of the obstacles representing the cytoplasm were also adjusted in such a way as to obtain an event-length distribution similar to that obtained from the control experiments.
RESULTS AND DISCUSSION
HBV core capsids accumulate at the NE
Fig. 3 a shows a wide-field image of the cell nucleus in a permeabilized HeLa cell showing a large number of labeled NPCs. A band-pass filter (D605/50, Chroma Technology) has been used in the detection path. Fig. 3 b displays the corresponding ensemble wide-field image showing green GFP fluorescence originating from GFP-labeled HBV core capsids after 30 min incubation. Interestingly, although lacking an NLS, these capsids accumulate at the NE. Previous investigations by fluorescent microscopy in HeLa cells and by electron microscopy in Xenopus oocytes have revealed that recombinant HBV core capsids, both assembled from phosphorylated full length as well as from truncated HBV core capsid protein, while being excluded from the nucleus, accumulate at the cytoplasmic periphery of the NPCs and within their central channel and nuclear basket (3,4). Control experiments using unlabeled NPCs yielded results indistinguishable from Fig. 3 b.
FIGURE 3.
Accumulation of HBV core capsids at the NE. Wide-field images of (a) mAb414 antibody-labeled NPCs and (b) GFP-HBV core capsids accumulated at the NE. (scale bars, 5 mm).
Capsid-NPC interaction studied with confocal microscopy and computer simulations
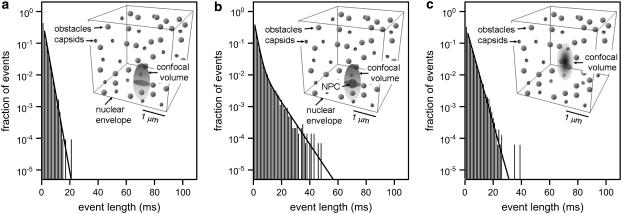
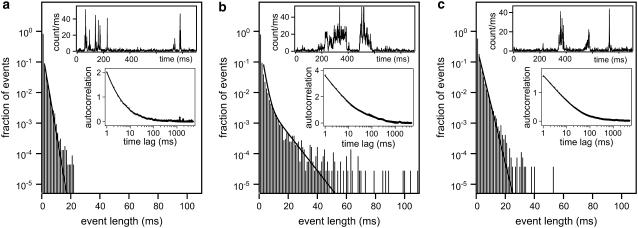
Single HBV core capsid binding events to individual NPCs were detected by overlapping the confocal volume with a single NPC in the NE (see Fig. 4) and the subsequent recording of fluorescence time traces. Considering the size of the confocal volume with radial and axial beam waists of ∼250 nm and 750 nm, respectively, only a few fluorescence bursts are expected to be events that reflect capsids-NPC interaction. To distinguish those bursts from those of the freely diffusing capsids, as references, we have also recorded fluorescence time traces i) in the cytoplasm away from the nucleus, and ii) at the NE with no NPC present (see insets of Fig. 5, a and c). To discriminate the few specific binding events among a vast number of nonspecific diffusion events, the durations of individual bursts were determined. Histograms of burst durations are shown in Fig. 5, a–c, corresponding to different sites in digitonin-permeabilized HeLa cells. Fluorescence bursts from HBV core capsids can be due to i) ‘free’ diffusion through the confocal volume, ii) collision or interaction with the NE, or iii) interaction with an NPC. On average, the fluorescence bursts are longer for freely diffusing capsids in the cytoplasm (Fig. 5 c) than for capsids diffusing close to the NE (Fig. 5 a). This is due to a significant reduction in the effective cytoplasmic volume available to the capsids in the presence of the NE (see Fig. 4). However, if the NE residing in the confocal volume contains an NPC, very long-lasting fluorescence bursts start to noticeably contribute above the background of ‘free’ diffusion events as shown in Fig. 5 b. Such longer lasting fluorescence bursts (Fig. 5 b, inset) are clearly distinguishable in the time traces from the events detected in the absence of an NPC either with (Fig. 5 a, inset) or without (Fig. 5 c, inset) the NE. Fitting an exponential curve to the histogram of burst width recorded in the cytoplasm without the NE (Fig. 5 c) yields a typical burst duration of  . If the NE is in the confocal volume but there is no NPC present (Fig. 5 a), the fit yields a faster decay with a time constant
  , as expected. If an NPC is present in the confocal volume, the character of the histogram of burst width changes. Now a second decay rate,
  obtained by employing a sum of two exponential curves, is necessary to obtain a satisfactory fit, as shown in Fig. 5 b. The second exponential decay characterizes the longer specific capsid-NPC binding events.
FIGURE 5.
FCS experiment. Histograms of lengths of fluorescence bursts where the confocal volume is placed (a) at the NE without an NPC, (b) at the NE in the presence of NPC, and (c) in the cytoplasm away from the nucleus. The plots in panels a and c are fitted by an exponential decay. The plot in b is fitted by a double-exponential decay, with one decay rate retained fixed with the value obtained in panel a. The insets display the respective autocorrelation curves fitted by an anomalous diffusion model. Portions of time traces showing representative events are also shown as insets.
Autocorrelation analysis of the fluorescence time traces was also performed. The fluorescence time traces recorded in confocal volumes not harboring any NPC exhibit anomalous diffusion behavior, such as described by  where
where  is an anomalous diffusion coefficient and
  is an anomalous diffusion exponent characterizing the dependence of the mean-square displacement of the particle on time. For fluorescence time traces recorded in the cytoplasm away from the nucleus,
  and
and  were determined (Fig. 5 c, inset), whereas for fluorescence time traces recorded at the NE without NPC,
  and
and  were obtained (Fig. 5 a, inset). The evidently faster diffusion indicated by
  found for capsids residing in a confocal volume placed near the NE is again consistent with the reduced effective cytoplasmic volume mentioned above. The degree of anomalous diffusion represented by
  is similar for both cases. The autocorrelation function obtained from the experiments with an NPC yields a significant increase in the degree of anomalous diffusion,
  . This suggests that the presence of an NPC in the confocal volume creates additional interaction with the capsids. The anomalous diffusion coefficient obtained from the fit is reduced to
  compared to the case without NPC at the NE. Although the actual values from the fits do not describe the effect of the presence of an NPC quantitatively since the autocorrelation functions average all the bursts detected as fluorescence intensity fluctuations, the effect on
  (namely on the dependence of the mean-square displacement of the capsids on time) indeed indicates a specific interaction between NPCs and capsids.
A simulation of the experimental system was performed to investigate the effect of the presence of the NE and an NPC in the confocal volume. A simplified system to mimic the confocal volume in the experiment as described in Materials and Methods was used to produce fluorescence time traces. Histograms of burst lengths obtained for the three situations: a), at the NE but without an NPC, b), at the NE with an NPC, and c), in the cytoplasm, are shown in Fig. 6. The observed behavior is consistent with the experiments.
Capsid-NPC interaction visualized by wide-field microscopy
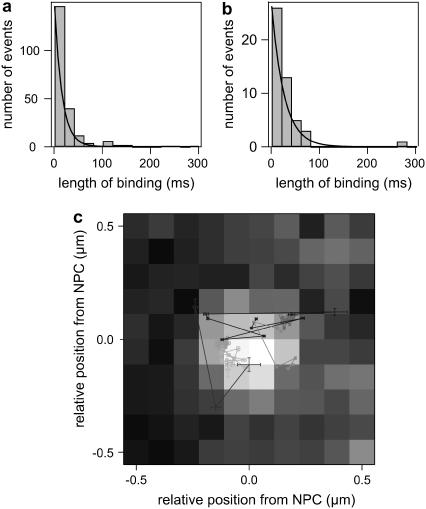
We have performed wide-field microscopy to follow the movement of individual capsids in the vicinity of NPCs and to directly visualize their interaction with an NPC by dual-color colocalization. From series of HBV core capsid fluorescent images recorded at a rate of 50 frames/s, the duration of binding events was obtained for events colocalizing with an NPC and at positions without NPCs at the ventral plane of the NE. The histograms of such binding event lengths at the NE are shown in Fig. 7, a and b. Capsid binding events were determined as follows: a continuous series of capsid images were pooled out, during which the peak-to-peak distance of a capsid and an NPC remained within a range corresponding to the physical geometry of an NPC including the length of its cytoplasmic filaments. The binding events, on the other hand, were considered as nonspecific if they occurred without any labeled NPC in the vicinity. Fitting of exponentials to the histograms of binding event durations indicates a longer average duration of binding events at the position of NPCs (Fig. 7 b,  ) compared to the case where no NPC is present (Fig. 7 a,
  ).
).
FIGURE 7.
Wide-field microscopy. HBV core capsid interaction with NE was traced in HeLa cells with antibody-labeled NPCs by obtaining sequential images at 50 frames/s. Histograms of lengths of HBV core capsid-NPC interactions during which (a) capsids bound to NE without colocalization with clearly resolved NPC and (b) capsids colocalized with an NPC. Capsids bound within a radius of 110 nm from an NPC signal are considered to have colocalized. (c) Several trajectories of capsids around NPCs overlapped to a sum of original NPC signals corresponding to the trajectories.
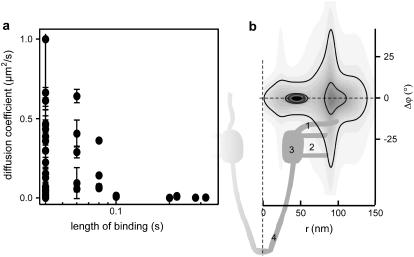
We have analyzed in detail the movement of the HBV core capsids around NPC during the interactions. A few examples of trajectories constructed from the series of HBV core capsid fluorescent images overlaid with the sum of corresponding NPC images are shown in Fig. 7 c. Two main groups are found: trajectories with higher mobility tend to exhibit shorter lengths of the binding event and long trajectories tend to be strongly confined. A plot of diffusion coefficient versus length of binding event in Fig. 8 a shows this trend. We have constructed the probability density distribution for the position of the capsid binding events with respect to the central axis of NPCs (Fig. 8 b) in polar coordinates r and φ. To this end the positions of capsids within each trace have been used to calculate an average distance and angle as well as the respective standard deviations. Since the NPC is rotationally symmetric we disregard the absolute angular coordinate and project all angles to φ = 0. The resulting probability density distribution shows two major contributions: 1), a confined peak both in radial (±9 nm) and angular (±2°) directions ∼44 nm from the central axis, and 2), another peak that is much weaker and shows a large spread both in radial (±16 nm) and angular (±22°) directions ∼93 nm from the central axis. Comparison of this probability density distribution to the dimension of an NPC (Fig. 8 b) shows that the first type of binding events coincides with the ring moiety of the NPCs and the second is consistent with interactions of capsids with the cytoplasmic filaments. The correlation between the length and the position of binding events and the nature of capsid movements at the NPCs must be further investigated, for instance, for any relevance to distinction between interactions that lead to an import from interactions that fail to lead to an import.
FIGURE 8.
Movement of HBV core capsids around NPC observed by dual-color wide-field microscopy. (a) Diffusion coefficients versus duration of HBV core capsid-NPC interactions. (b) Probability density distribution for the position of the capsid binding events with respect to the central axis of NPCs in polar coordinates r and φ determined from 23 binding events that lasted at least 2 frames. Distance between contours, 1′10−4. A sketch of the NPC (see Fahrenkrog et al. (29)) is aligned to the probability density plot. The highest probability for capsid binding is found for distances of 44 ± 9 nm from the central axis of an NPC. Bindings at larger distances occur with much lower probability. 1, cytoplasmic filaments; 2, luminal domain; 3, ring moiety; 4, nuclear basket.
CONCLUSION
We have combined confocal FCS at a high temporal resolution with direct particle tracking experiments in a cellular context to elucidate the interactions between diffusing HBV core capsids and NPCs. FCS experiments show that there is a specific interaction between the HBV core capsids and the NPCs that lasts longer than nonspecific interaction between the HBV core capsids and the nuclear membrane. To visualize the single-particle interaction events directly, we have employed wide-field microscopy with dual-color colocalization. We find that by far the most probable binding site of capsids at the NPC is located 44 ± 9 nm from the central axis of the NPC, coinciding with the NPC ring moiety. Transient interactions at larger distances are also observed that might be attributed to capsids captured by the cytoplasmic filaments.
Acknowledgments
The authors gratefully acknowledge H.-J. Güntherodt for his continuous support, A. Lieb for stimulating discussions, and C. A. Schönenberger for help generating the HBV core capsid-GFP construct.
We also gratefully acknowledge financial support from the Swiss National Science Foundation via the National Center of Competence in Research in Nanoscale Science, a research grant (B.F.), and a research professorship (B.H.) as well as from the M. E. Müller Foundation (U.A.), and the Kanton Basel Stadt (B.F.).
References
- 1.Adam, S. A., R. S. Marr, and L. Gerace. 1990. Nuclear protein import in permeabilized mammalian cells requires soluble cytoplasmic factors. J. Cell Biol. 111:807–816. [DOI] [PMC free article] [PubMed] [Google Scholar]
- 2.Crowther, R. A., N. A. Kiselev, B. Bottcher, J. A. Berriman, G. P. Borisova, V. Ose, and P. Pumpens. 1994. Three-dimensional structure of hepatitis B virus core particles determined by electron cryomicroscopy. Cell. 77:943–950. [DOI] [PubMed] [Google Scholar]
- 3.Panté, N., and M. Kann. 2002. Nuclear pore complex is able to transport macromolecules with diameters of ∼39 nm. Mol. Biol. Cell. 13:425–434. [DOI] [PMC free article] [PubMed] [Google Scholar]
- 4.Rabe, B., A. Vlachou, N. Panté, A. Helenius, and M. Kann. 2003. Nuclear import of hepatitis B virus capsids and release of the viral genome. Proc. Natl. Acad. Sci. USA. 100:9849–9854. [DOI] [PMC free article] [PubMed] [Google Scholar]
- 5.Stoffler, D., B. Feja, B. Fahrenkrog, J. Walz, D. Typke, and U. Aebi. 2003. Cryo-electron tomography provides novel insights into nuclear pore architecture: implications for nucleocytoplasmic transport. J. Mol. Biol. 328:119–130. [DOI] [PubMed] [Google Scholar]
- 6.Kann, M., B. Sodeik, A. Vlachou, W. H. Gerlich, and A. Helenius. 1999. Phosphorylation-dependent binding of hepatitis B virus core particles to the nuclear pore complex. J. Cell Biol. 145:45–55. [DOI] [PMC free article] [PubMed] [Google Scholar]
- 7.Steven, A. C., J. F. Conway, N. Cheng, N. R. Watts, D. M. Belnap, A. Harris, S. J. Stahl, and P. T. Wingfield. 2005. Structure, assembly, and antigenicity of hepatitis B virus capsid proteins. Adv. Virus Res. 64:125–164. [DOI] [PubMed] [Google Scholar]
- 8.Basché, T., W. E. Moerner, M. Orrit, and U. P. Wild, editors. 1999. Single-Molecule Optical Detection, Imaging and Spectroscopy. VCH, Weinheim, Germany.
- 9.Rigler, R., M. Orrit, and T. Basché, editors. 2001. Single Molecule Spectroscopy. Springer Series in Chemical Physics. Springer, Berlin.
- 10.Special issue. 1999. Frontiers in chemistry: single molecules. Science. 283:1667. [Google Scholar]
- 11.Schmidt, Th., G. J. Schütz, W. Baumgartner, H. J. Gruber, and H. Schindler. 1996. Imaging of single molecule diffusion. Proc. Natl. Acad. Sci. USA. 93:2926–2929. [DOI] [PMC free article] [PubMed] [Google Scholar]
- 12.Schütz, G. J., G. Kada, V. P. Pastushenko, and H. Schindler. 2000. Properties of lipid microdomains in a muscle cell membrane visualized by single molecule microscopy. EMBO J. 19:892–901. [DOI] [PMC free article] [PubMed] [Google Scholar]
- 13.Lommerse, P. H. M., G. A. Blab, L. Cognet, G. S. Harms, B. E. Snaar-Jagalska, H. P. Spaink, and Th. Schmidt. 2004. Single-molecule imaging of the H-Ras membrane-anchor reveals domains in the cytoplasmic leaflet of the cell membrane. Biophys. J. 86:609–616. [DOI] [PMC free article] [PubMed] [Google Scholar]
- 14.Sako, Y., S. Minoguchi, and T. Yanagida. 2000. Single-molecule imaging of EGFR signalling on the surface of living cells. Nat. Cell Biol. 2:168–172. [DOI] [PubMed] [Google Scholar]
- 15.Sako, Y., and T. Yanagida. 2003. Single-molecule visualization in cell biology. Nat. Rev. Mol. Cell Biol. 4:SS1–SS5. [PubMed] [Google Scholar]
- 16.Schütz, G. J., J. Hesse, G. Freudenthaler, V. Ph. Pastushenko, H.-G. Knaus, B. Pragl, and H. Schindler. 2000. 3D mapping of individual ion channels on living cells. Single Mol. 1:153–157. [Google Scholar]
- 17.Vrljic, M., S. Y. Nishimura, S. Brasselet, W. E. Moerner, and H. M. McConnell. 2002. Translational diffusion of individual class II MHC membrane proteins. Biophys. J. 83:2681–2692. [DOI] [PMC free article] [PubMed] [Google Scholar]
- 18.Seisenberger, G., M. U. Ried, Th. Endreß, H. Büning, M. Hallek, and C. Braüchle. 2001. Real-time single-molecule imaging of the infection pathway of an adeno-associated virus. Science. 294:1929–1932. [DOI] [PubMed] [Google Scholar]
- 19.Babcock, H. P., C. Chen, and X. Zhuang. 2004. Using single-particle tracking to study nuclear trafficking of viral genes. Biophys. J. 87:2749–2758. [DOI] [PMC free article] [PubMed] [Google Scholar]
- 20.Yang, W., J. Gelles, and S. M. Musser. 2004. Imaging of single-molecule translocation through nuclear pore complexes. Proc. Natl. Acad. Sci. USA. 101:12887–12892. [DOI] [PMC free article] [PubMed] [Google Scholar]
- 21.Kubitscheck, U., D. Grünwald, A. Hoekstra, D. Rohleder, T. Kues, J. P. Siebrasse, and R. Peters. 2005. Nuclear transport of single molecules: dwell times at the nuclear pore complex. J. Cell Biol. 168:233–243. [DOI] [PMC free article] [PubMed] [Google Scholar]
- 22.Kratz, P. A., B. Böttcher, and M. Nassal. 1999. Native display of complete foreign protein domains on the surface of hepatitis B virus capsids. Proc. Natl. Acad. Sci. USA. 96:1915–1920. [DOI] [PMC free article] [PubMed] [Google Scholar]
- 23.Davis, N. L., G. Wertz, M. Schubert, and R. A. Lazzarini. 1985. Role of the nucleocapsid protein in regulating vesicular stomatitis virus RNA synthesis. Heinz Arnheitera. Cell. 41:259–267. [DOI] [PubMed] [Google Scholar]
- 24.Kusumi, A., Y. Sako, and M. Yamamoto. 1993. Confined lateral diffusion of membrane receptors as studied by single particle tracking (nanovid microscopy). Effects of calcium-induced differentiation in cultured epithelial cells. Biophys. J. 65:2021–2040. [DOI] [PMC free article] [PubMed] [Google Scholar]
- 25.Beck, M., F. Förster, M. Ecke, J. M. Plitzko, F. Melchior, G. Gerisch, W. Baumeister, and O. Medalia. 2004. Nuclear pore complex structure and dynamics revealed by cryoelectron tomography. Science. 306:1387–1390. [DOI] [PubMed] [Google Scholar]
- 26.Fahrenkrog, B., E. C. Hurt, U. Aebi, and N. Panté. 1998. Molecular architecture of the yeast nuclear pore complex: localization of Nsp1p subcomplexes. J. Cell Biol. 143:577–588. [DOI] [PMC free article] [PubMed] [Google Scholar]
- 27.Daigle, N., J. Beaudouin, L. Hartnell, G. Imreh, E. Hallberg, J. Lippincott-Schwartz, and J. Ellenberg. 2001. Nuclear pore complexes form immobile networks and have a very low turnover in live mammalian cells. J. Cell Biol. 154:71–84. [DOI] [PMC free article] [PubMed] [Google Scholar]
- 28.Saxton, M. J. 1996. Anomalous diffusion due to binding: a Monte Carlo study. Biophys. J. 70:1250–1262. [DOI] [PMC free article] [PubMed] [Google Scholar]
- 29.Fahrenkrog, B., J. Köser, and U. Aebi. 2004. The nuclear pore complex: a jack of all trades? Trends Biochem. Sci. 29:175–182. [DOI] [PubMed] [Google Scholar]


