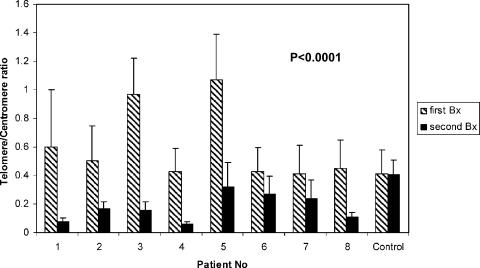
Figure 2.
Q-FISH analysis of telomere length. The y-axis represents telomere divided by centromere fluorescent intensity. Telomere intensity was reduced in the second surgery as compared to the first surgery in all patients, but not in the normal brain control. P value was calculated for 30 cells from the first tumor biopsy compared with the same number from the second tumor biopsy, per patient.

