

Abstract
PURPOSE Medicaid programs in all 50 states recently implemented cost-saving strategies, including benefit reductions, cost sharing, and tightened administrative rules. These changes resulted in loss of insurance coverage for thousands of low-income adults nationwide. In this study we assessed the immediate impacts of disrupted and lost Medicaid coverage on adults enrolled in the Oregon Health Plan (OHP) when program changes were implemented.
METHODS Data come from baseline survey results of a prospective cohort study designed to assess the impacts of OHP changes on adult beneficiaries. We used bivariate and multivariate analyses to examine the effects of disrupted and lost insurance coverage on unmet health care needs, utilization, and medical debt occurring in the first 10 months after OHP changes were implemented.
RESULTS After OHP changes were implemented, 31% of enrolled adults reported losing coverage, and another 15% reported disrupted coverage. Controlling for demographic characteristics, income, and health status, those with disrupted coverage were less likely to have a primary care visit (odds ratio [OR] = .66; P <.05) and more likely to report unmet health care needs (OR = 1.85; P <.01) and medical debt (OR = 1.99; P <.01) when compared with those continuously insured. Those who lost coverage were less likely to have a primary care visit (OR = 0.18; P <.01) and more likely to report unmet health care needs (OR = 5.55; P <.01), unmet medication needs (OR = 2.05; P <01), and medical debt (OR = 3.06; P <.01) than those continuously insured.
CONCLUSIONS Medicaid program changes that increase cost sharing and limit enrollment have significant negative impacts on health care access and utilization among Medicaid beneficiaries; these impacts occur rapidly, within the first 10 months after changes.
Keywords: Medicaid, insurance coverage, health care access, delivery of health care, organization and administration
INTRODUCTION
Medicaid plays a major role in ensuring access to care for more than 50 million low-income Americans. A growing body of research shows that the expansion of Medicaid programs during the last 2 decades resulted in improved health care access for millions of low-income adults and children.1–5 During the recent economic downturn, however, all 50 states implemented cost-containment strategies affecting millions of Medicaid beneficiaries nationwide.6 For example, in 2004, 19 states reduced benefits, including those for vision, dental, and mental health; 21 states restricted eligibility by tightening administrative rules or expanding premiums; and 20 states expanded or added co-payments.1 Recent research examining the impacts of Medicaid changes suggests that several states reported declining enrollment after the implementation of program changes.7
Losing public insurance coverage has serious consequences for low-income adults. Most who lose Medicaid coverage do not have access to other health insurance and become uninsured.1,8–10 Abundant literature shows that uninsured persons, especially those with low incomes, are more likely to have unmet health care needs and poorer health than those with insurance. In contrast, persons with insurance and a usual source of care have better access to care and better overall health outcomes.9–22
Most research examining the impact of uninsurance on low-income populations compares uninsured with insured populations or assesses the impact of lost coverage after a 1- to 2-year period.23,24 There is very little information about the more immediate effects of lost coverage on low-income adults enrolled in Medicaid.
Recent Changes in the Oregon Health Plan
In March 2003, Oregon implemented cost-containment mechanisms in the Oregon Health Plan (OHP). Oregon developed OHP2, which comprised 2 distinct Medicaid benefit packages: OHP Plus and OHP Standard. OHP Plus serves the categorically eligible Medicaid population (families receiving Temporary Assistance for Needy Families and disabled adults) and remained largely unchanged. OHP Standard covers the expanded eligibility population (low-income single adults and couples with no children) and included several changes. First, premiums and co-payments were increased. The amount of sliding-scale premiums remained the same for single persons but doubled for couples, with the new monthly premiums ranging from $6 to $20 per person. Groups with previous premium exemptions, including the homeless and those with no income, were also required to pay premiums. Second, certain benefits, including behavioral health services, dental services, durable medical equipment, and vision services, were eliminated. Finally, a 6-month lockout was instituted for members who missed a monthly premium payment.
To help understand the impact of these changes on OHP beneficiaries, a 3-year cohort study was launched in 2003 with the intention of observing a representative sample of the Oregon Medicaid population for 3 years. The objectives of the ongoing study are to assess the short and long-term impact of policy changes on individuals’ insurance coverage, access to and utilization of health care, family finances, and health status.
The findings presented here describe the short-term impacts of lost or disrupted coverage on health care access, utilization, and financial outcomes. Three groups of adults are compared for the 8- to 10-month period immediately after the OHP program changes: persons with stable insurance coverage, those who lost coverage but regained insurance before the end of the study period, and those who lost coverage and remained uninsured.
METHODS
Study Population
The study population included adults aged 19 years and older who were enrolled in the OHP for at least 30 days before program changes were implemented in the OHP Standard population. A stratified random sample of 10,600 potential cohort members was drawn from Medicaid eligibility files, divided evenly between adults in OHP Standard and OHP Plus. Oversampling was used to ensure adequate representation of African American, Native American, and Hispanic adults. After excluding those who had died, had moved out of state, or had no current address, 8,260 persons were eligible for panel recruitment.
We recruited study participants using multiwave mail methods, with reminder cards and a second request sent to nonrespondents. A total of 2,783 adults responded and became part of the panel, for a response rate of 34%. The research protocol was approved by Portland State University’s Human Subjects Research Review Committee.
Data Collection
An unique survey instrument was designed to assess insurance status, heath care access, utilization, and financial and health outcomes. The instrument was created using widely accepted data collection tools, including the Consumer Assessment of Health Plans (CAHPS) survey, the Community Tracking Study, and the SF-12 health assessment instrument.25–27 Cognitive pretesting of the survey instrument was conducted with a small sample of OHP members who agreed to participate in a validation interview. Spanish language survey instruments were translated and then independently back-translated to ensure fidelity. Survey instruments were mailed between November 2003 and January 2004, approximately 8 to 10 months after the policy changes were implemented in March 2003. To minimize recall bias, the survey instrument asked respondents about their experiences in “the last 6 months.”
Principal Measures
Coverage Pattern
Based on responses to a set of insurance status questions, respondents were placed into 1 of 3 groups. The stable coverage group comprised those who remained continuously enrolled in OHP after the program redesign and were still enrolled in OHP at the time of the survey. The disrupted coverage group comprised those who left OHP after the redesign, but returned to OHP or found other insurance by the time of the initial survey. The lost coverage group comprised those who left OHP after the redesign and remained uninsured at the time of the survey.
Access to Care
Unmet need was the principal measure of access. Respondents were asked whether, at any time in the past 6 months, they needed care but failed to receive it. Respondents were also asked whether they were unable to afford needed prescription medications at any time in the last 6 months.
Health Care Utilization
Respondents were asked how many times they had a visit with a clinician, excluding hospitals and emergency departments, in the preceding 6 months. They were also asked how many times they had visited a hospital emergency department in the previous 6 months. Responses to each question were collapsed into 2 categories: those with no visits, and those with at least 1 visit.
Financial Impacts
Respondents were asked to estimate how much money they currently owed health care providers, credit cards, or other loan companies for medical expenses. Responses were collapsed into 2 categories: those owing less than $500, and those owing $500 or more in medical debt.
Analyses
Statistical tests were performed using SPSS version 13.0; χ2 tests of independence were conducted to assess associations between insurance status and access to health care and medications, utilization, and medical debt.
To assess the net effect of insurance status on outcomes, we used multivariate logistic regression to estimate the relative odds of each outcome while controlling for age, sex, race, language, education, income as a percentage of federal poverty level, self-reported health status, and chronic illness. We defined respondents as chronically ill if they reported any of the following conditions: diabetes, asthma, congestive heart failure, chronic obstructive pulmonary disease, or hypertension.
RESULTS
Insurance Status
A total of 2,783 adult OHP beneficiaries returned survey instruments (34% response rate). Although demographic characteristics of the study sample were similar to those of the OHP population, respondents were more likely to be female, white, and English-speaking than nonrespondents, as shown in Table 1 ▶. Because program changes were implemented only in OHP Standard, analyses are limited to this population. A total of 1,378 OHP Standard enrollees returned baseline survey instruments. Of those responders, 95% (n = 1,300) reported their insurance status and are thus included in the analyses. African Americans, Hispanics, and individuals with less than a high school education were significantly less likely to report insurance information. There were no differences by age, sex, income, or health status.
Table 1.
Comparison of Study Respondents with Eligible Sample
| Demographic Characteristics | Eligible OHP Sample n = 8,260 % | Study Respondents n = 2,783 % |
| Sex, female* | 60.6 | 67.3 |
| Race/ethnicity* | ||
| Asian | 3.5 | 2.1 |
| African American | 10.0 | 8.1 |
| Hispanic | 14.1 | 11.4 |
| Native American/American Indian | 9.5 | 9.3 |
| White | 62.8 | 69.1 |
| Primary language* | ||
| English | 87.9 | 92.1 |
| Spanish | 7.6 | 5.9 |
| Other | 4.5 | 1.7 |
| Eligibility category | ||
| OHP Plus | 51.6 | 50.5 |
| OHP Standard | 48.4 | 49.5 |
OHP = Oregon Health Plan.
* P <.05.
In the first 10 months after OHP changes were implemented, 55% (n = 712) of OHP Standard cohort members reported maintaining stable coverage, 14% (n = 183) reported disrupted coverage (left OHP, but regained coverage), and 31% (n = 405) reported lost coverage (left OHP and remained uninsured). Demographic characteristics of each group are displayed in Table 2 ▶. Those who reported disrupted or lost coverage were younger, more likely to be male, white, and in the highest income group (100% of federal poverty level). Those with stable coverage were more likely to be Native American, have very low or no incomes, and have a chronic illness compared with those who had disrupted or lost coverage.
Table 2.
Sample Characteristics by Insurance Status
| Demographic Characteristic | Stable Coverage (n = 712) % | Disrupted Coverage (n = 183) % | Lost Coverage (n = 405) % |
| Mean age, y* | 42 | 38 | 39 |
| Sex† | |||
| Female | 67 | 58 | 60 |
| Male | 33 | 42 | 40 |
| Total | 100 | 100 | 100 |
| Race/ethnicity* | |||
| White (non-Hispanic) | 67 | 71 | 72 |
| Black (non-Hispanic) | 5 | 5 | 7 |
| American Indian/Alaskan Native (non-Hispanic) | 12 | 9 | 4 |
| Other (non-Hispanic) | 5 | 3 | 6 |
| Hispanic | 11 | 12 | 11 |
| Total | 100 | 100 | 100 |
| Primary language | |||
| English | 92 | 92 | 95 |
| Spanish | 8 | 8 | 5 |
| Total | 100 | 100 | 100 |
| Education | |||
| > High school | 45 | 54 | 46 |
| High school/GED | 35 | 29 | 36 |
| < High school | 20 | 17 | 18 |
| Total | 100 | 100 | 100 |
| Income as percentage of FPL* | |||
| 100+ | 8 | 18 | 20 |
| 26–100 | 45 | 55 | 39 |
| 1–25 | 23 | 14 | 20 |
| 0 | 18 | 10 | 15 |
| Not reported | 6 | 3 | 6 |
| Total | 100 | 100 | 100 |
| Health status | |||
| Very good, excellent | 21 | 28 | 22 |
| Good | 34 | 37 | 37 |
| Fair, poor | 45 | 35 | 41 |
| Total | 100 | 100 | 100 |
| Any chronic illness† | |||
| No | 47 | 55 | 55 |
| Yes | 53 | 45 | 45 |
| Total | 100 | 100 | 100 |
GED = general equivalency diploma; FPL = federal poverty level.
* χ2, P <.01.
† χ2, P <.05.
Access to Health Care and Medications
Lost or disrupted coverage was significantly associated with unmet need. As shown in Figure 1 ▶, 67% of those who lost coverage reported unmet health care needs, compared with 40% of those with disrupted coverage and 28% of those with stable coverage. The proportion of respondents reporting unmet medication needs were similar among those with stable and disrupted coverage (46%). Those who lost coverage, however, reported significantly higher rates (61%) of unmet medication needs.
Figure 1.
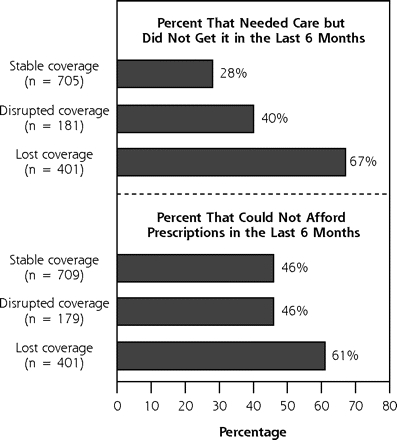
Unmet health care need by insurance status.
Unmet Need: P = .001, χ2 test.
Prescriptions: P = .001, χ2 test.
When all respondents were asked to identify why they did not get needed care, the principal access barrier for most was cost: 74% of those with disrupted or lost coverage indicated that cost was the reason, compared with 52% of those with stable coverage (P <.001, analysis not shown).
Health Care Utilization
Respondents were asked how many times they had a primary care visit in the preceding 6 months. As shown in Figure 2 ▶, respondents who lost coverage were significantly less likely than the other groups to have a primary care visit. Only 45% of those who lost coverage had a visit compared with 74% of those with disrupted coverage and 82% of those with stable coverage. Visits to hospital emergency departments were comparable across all 3 coverage groups.
Figure 2.
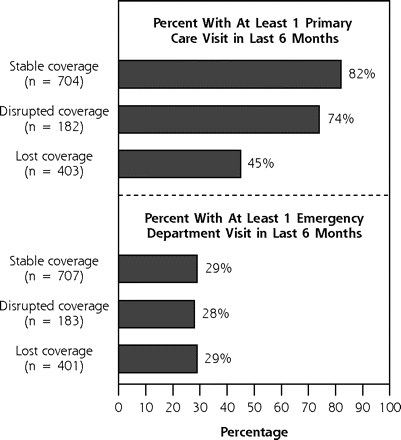
Utilization of health care by insurance status.
Primary care: P = .001, χ2 test.
Emergency department visits: not significant.
Financial Impacts
There was also a significant relationship between medical debt and insurance status. Forty percent of those who lost coverage reported owing $500 or more in medical debt compared with 31% of those with disrupted coverage and 20% of those with stable coverage. Those who lost coverage were also significantly more likely to have been denied care because of unpaid medical bills (Figure 3 ▶).
Figure 3.
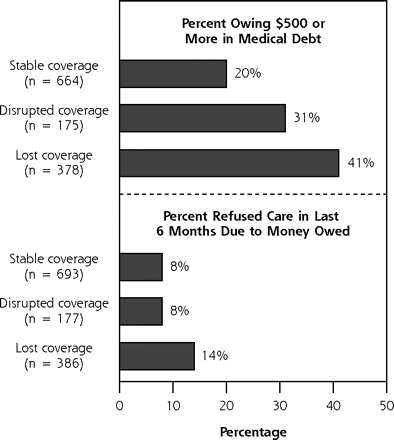
Financial outcomes by insurance status.
Medical debt: P = .001, χ2 test.
Refused care: P = .001, χ2 test.
Multivariate Analysis
To estimate the net effect of insurance coverage on outcomes, multivariate logistic regression was performed for each of the significant outcome measures: unmet health care and medication needs, primary care utilization, and medical debt. Models were adjusted for age, sex, race, language, education, income as a percentage of the federal poverty level, health status, and chronic illness. Adjusted odds ratios for coverage patterns are displayed in Table 3 ▶, and full models are shown in Table 4 ▶.
Table 3.
Adjusted Odds Ratios for Reporting Unmet Health Care Needs, Primary Care Utilization, and Medical Debt in the Past 6 Months
| Insurance Status | Odds of Unmet Health Care Needs n = 1,271 | Odds of Unmet Medication Needs n = 1,271 | Odds of Primary Care Use n = 1,272 | Odds of Medical Debt n = 1,239 |
| Stable coverage | 1.00 | 1.00 | 1.00 | 1.00 |
| Disrupted coverage | 1.85* (1.28–2.67) | 1.16 (0.81–1.68) | 0.66†(0.44–0.99) | 1.99* (1.35–2.93) |
| Lost coverage | 5.55* (4.17–7.38) | 2.05* (1.55–2.71) | 0.18* (0.13–0.24) | 3.06* (2.28–4.12) |
Note: Model adjusted for age, sex, race, language, income, education, health status, and chronic disease.
* P <.01.
† P <.05.
Table 4.
Adjusted Odds Ratios for Reporting Unmet Health Care Needs, Primary Care Utilization and Medical Debt in the Past 6 Months—Full Model
| Characteristics | Odds of Unmet Health Care Needs n = 1,271 | Odds of Unmet Medication Needs n = 1,271 | Odds of Primary Care Use n = 1,271 | Odds of Medical Debt n = 1,239 |
| Insurance status | ||||
| Stable coverage | 1.00 | 1.00 | 1.00 | 1.00 |
| Disrupted coverage | 1.85* | 1.16 | 0.66† | 1.99* |
| Lost coverage | 5.55* | 2.05* | 0.18* | 3.06* |
| Age | 0.98† | 0.99 | 1.00 | 0.97* |
| Sex | ||||
| Female | 1.00 | 1.00 | 1.00 | 1.00 |
| Male | 0.95 | 0.74† | 0.52* | 1.46† |
| Race/ethnicity | ||||
| White (non-Hispanic) | 1.00 | 1.00 | 1.00 | 1.00 |
| Black (non-Hispanic) | 1.06 | 0.99 | 0.89 | 1.31 |
| American Indian/Alaskan Native (non-Hispanic) | 0.68 | 0.49† | 0.96 | 0.74 |
| Other (non-Hispanic) | 1.21 | 0.57 | 0.85 | 1.05 |
| Hispanic | 1.19 | 1.45 | 0.82 | 1.03 |
| Primary language | ||||
| English | 1.00 | 1.00 | 1.00 | 1.00 |
| Spanish | 0.32* | 0.16* | 0.60 | 0.41† |
| Education | ||||
| More than high school | 1.00 | 1.00 | 1.00 | 1.00 |
| High school/GED | 0.61* | 1.04 | 0.67* | 0.74 |
| Less than high school | 0.74* | 1.35 | 0.62† | 1.42 |
| Income as % of FPL | ||||
| 100%+ | 1.00 | 1.00 | 1.00 | 1.00 |
| 26%–100% | 1.15 | 0.86 | 0.82 | 0.64 |
| 1%–25% | 1.13 | 0.71 | 0.79 | 0.54 |
| 0% | 0.99 | 0.61 | 0.56 | 0.44 |
| Not reported | 0.98 | 1.01 | 0.63 | 1.31 |
| Health status | ||||
| Very good/excellent | 1.00 | 1.00 | 1.00 | 1.00 |
| Good | 1.41† | 1.92* | 1.01 | 1.91† |
| Fair/poor | 3.04* | 3.76* | 1.93† | 4.38* |
| Any chronic illness | ||||
| No | 1.00 | 1.00 | 1.00 | 1.00 |
| Yes | 1.18 | 2.24* | 1.39† | 1.33† |
GED = general equivalency diploma; FPL = federal poverty level.
* P <.01.
† P <.05.
As shown in Table 3 ▶, compared with those with stable coverage, respondents with disrupted coverage were significantly more likely to report unmet health care needs, were less likely to have a primary care visit, and were more likely to have medical debt of $500 or more. Also compared with the stably insured, those who lost coverage were significantly more likely to report unmet health care needs and medication needs, were less likely to have a primary care visit, and were more likely to owe $500 or more in medical debt.
DISCUSSION
Results from the baseline OHP cohort survey indicate that nearly one half (45%) of the OHP Standard population experienced disrupted or lost coverage in the first 10 months after the OHP redesign. This result is consistent with the OHP administrative data, which show a 46% decline, from 88,874 to 47,957 covered lives, between February and December 2003. This decline stands in stark contrast to the same period 1 year before the policy changes, when enrollment among the same population declined by only 3% from 93,722 (February 2002) to 91,174 (December 2002).28
OHP program changes were identified by respondents as a primary reason for losing coverage. As reported in earlier research on the same population, nearly one half (44%) of those losing coverage reported that program costs and ineligibility because of a missed premium were the main reasons for losing coverage. Other common reasons for leaving OHP included increased income (31%) and obtaining private insurance coverage (10%).29
OHP beneficiaries who lost coverage reported significantly worse health care and medication access and significantly higher medical debt than those with stable coverage. These results are similar to the findings of a study conducted on a clinical sample of California Medicaid enrollees more than 2 decades ago. Lurie et al9 examined changes in access to care for a 6-month period among 215 Medi-Cal beneficiaries whose benefits were terminated. Among those terminated, 62% reported being unable to obtain needed medical care compared with only 7% of those who remained insured. Moreover, clinically significant increases in uncontrolled hypertension that were evident among those whose Medi-Cal coverage was terminated did not occur among those who retained insurance. A follow-up study at 1 year conducted on the same population indicated that although access to care among those terminated remained far worse than those with insurance, there was no significant decrease in access to care at 12 months than at 6 months.10
In the current study, disruptions in insurance coverage were also associated with an increased likelihood of unmet need and medical debt. These findings are similar to those of previous research conducted with a national sample of low-income adults.24 In the latter study, respondents who reported at least 1 gap in health insurance over a 2-year period were 2 to 3 times more likely to report unmet health care and medication needs and to have trouble paying medical bills than respondents with continuous insurance.
Interestingly, there was no relationship in the current study between lost or disrupted coverage and emergency department utilization in the 6-month reporting period. It is possible that the reporting period was too brief for declining primary care or medication access to cause increased emergency department use. Another reasonable explanation is that there were financial disincentives for all 3 groups. For those with stable insurance, the imposition of a $50 co-payment may have acted as a disincentive; for the uninsured or unstably insured, fear of receiving medical bills with no insurance coverage may have done so.
Limitations
There were limitations in the current study. First, it relied heavily on self-report, which can be subject to recall bias.30 To limit this bias, multiple items were used to examine issues such as access to care, all based on well-validated surveys. Additionally, a 6-month recall period was used, rather than a 1-year period, to minimize recall bias.
Self-reported information about health care needs and chronic conditions are subject to bias as well. For example, it is not clear whether those who reported needing health care actually needed it. On the other hand, it is also likely that many of those not reporting health care needs may have actually needed care. Similarly, the measure of chronic illness in this study depends both on having contact with a physician to obtain a diagnosis and accurately recalling that this event occurred.
Finally, our survey response rate was approximately 34%, a rate comparable to those of other studies of Medicaid populations, even those that used telephone follow-up.31 As in similar studies, questions still arise about nonresponse bias. For example, individuals with no current address were excluded from the study, which likely results in underreporting the experiences of some populations, including the homeless or persons in transitional housing. Additionally, although 95% of respondents reported insurance information, a higher percentage of African Americans, Hispanics, and less-educated respondents did not report this information. It is possible, therefore, that these findings underestimate the extent to which these groups were affected by changes in insurance status. There is also the possibility of unmeasured differences between responders and nonresponders. For example, if those who were more adversely affected by program changes were also more likely to respond to the survey, results presented here may overestimate the impacts of coverage loss or disruptions. On the other hand, the proportion of responders in the survey cohort who reported losing coverage (45%) was very similar to the actual number known to have lost coverage based on Medicaid enrollment data (46%). This similarity provides some measure of confidence for the estimates reported in this analysis.
Policy Implications
As many states continue to struggle with financing their Medicaid programs and as the federal budget proposes deep cuts in Medicaid funding, the findings presented here should give rise to a serious discussion about the potentially negative impacts of policy options that include increasing cost sharing or limiting enrollment.
Early findings from this ongoing cohort study suggest that increased cost sharing and tightened administrative rules in Oregon resulted in immediate loss of coverage, unmet health care needs, and increased debt for a substantial number of low-income adults. Moreover, even relatively brief gaps in coverage can lead to decreased access and increased financial burden. It is reasonable to assume that short-term reductions in access to health care and medications may result in worsening health status with time and may lead to increased risk of emergency department utilization or hospitalization. Although it is too soon to address the long-term impacts of disrupted insurance coverage in Oregon, surveys of subsequent waves of the study cohort will be able to address more fully these important questions.
Acknowledgments
The authors gratefully acknowledge the Oregon Health Research and Evaluation Collaborative, the Office for Oregon Health Policy and Research, and the Oregon Office for Medical Assistance Programs. Additionally, this project would not have been possible without the efforts of the research team members, especially Charles Gallia, Lisa Krois, Jessica Miller, and Heidi Allen.
Conflicts of interest: none reported
Funding support: This research was funded by RWJF State Coverage Initiatives in Health Care Reform Grant #0403017 and the Oregon Office of Medical Assistance Programs.
REFERENCES
- 1.Schoen C, Lyons B, Rowland D, Davis K, Puleo E. Insurance matters for low-income adults: results from a five-state survey. Health Aff (Millwood). 1997;16:163–171. [DOI] [PubMed] [Google Scholar]
- 2.Haber SG, Khatutsky G, Mitchell JB. Covering uninsured adults through Medicaid: lessons from the Oregon health plan. Health Care Financ Rev. 2000;22:119–135. [PubMed] [Google Scholar]
- 3.Mitchell JB, Haber SG, Khatutsky G, Donoghue S. Impact of the Oregon Health Plan on access and satisfaction of adults with low income. Health Serv Res. 2002;37:11–31. [PubMed] [Google Scholar]
- 4.Coughlin TA, Long SK, Shen YC. Assessing access to care under Medicaid: evidence for the nation and thirteen states. Health Aff (Millwood). 2005;24:1073–1083. [DOI] [PubMed] [Google Scholar]
- 5.Long SK, Coughlin T, King J. How well does Medicaid work in improving access to care? Health Serv Res. 2005;40:39–58. [DOI] [PMC free article] [PubMed] [Google Scholar]
- 6.Smith V, Ramesh R, Gifford K, et al. The continuing Medicaid budget challenge: State Medicaid spending growth and cost containment in fiscal years 2004 and 2005. Kaiser Commission on Medicaid and the Uninsured; 2004.
- 7.Artiga S, O’Malley M. Increasing premiums and cost sharing in Medicaid and SCHIP: Recent state experiences. Washington DC: Kaiser Commission on Medicaid and the Uninsured. 2005.
- 8.Wright BJ, Carlson MJ, Edlund T, et al. The impact of increased cost sharing on Medicaid enrollees. Health Aff (Millwood). 2005;24:1106–1116. [DOI] [PubMed] [Google Scholar]
- 9.Lurie N, Ward NB, Shapiro MF, Brook RH. Termination from MediCal--does it affect health? N Engl J Med. 1984;311:480–484. [DOI] [PubMed] [Google Scholar]
- 10.Lurie N, Ward NB, Shapiro MF, et al. Termination of MediCal benefits. A follow-up study one year later. N Engl J Med. 1986;314:1266–1268. [DOI] [PubMed] [Google Scholar]
- 11.Strunk BC, Cunningham PJ. Treading water: Americans’ access to needed medical care, 1997–2001. Track Rep. 2002:1–6. [PubMed]
- 12.DeVoe JE, Fryer GE, Phillips R, Green L. Receipt of preventive care among adults: insurance status and usual source of care. Am J Public Health. 2003;93:786–791. [DOI] [PMC free article] [PubMed] [Google Scholar]
- 13.The importance of primary care physicians as the usual source of healthcare in the achievement of prevention goals. Am Fam Physician. 2000;62:1968. [PubMed] [Google Scholar]
- 14.Bindman AB, Grumbach K, Osmond D, Vranizan K, Stewart AL. Primary care and receipt of preventive services. J Gen Intern Med. 1996;11:269–276. [DOI] [PubMed] [Google Scholar]
- 15.Hayward RA, Bernard AM, Freeman HE, Corey CR. Regular source of ambulatory care and access to health services. Am J Public Health. 1991;81:434–438. [DOI] [PMC free article] [PubMed] [Google Scholar]
- 16.Weissman JS, Stern R, Fielding SL, Epstein AM. Delayed access to health care: risk factors, reasons, and consequences. Ann Intern Med. 1991;114:325–331. [DOI] [PubMed] [Google Scholar]
- 17.Gross CP, Mead LA, Ford DE, Klag MJ. Physician, heal Thyself? Regular source of care and use of preventive health services among physicians. Arch Intern Med. 2000;160:3209–3214. [DOI] [PubMed] [Google Scholar]
- 18.Ettner SL. The timing of preventive services for women and children: the effect of having a usual source of care. Am J Public Health. 1996;86:1748–1754. [DOI] [PMC free article] [PubMed] [Google Scholar]
- 19.Ettner SL. The relationship between continuity of care and the health behaviors of patients: does having a usual physician make a difference? Med Care. 1999;37:547–555. [DOI] [PubMed] [Google Scholar]
- 20.Yu SM, Bellamy HA, Kogan MD, et al. Factors that influence receipt of recommended preventive pediatric health and dental care. Pediatrics. 2002;110:e73. [DOI] [PubMed] [Google Scholar]
- 21.Corbie-Smith G, Flagg EW, Doyle JP, O’Brien MA. Influence of usual source of care on differences by race/ethnicity in receipt of preventive services. J Gen Intern Med. 2002;17:458–464. [DOI] [PMC free article] [PubMed] [Google Scholar]
- 22.Sudano JJ, Jr., Baker DW. Intermittent lack of health insurance coverage and use of preventive services. Am J Public Health. 2003;93:130–137. [DOI] [PMC free article] [PubMed] [Google Scholar]
- 23.Kasper JD, Giovannini TA, Hoffman C. Gaining and losing health insurance: strengthening the evidence for effects on access to care and health outcomes. Med Care Res Rev. 2000;57:298–318; discussion 319–225. [DOI] [PubMed] [Google Scholar]
- 24.Schoen C, DesRoches C. Uninsured and unstably insured: the importance of continuous insurance coverage. Health Serv Res. 2000;35:187–206. [PMC free article] [PubMed] [Google Scholar]
- 25.CAHPS 2.0 Survey and Reporting Kit. Silver Springs, MD: Agency for Healthcare Research and Quality; 2002.
- 26.Community Tracking Survey, Household Survey Instrument 2000–2001, Round Three. Washington DC: Center for Studying Health System Change; 2004. Technical Publication #54.
- 27.Ware J, Kolinski M, Keller S. How to Score the SF-12 Physical and Mental Health Summaries: A User’s Manual. The Health Institute, New England Centre; 1995.
- 28.OHP Eligibility Report, Month Ending December 2002. Salem, OR: Oregon Department of Human Services; 2003.
- 29.Carlson M, Wright B. The Impact of Program Changes on Enrollment, Access, and Utilization in the Oregon Health Plan Standard Population. Salem, OR: Office for Oregon Health Policy and Research; 2005.
- 30.Guyatt GH, Feeny DH, Patrick DL. Measuring health-related quality of life. Ann Intern Med. 1993;118:622–629. [DOI] [PubMed] [Google Scholar]
- 31.Annual Report of the National CAHPS Benchmarking Database 2000. Rockville, MD: U.S. Agency for Healthcare Research and Quality; 2001.