Abstract
Excitatory synaptic activity can evoke transient and substantial elevations of postsynaptic calcium. Downstream effects of elevated calcium include the activation of the calcium-dependent protease calpain. We have developed a reagent that identifies dendritic spines in which calpain has been activated. A fusion protein was expressed that contained enhanced yellow and enhanced cyan fluorescent protein (EYFP and ECFP, respectively) linked by a peptide that included the μ-calpain cleavage site from α-spectrin. A PDZ-binding site fused to ECFP anchored this protein to postsynaptic densities. The fusion protein exhibited fluorescence resonance energy transfer (FRET), and diminution of FRET by proteolysis was used to localize calpain activity in situ by fluorescence microscopy. Incubation of the fusion protein with calpain in the presence of calcium resulted in the separation of EYFP and ECFP into monomeric fluorophores. In transiently transfected cell lines and dissociated hippocampal neurons, FRET was diminished by raising intracellular calcium levels with an ionophore or with glutamatergic agonists. Calpain inhibitors blocked these changes. Under control conditions, FRET levels in different dendritic spines of cultured neurons and in hippocampal slices were heterogeneous but showed robust decreases upon treatment with glutamatergic agonists. Immunostaining of cultured neurons with antibodies to a spectrin epitope produced by calpain-mediated digestion revealed an inverse correlation between the amount of FRET present at postsynaptic elements and the concentration of spectrin breakdown products. These results suggest that the FRET methodology identifies sites of synaptically induced calpain activity and that it may be useful in analyzing synapses undergoing changes in efficacy.
Activity-dependent increases in synaptic efficacy are thought to be necessary for several forms of learning and memory (for review, see refs. 1–3). A critical event for the induction of stable changes in synaptic strength appears to be a large but transient increase in intracellular calcium (4, 5). Attempts to understand the molecular and cellular mechanisms underlying synaptic plasticity have been limited by an inability to resolve functional changes of individual synapses at a histological level. Although recent reports have demonstrated biochemical and morphological alterations in response to localized manipulations of synaptic activity (6–8), most studies rely on sampling methods that cannot discriminate between synaptic sites that have undergone functional change and the majority of the population, which remains unchanged. It therefore would be useful to have an enzymatic reporter to mark individual synapses that have undergone functional change. A useful marker enzyme should be dependent on the levels of calcium required for synaptic plasticity, have a low background activation, and have substrates that are not equivalently modified by other enzymes. The calcium-dependent protease μ-calpain satisfies all the above criteria (9). Calpain is activated in neurons in response to pharmacological stimulation of glutamate receptors (10, 11) as well as after patterns of afferent stimulation leading to long-term potentiation (LTP; ref. 12). Moreover, calpain activity has been shown to be required for LTP (13, 14).
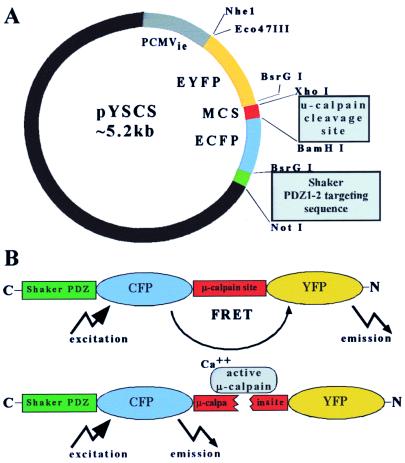
To monitor calpain activity in situ, we measured fluorescence resonance energy transfer (FRET) in a fusion protein containing two green fluorescent protein (GFP) variants, enhanced cyan fluorescent protein (ECFP), and enhanced yellow fluorescent protein (EYFP), linked by a peptide that includes a μ-calpain cleavage site identical to one present in α-spectrin (see Fig. 1A). This site is cleaved by μ-calpain but not by other mammalian proteases tested (11, 15, 16). Transfer of energy from ECFP to EYFP (FRET) occurs as the emission spectrum of ECFP overlaps significantly with the excitation spectrum of ECFP. This results in EYFP emission after excitation of ECFP and in a partial quenching of ECYP. By virtue of the close proximity required for FRET (<100 Angstroms), processes that increase the distance between ECFP and EYFP, e.g., cleavage of the linker peptide by calpain, abolish FRET. A PDZ-binding site was fused to ECFP to anchor the fusion protein to postsynaptic densities to better localize sites of synaptic calpain activation. FRET methodology previously has been used to register the activation of specific caspases (17, 18) and other proteases (19) in situ. In the present study, we transfected a construct encoding the fusion protein into dissociated neurons and hippocampal slices. By measuring decreases in FRET, we identified individual dendritic spines showing increased calpain activity in response to glutamatergic agonists. This method may prove useful in analyses of synaptically triggered protease activity in populations of dendritic spines, particularly as it relates to LTP and other forms of plasticity induced by large calcium transients.
Figure 1.
Design of a calpain-sensitive marker, pYSCS. (A) Using the pEGFP-C3 vector (CLONTECH), EYFP and ECFP were fused in-frame with an intervening sequence from the μ-calpain cleavage site in α-spectrin. A PDZ cognate sequence that binds to PSD95 was added at the 3′ end to facilitate retention of the expressed protein at postsynaptic sites. (B) Expression of pYSCS yielded a fusion protein from which FRET could be visualized in situ after excitation of the donor ECFP fluorophore. Separation of ECFP and EYFP by μ-calpain abolishes FRET, resulting in decreased EYFP fluorescence and a concomitant increase of ECFP fluorescence.
Methods
Construction of the Calpain-Sensitive FRET Vector, pYSCS.
A vector, designated pYSCS, encoding the in-frame fusion of EYFP, the μ-calpain cleavage site of α-Spectrin, ECFP, and the cognate sequence to PSD95 PDZ domains 1 and 2 from the Shaker 1.7 potassium channel, was assembled from CLONTECH vectors pEYFP-C1, pECFP-N1, and pEGFP-C3 by using standard molecular biological techniques. The encoded peptide sequence adjoining EYFP and ECFP consisted of 10 aa identical to the calpain-sensitive site in the 11th spectrin repeat of α-spectrin and flanked by glycine and serine residues [GSGSGQQEVYGMMPRDGSG; (20)]. The Shaker PDZ cognate domain sequence, AGKHMVTEV (21), was encoded to facilitate monitoring of YSCS cleavage at synapses by retaining the donor fluorophore (ECFP) at postsynaptic densities. A version of pYSCS in which the μ-calpain cleavage site was mutated to GSGSGGMMPRDQQEVYGSG (YSCSmut) served as a control.
In Vitro Cleavage Experiments and Western Blots.
Extracts from COS-7 and N2A cells transiently transfected with pYSCS were combined on ice with purified μ-calpain (Calbiochem) in the presence of 25 mM 2-mercaptoethanol/25 mM Hepes/100 mM NaCl. Some cocktails also contained either 4 mM EGTA or 50 μM calpain inhibitor 1 (Calbiochem). Reactions were started by addition of 1 mM CaCl2, incubated at 30°C, and then terminated by addition of 6× SDS/PAGE buffer. Western blots were performed by using a monoclonal anti-GFP primary antibody (CLONTECH), and results were visualized by chemiluminescence (Amersham Pharmacia).
Culture Methods, Transfections, and Pharmacological Treatments.
Transverse sections of hippocampus (350 μ) from rats on postnatal days 8–11 were prepared and maintained in culture as described previously (12). Hippocampal neurons were prepared from E18 rat embryos and maintained in culture for at least 3 weeks according to methods described by Sporns and Jenkinson (22).
Introduction of pYSCS plasmid DNA into organotypic cultures of hippocampus was carried out 2 days before treatment by using the Bio-Rad biolistic (“gene gun”) transfection system according to the manufacturer's protocols. Cultured dissociated embryonic hippocampal neurons were transfected with pYSCS 3–7 days before pharmacological treatments by using calcium phosphate precipitation (Promega). Cos-7 and N2A cells were transfected by using Superfect (Qiagen).
Agonist treatments consisted of either 100 μM glutamate or 100 μM NMDA in combination with 100 μM spermine, 85 μM glycine, and 4 mM CaCl2. In cultures to be analyzed immediately, treatment was terminated by rapid washing and fixation on ice. For later time points, agonist cocktails were replaced after 3 min with medium containing 100 μM AP5 and 20 μM 6-cyano-7-nitroquinoxaline-2,3-dione, followed by regular medium until fixation. Pretreatment with calpain inhibitors (25 μM calpeptin or calpain inhibitor 1) was carried out for 1 hr before addition of glutamatergic agonists or calcium ionophores to ensure adequate membrane penetration. Samples were fixed with 4% paraformaldehyde in PBS for 10 min (for dissociated cells) or 30 min (for slice cultures). To immunostain the spectrin breakdown product, a polyclonal antibody (generously provided by T. C. Saido, RIKEN Brain Science Institute, Tokyo) was used that recognized the α-spectrin C-terminal epitope exposed by calpain-mediated digestion (16).
Image Analysis and Calculation of FRET Ratios.
Images were acquired by using a Zeiss Axioplan 2 fluorescent microscope that was fitted with a Cooke Sensicam charge-coupled device camera (12 bit) and controlled by the slidebook software package from Intelligent Imaging Innovations (Denver, CO). Filter cube specifications for the fluorescence channels used were as follows (for excitation, emission, and beam splitter, respectively): ECFP (436 ± 20 nm, 480 ± 40 nm, 455 nm); EYFP (500 ± 20 nm, 535 ± 30 nm, 515 nm); FRET (440 ± 20 nm, 535 ± 30 nm, 455 nm); and Cy3 reference channel (545 ± 25 nm, 605 ± 75 nm, 565 nm).
Image analysis involved three basic operations: subtraction of background autofluorescence and blurred light, quantitation of fluorescence intensity, and calculation of FRET/ECFP fluorescence ratios (acceptor/donor, or “FRET ratios”). All of these operations were done in slidebook. In calculating FRET ratios, two methods were used to minimize the contribution of autofluorescence. For dissociated hippocampal neurons, the average background signal derived from an area adjacent to the object of interest where no specific EYFP signal could be detected was subtracted from the entire image. In hippocampal slice cultures, pixel-by-pixel adjustments were made by using a reference channel similar to the method of Van De Lest (23).
Calculation of FRET ratios for large numbers of spines was achieved by segmenting the intensity histogram of the EYFP channel so that a mask highlighting regions of stronger fluorescence was created that matched spine areas. The resulting masks were gated by size to exclude areas not corresponding to dendritic spines. Values of fluorescent intensity for the adjusted channels then were used to calculate FRET ratios on a pixel-by-pixel basis within the areas highlighted by the mask. A drawing tool was used to create masks over individual features that could not be discriminated by thresholding. For display purposes, FRET-based fluorescence is shown throughout the text in red and donor (ECFP) fluorescence is shown in green; yellow indicates a superimposition of these signals.
Results
YSCS Protein Is a Calpain Substrate.
A FRET construct designed to yield a calpain-sensitive product, designated pYSCS, was assembled as described in Methods (Fig. 1A). Substantial evidence indicates that the amino acid sequence chosen as the EYFP-ECFP linker is cleaved specifically by calpain (11, 15, 16). Thus, the cleavage of YSCS, visualized as a decrease in FRET, is an indication of a local elevation in calcium sufficient to activate calpain (Fig. 1B).
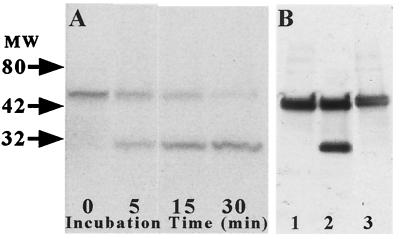
The sensitivity of the YSCS protein to calpain-mediated proteolysis was confirmed by Western blot studies. Lysates of COS-7 cells transiently transfected with pYSCS were incubated with μ-calpain in the presence or absence of calcium and calpain inhibitors. Incubation of the 54-kDa YSCS protein with calpain and calcium for 5–35 min yielded 27-kDa cleavage products, corresponding to the molecular masses of monomeric EYFP and ECFP (Fig. 2A). Proteolytic separation of the GFP variants occurred rapidly and completely, without the appearance of lower-molecular-mass species. Amino acid substitution within the calpain cleavage site (YSCSmut) attenuated this digestion (Fig. 2B, lane 2). Proteolysis of the YSCS protein (Fig. 2B, lanes 1 and 3) was blocked by addition of the calcium chelator EGTA or calpain inhibitor 1 to the reaction mixture.
Figure 2.
Sensitivity of the YSCS fusion protein to proteolysis by μ-calpain in vitro. Extracts of COS-7 cells transfected with pYSCS were incubated with purified μ-calpain and calcium. (A) A Western blot of samples harvested at the indicated times was probed with an anti-GFP antibody that recognized both the 54-kDa YSCS protein and a 27-kDa band corresponding to the molecular mass of monomeric GFPs (27 kDa). (B) Inclusion of the calcium chelator EGTA (lane 1) or the calpain inhibitor calpeptin (lane 3) to the reaction mixture blocked formation of the breakdown product. Extracts from cells transfected with pYSCSmut showed partial proteolysis of the protein (lane 2).
YSCS Protein Exhibits FRET that Is Sensitive to Intracellular Calcium Levels.
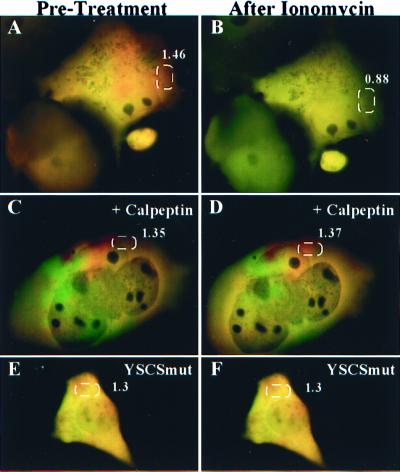
To test the ability of the pYSCS construct to report calpain activity in situ, we transfected COS-7 and N2A cells and imaged them before and after treatment with ionomycin, a calcium ionophore. Within a day of transfection, fluorescence emitted by the YSCS fusion protein was sufficiently intense to permit quantitative analysis in all channels based on brief exposure times (50–400 msec). Images (Fig. 3) were collected before and 10 min after treatment with 0.5 μM ionomycin and 6 mM CaCl2. The decrease in the relative proportions of FRET-based fluorescence (red) to donor fluorescence (green) can be seen in those images in which the two channels are superimposed (compare Fig. 3 A and B). As a quantitative indicator of pYSCS cleavage, FRET ratios are shown for selected areas. Pretreatment with 25 μmol/liter calpeptin, a potent and selective calpain inhibitor, blocked this effect (Fig. 3 C and D). Decreases in FRET ratios under conditions that activate calpain were also attenuated in cells expressing YSCS protein with the mutated spectrin cleavage site (YSCSmut; Fig. 3 E and F). These experiments indicate that cellular expression of the YSCS fusion protein can be used as a marker of calpain activation in situ.
Figure 3.
YSCS protein exhibits FRET, which is sensitive to calcium levels and calpain activity. COS-7 cells transfected with pYSCS were imaged before (A, C, and E) and 10 min after (B, D, and F) treatment with ionomycin and 6 mM CaCl2. In untreated cells (A), addition of ionomycin (B) produced a conversion of YSCS fluorescence from a mixture of FRET-based (red) and donor (green) signals to an almost purely donor-generated signal. Pretreatment with calpeptin (C) 20 min before addition of ionomycin blocked reductions in FRET-based fluorescence initiated by calcium influx (D). Treatment of N2A cells expressing YSCSmut (E) with ionomycin demonstrated only minor changes in the FRET ratio (F). FRET ratio values averaged over highlighted regions of the cells are shown in white text.
Sensitivity to Glutamatergic Agonists.
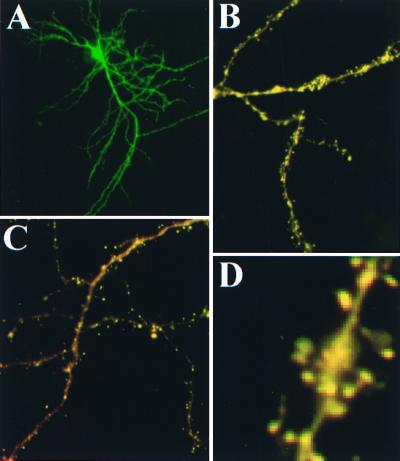
Transfection of cultured embryonic neurons and hippocampal slices with pYSCS resulted in expression of the fluorescent fusion protein in pyramidal and granule neurons. Fluorescence was observed throughout all neuronal processes (Fig. 4A). The YSCS protein exhibited a 2- to 5-fold higher concentration in spines relative to their parent dendritic shafts (Fig. 4 B–D).
Figure 4.
Expression of YSCS in neurons. Low-magnification images of YSCS fluorescence after excitation of YFP in a neuron (A) from an organotypic hippocampal culture. Images collected during CFP excitation reveal the occurrence of both donor (green) and FRET-based fluorescence (red) throughout the dendritic processes of neurons in organotypic (B) and dissociated (C) hippocampal preparations. Enlargement of a dendrite in slice culture (D) demonstrates that YSCS is concentrated in spine heads.
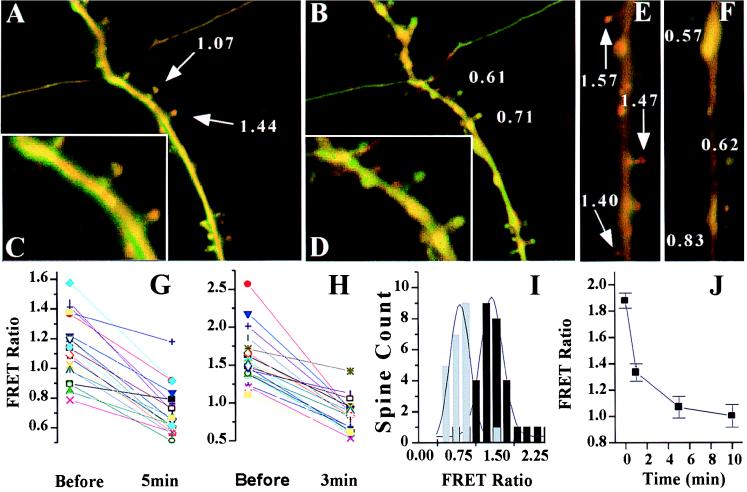
The utility of pYSCS as a reporter of glutamate receptor-induced calpain activation was initially examined in real-time imaging experiments in cultures of dissociated hippocampal neurons. Images collected before and 3 to 5 min after exposure of neurons to glutamate or NMDA revealed a substantial decrease in the FRET ratio in dendritic spines (Fig. 5 A–F). Plotting the responses of individual spines showed that, although a majority of the spines underwent a decrease in FRET ratio, they did not respond uniformly (Fig. 5 G and H). Overall, the mean percent reduction in FRET ratios after NMDA treatment was 46.4 ± 13.3% (Fig. 5I), whereas glutamate treatment induced a 38.1 ± 12.1% reduction (data not shown). These decreases in mean FRET ratios were statistically significant (P < 0.0001) and were similar to those observed in COS-7 cells upon calcium ionophore treatment. Decreases in FRET ratios were also noted along the dendritic shafts between spines, although these changes were smaller on average (26.2 ± 5.2% in a sampling from five dendritic segments in NMDA-treated cultures). NMDA-treated cultures fixed after different time points (Fig. 5J) showed a substantial decrease in the average FRET ratio within the first minute, suggesting that calpain is rapidly activated in response to glutamate receptor stimulation.
Figure 5.
Treatment of dissociated hippocampal neurons with glutamatergic agonists leads to a decrease in FRET. (A) A dendrite with numerous spines from a pyramidal cell transfected with pYSCS and imaged live. FRET and ECFP fluorescence are shown in red and green, respectively. FRET ratios for spines indicated by arrows are shown in white text. (B) The same cell imaged 3 min after addition of 100 μM glutamate. Most spines change from a predominantly FRET signal to a greener donor signal and show reduced FRET ratios. Enlargements of selected spines pretreatment (C) and posttreatment (D) with glutamate are displayed. Paired images are shown from experiments before (E) and after (F) treating dissociated neurons with 100 mM NMDA. Plots of FRET ratios of individual spines are shown before and after treatment with glutamate (G) and NMDA (H). Comparable reductions in FRET ratios were observed in most spines, but some exhibited only slight variations from starting FRET ratios. (I) Histograms of binned FRET ratios from spine populations imaged live showed significant (P < 0.0001) reductions after NMDA treatments (black, pretreatment; gray, posttreatment) and after glutamate treatment (data not shown). (J) Dissociated cultures were fixed at different time points after treatment with NMDA, and the FRET ratio was measured. n = 30, 26, 133, and 100 spines for the time points 0, 1, 5, and 10 min, respectively.
Decreases of FRET in Situ Are Correlated with the Appearance of a Calpain-Generated Spectrin Epitope.
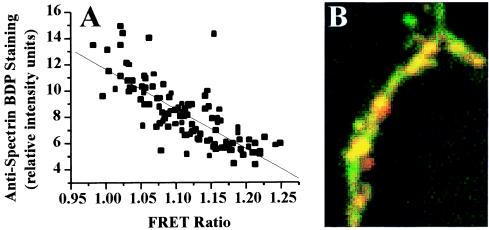
To confirm that sites at which FRET ratios were diminished by stimulation of glutamate receptors were those at which calpain was activated, postfixation immunohistochemistry with an antibody recognizing the carboxyl terminal epitope of α-spectrin generated by calpain-mediated digestion was performed on dissociated hippocampal neurons. Overlaying FRET (green) and antispectrin breakdown product (red) fluorescence revealed spines that contained either of the two markers or a combination of both (Fig. 6B, yellow). Synapses with high FRET signals had lower levels of antibody staining. A strong inverse correlation (r = −0.78) was observed between the intensity of FRET-based fluorescence and levels of spectrin breakdown product quantified with a Cy3-labeled secondary antibody (Fig. 6A).
Figure 6.
Correlation between histochemical and FRET measures of calpain activation in spines. Dissociated hippocampal neurons were transfected with pYSCS and immunolabeled with antibodies specific for calpain-mediated spectrin breakdown products (BDPs). (A) Correlation curve relating the relative intensities of FRET and BDP immunofluorescence in individual spine heads (r = −0.78). (B) Images of stained neurons in which FRET fluorescence is shown in green and anti-BDP staining is shown in red. The majority of the dendrite displays both FRET fluorescence and anti-BDP staining and appears yellow.
FRET in Hippocampal Slice Cultures.
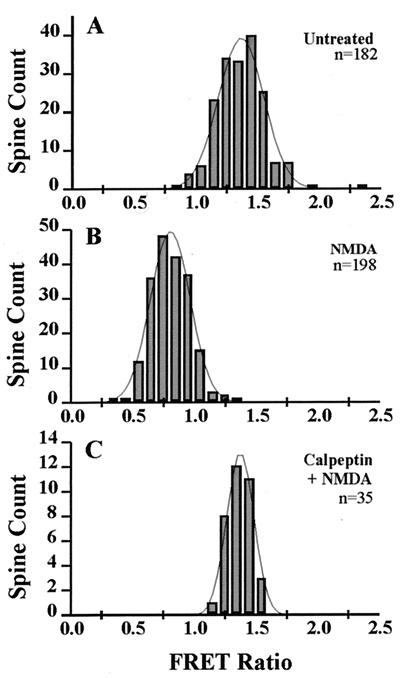
Agonist-induced diminution of FRET-based fluorescence was also observed in slices that were fixed after the pharmacological treatments, thus permitting analysis of more extensive spine populations. Cultured hippocampal slices were treated for 3 min with NMDA in the presence of glycine, spermine, and high calcium, a pharmacological cocktail shown in previous studies to cause a form of potentiation in slices resembling LTP (24). Histograms of FRET ratios for populations of spines in control and NMDA-treated slices fixed 30 min after treatment (Fig. 7 A and B) resembled those obtained by quantifying fluorescence among spines of dissociated neurons imaged in real time after similar treatments. Pretreatment of slices with calpeptin blocked the agonist-induced decreases and reduced the variance in FRET ratios (Fig. 7C) obtained with NMDA. The mean percent decrease in FRET ratios observed 30 min after NMDA treatment was 43.0 ± 7.1% (n = 919 spines, 4 experiments); similar changes were noted 1 and 4 hr posttreatment (data not shown). The reductions in FRET ratios along portions of the dendritic shafts between spines were small (≤5%). Shortening the length of NMDA treatment to 30 sec led to a 25% decrease in the mean spine FRET ratio at 30 min (n = 737 spines, 2 experiments), less than that observed after treating the slices for 3 min with NMDA (see above). This observation suggests that calpain-mediated proteolysis can be activated to varying extents by pharmacological stimulation of glutamate receptors. Postfixation analyses of dissociated neurons gave similar results.
Figure 7.
Distributions of FRET ratios from dendritic spines in fixed hippocampal slice cultures. (A and B) The effect of NMDA on spine FRET ratio distributions (bins of 100) from CA1 pyramidal neurons in a representative experiment. A 3-min treatment with NMDA caused a significant reduction of spine FRET ratios 30 min later that was blocked by pretreatment with calpeptin (C).
Heterogeneity of FRET Ratios Among Spines.
To examine whether the mean FRET ratio and the degree of heterogeneity among control spines was influenced by the occurrence of calpain-mediated proteolysis linked to spontaneous glutamatergic activity, slices were incubated with either calpeptin or AP5/CNQX for 2–3 days before analysis. Incubation with calpain inhibitors caused a modest shift toward higher FRET ratios (13.4 ± 6.6%; n = 1,022 spines from 4 experiments) and a substantial reduction in the variance around the mean. Blocking ionotropic glutamate receptors with competitive antagonists gave results similar to those found after inhibiting calpain, increasing the mean FRET ratio by 10% (n = 238 spines from 2 experiments). These data suggest that a substantial portion of the heterogeneity in control FRET ratios might be due to calpain activation as a consequence of spontaneous synaptic activity.
Discussion
We have designed and characterized a fusion protein construct exhibiting FRET between two variants of GFP to assay calpain activation in situ by fluorescence microscopy. Western blot studies confirmed that the linker peptide between EYFP and ECFP was cleaved by purified μ-calpain in the presence of calcium. Data collected in real-time imaging experiments of transfected cell lines or hippocampal neurons demonstrated that FRET was diminished after treatment with a calcium ionophore or glutamatergic agonists; inhibition of calpain blocked these effects. FRET ratios were comparable in various cell types and were similar whether the cells were analyzed live or postfixation. Immunostaining of spectrin epitopes produced by calpain-mediated digestion revealed an inverse correlation between the degree of FRET present at postsynaptic elements and the concentration of spectrin breakdown products. Although allowing measurements in real time of changes at dendritic spines induced by synaptic activity, the present method also provides a stable marker for activity at postsynaptic densities. These properties should be useful in analyses of events involving changes in synaptic efficacy such as LTP (13).
Other groups recently have used GFP and dye-based imaging to study changes in spine density, shape, and motility in response to manipulations of synaptic activity and of the actin cytoskeleton (6, 25, 26). However, these studies were unable to measure the activity levels of individual spines. Calcium precipitation techniques also have been used to identify synapses at which NMDA receptor-mediated calcium currents were elicited during LTP induction (7). This method requires analysis by electron microscopy and, thus, does not permit examination of living neurons. Tsien and colleagues (27) developed a tunable FRET-based assay that is able to register dynamic calcium fluxes in the range of those occurring in spines during LTP-inducing stimulation. Although the transient nature of the signal does not leave a tag for postfixation analysis, this method could provide information complementary to that described here.
We observed heterogeneity in FRET ratios in the dendritic spines of untreated neurons, with the largest variability occurring in dissociated neurons. This was likely due to spontaneous activity inasmuch as treatment with glutamate receptor antagonists and calpain inhibitors decreased the variability and increased the mean of the FRET ratio. This result is in accord with reports that spontaneous activity can elicit calcium elevations and structural plasticity of dendritic spines (28–30).
Changes in FRET ratios after the addition of glutamatergic agonists also varied among different dendritic spines. It is not known which factors are responsible for this heterogeneity. Differences in NMDA receptor and calpain distribution may account for heterogeneity and differential synaptic responses or the response of NMDA receptors to glutamate may vary as a function of the history of a particular synapse (31, 32). Calcium elevations initiated by activity (33) also may vary as a function of the robustness of buffering mechanisms, spine architecture (34), or of signaling mechanisms coupling receptor-mediated calcium entry to release from intracellular pools (35).
The present method should make it possible to determine whether calpain activation at synapses can be induced by afferent stimulation patterns arranged to mimic the rhythmic bursts of cell spiking—theta burst stimulation—that occur in the hippocampus during learning (36). Coupling the FRET marker of calpain activation with a physiologically realistic and efficient paradigm for LTP induction would create additional applications. Among these are more stringent tests of the specificity of correlations between LTP and the gross morphology of synapses, the conversion of “silent synapses” (37, 38), and the targeting or local synthesis of new gene products. Inasmuch as calpain activity is known to be higher during brain development (39, 40) and plays a role in cytoskeletal remodeling and process extension in multiple cell types (41, 42), FRET assays employing the calpain-sensitive construct may be applicable to phenomena such as neurite extension, sprouting, and retraction. Overactivation of calpain, a pathogenic event resulting from an extensive list of neuronal insults (16, 43), also could be addressed with pYSCS. In all these instances, the method may be particularly useful in correlating information about levels of synaptic activity with spatial information about changes in morphology, distribution, and density in synaptic populations.
Acknowledgments
We thank Dr. Karl Kilborn from Intelligent Imaging Innovations for his generous assistance on the slidebook software, Francella Otero for excellent technical assistance, Dr. T. Saido for the spectrin antibody, and Dr. Olaf Sporns for critical reading of the manuscript. G.M.E. and K.L.C. are consultants to Becton Dickinson. P.W.V. is supported by a training grant from The Skaggs Institute for Chemical Biology. This work was supported by a grant to G.M.E. from the G. Harold and Leila Y. Mathers Foundation.
Abbreviations
- FRET
fluorescence resonance energy transfer
- LTP
long-term potentiation
- ECFP
enhanced cyan fluorescent protein
- EYFP
enhanced yellow fluorescent protein
- GFP
green fluorescent protein
Footnotes
Article published online before print: Proc. Natl. Acad. Sci. USA, 10.1073/pnas.040565597.
Article and publication date are at www.pnas.org/cgi/doi/10.1073/pnas.040565597
References
- 1.Lynch G, Granger R. J Cognit Neurosci. 1992;4:189–199. doi: 10.1162/jocn.1992.4.3.189. [DOI] [PubMed] [Google Scholar]
- 2.Roman F S, Chaillan F A, Soumireu-Mourat B. Brain Res. 1993;601:265–272. doi: 10.1016/0006-8993(93)91719-9. [DOI] [PubMed] [Google Scholar]
- 3.Maren S. Trends Neurosci. 1999;22:561–567. doi: 10.1016/s0166-2236(99)01465-4. [DOI] [PubMed] [Google Scholar]
- 4.Malenka R C, Kauer J A, Zucker R S, Nicoll R A. Science. 1988;242:81–84. doi: 10.1126/science.2845577. [DOI] [PubMed] [Google Scholar]
- 5.Lynch G, Larson J, Kelso S, Barrionuevo G, Schottler F. Nature (London) 1983;305:719–721. doi: 10.1038/305719a0. [DOI] [PubMed] [Google Scholar]
- 6.Engert F, Bonhoeffer T. Nature (London) 1999;339:66–70. doi: 10.1038/19978. [DOI] [PubMed] [Google Scholar]
- 7.Toni N, Buchs P A, Nikonenko I, Bron C R, Muller D. Nature (London) 1999;402:421–425. doi: 10.1038/46574. [DOI] [PubMed] [Google Scholar]
- 8.Steward O, Wallace C S, Lyford G L, Worley P F. Neuron. 1998;21:741–751. doi: 10.1016/s0896-6273(00)80591-7. [DOI] [PubMed] [Google Scholar]
- 9.Mellgren R L. FASEB J. 1987;1:110–115. doi: 10.1096/fasebj.1.2.2886390. [DOI] [PubMed] [Google Scholar]
- 10.del Cerro S, Arai A, Kessler M, Bahr B A, Vanderklish P W, Rivera S, Lynch G. Neurosci Lett. 1994;167:149–152. doi: 10.1016/0304-3940(94)91049-9. [DOI] [PubMed] [Google Scholar]
- 11.Bednarski E, Vanderklish P W, Gall C M, Saido T C, Bahr B A, Lynch G. Brain Res. 1995;694:147–157. doi: 10.1016/0006-8993(95)00851-g. [DOI] [PubMed] [Google Scholar]
- 12.Vanderklish P, Saido T C, Gall C, Arai A, Lynch G. Mol Brain Res. 1995;32:25–35. doi: 10.1016/0169-328x(95)00057-y. [DOI] [PubMed] [Google Scholar]
- 13.Lynch G. Neurobiol Learning Memory. 1998;70:82–100. doi: 10.1006/nlme.1998.3840. [DOI] [PubMed] [Google Scholar]
- 14.del Cerro S, Larson J, Oliver M W, Lynch G. Brain Res. 1990;530:91–95. doi: 10.1016/0006-8993(90)90660-4. [DOI] [PubMed] [Google Scholar]
- 15.Roberts-Lewis J M, Savage M J, Marcy V R, Pinkser L R, Siman R. J Neurosci. 1994;14:3934–3944. doi: 10.1523/JNEUROSCI.14-06-03934.1994. [DOI] [PMC free article] [PubMed] [Google Scholar]
- 16.Saido T C, Yokota M, Nagao S, Yamaura I, Tani E, Tsuchiya T, Suzuki K, Kawashima S. J Biol Chem. 1993;268:25239–25243. [PubMed] [Google Scholar]
- 17.Mahajan N P, Harrison-Shostak D C, Michaux J, Herman B. Chem Biol. 1999;6:401–409. doi: 10.1016/s1074-5521(99)80051-9. [DOI] [PubMed] [Google Scholar]
- 18.Xu X, Gerard A L V, Huang B C B, Anderson D C, Payan D G, Luo Y. Nucleic Acids Res. 1998;26:2034–2035. doi: 10.1093/nar/26.8.2034. [DOI] [PMC free article] [PubMed] [Google Scholar]
- 19.Sagot I, Bonneu M, Balguerie A, Aigle M. FESB Lett. 1999;447:53–57. doi: 10.1016/s0014-5793(99)00258-6. [DOI] [PubMed] [Google Scholar]
- 20.Harris A S, Croall D E, Morrow J S. J Biol Chem. 1988;263:15754–15761. [PubMed] [Google Scholar]
- 21.Kim E, Niethammer M, Rothschild A, Jan Y N, Sheng M. Nature (London) 1995;378:85–88. doi: 10.1038/378085a0. [DOI] [PubMed] [Google Scholar]
- 22.Sporns O, Jenkinson S. Neuroscience. 1997;80:1057–1073. doi: 10.1016/s0306-4522(97)00152-8. [DOI] [PubMed] [Google Scholar]
- 23.Van De Lest C H A, Versteeg E M M, Veerkamp J H, Van Kuppevelt T H. J Histochem Cytochem. 1995;43:727–730. doi: 10.1177/43.7.7608528. [DOI] [PubMed] [Google Scholar]
- 24.Thibault O, Joly M, Muller D, Schottler F, Dudek S, Lynch G. Brain Res. 1989;476:170–173. doi: 10.1016/0006-8993(89)91553-9. [DOI] [PubMed] [Google Scholar]
- 25.Matus A. Curr Opin Neurobiol. 1999;9:561–565. doi: 10.1016/S0959-4388(99)00018-5. [DOI] [PubMed] [Google Scholar]
- 26.Maletic-Savatic M, Malinow R, Svoboda K. Science. 1999;283:1923–1927. doi: 10.1126/science.283.5409.1923. [DOI] [PubMed] [Google Scholar]
- 27.Miyawaki A, Llopis J, Heim R, McCaffery J M, Adams J A, Ikura M, Tsien R Y. Nature (London) 1997;388:882–887. doi: 10.1038/42264. [DOI] [PubMed] [Google Scholar]
- 28.McBain C J, Boden P, Hill R G. J Neurosci Methods. 1989;27:35–49. doi: 10.1016/0165-0270(89)90051-4. [DOI] [PubMed] [Google Scholar]
- 29.Siebler M, Koller H, Stichel C C, Muller H W, Freund H J. Synapse. 1993;14:203–213. doi: 10.1002/syn.890140304. [DOI] [PubMed] [Google Scholar]
- 30.Neuhoff H, Roeper J, Schweizer M. Eur J Neurosci. 1999;11:4241–4250. doi: 10.1046/j.1460-9568.1999.00856.x. [DOI] [PubMed] [Google Scholar]
- 31.Huang Y Y, Colino A, Selig D K, Malenka R C. Science. 1992;255:730–733. doi: 10.1126/science.1346729. [DOI] [PubMed] [Google Scholar]
- 32.Rosenmund C, Westbrook G L. Neuron. 1993;10:805–814. doi: 10.1016/0896-6273(93)90197-y. [DOI] [PubMed] [Google Scholar]
- 33.Petrozzino J J, Pozzo Miller L D, Connor J A. Neuron. 1995;14:1223–1231. doi: 10.1016/0896-6273(95)90269-4. [DOI] [PubMed] [Google Scholar]
- 34.Wickens J. Prog Neurobiol. 1988;31:507–528. doi: 10.1016/0301-0082(88)90013-5. [DOI] [PubMed] [Google Scholar]
- 35.Emptage N, Bliss T V, Fine A. Neuron. 1999;22:115–124. doi: 10.1016/s0896-6273(00)80683-2. [DOI] [PubMed] [Google Scholar]
- 36.Larson J, Wong D, Lynch G. Brain Res. 1986;368:347–350. doi: 10.1016/0006-8993(86)90579-2. [DOI] [PubMed] [Google Scholar]
- 37.Gomperts S N, Rao A, Craig A M, Malenka R C, Nicoll R A. Neuron. 1998;21:1443–1451. doi: 10.1016/s0896-6273(00)80662-5. [DOI] [PubMed] [Google Scholar]
- 38.Isaac J T, Nicoll R A, Malenka R C. Neuron. 1995;15:427–434. doi: 10.1016/0896-6273(95)90046-2. [DOI] [PubMed] [Google Scholar]
- 39.Najm I, Vanderklish P W, Lynch G, Baudry M. Brain Res Dev Brain Res. 1991;63:287–289. doi: 10.1016/0165-3806(91)90088-z. [DOI] [PubMed] [Google Scholar]
- 40.Sheppard A, Wu J, Bahr B A, Lynch G. Synapse. 1991;9:231–234. doi: 10.1002/syn.890090310. [DOI] [PubMed] [Google Scholar]
- 41.Potter D A, Tirnauer J S, Janssen R, Croall D E, Hughes C N, Fiacco K A, Mier J W, Maki M, Herman I M. J Biol Chem. 1998;141:21265–21275. doi: 10.1083/jcb.141.3.647. [DOI] [PMC free article] [PubMed] [Google Scholar]
- 42.Oshima M, Koizumi S, Fujita K, Guroff G. J Biol Chem. 1989;264:20811–20816. [PubMed] [Google Scholar]
- 43.Lynch G, Seubert P. Ann N Y Acad Sci. 1989;568:171–180. doi: 10.1111/j.1749-6632.1989.tb12505.x. [DOI] [PubMed] [Google Scholar]


