Abstract
This paper presents a numerical study on the transport of ions and ionic solution in human corneas and the corresponding influences on corneal hydration. The transport equations for each ionic species and ionic solution within the corneal stroma are derived based on the transport processes developed for electrolytic solutions, whereas the transport across epithelial and endothelial membranes is modelled by using phenomenological equations derived from the thermodynamics of irreversible processes. Numerical examples are provided for both human and rabbit corneas, from which some important features are highlighted.
Keywords: corneal swelling, hydration, ionic transport, electrolyte, thermodynamics
1. Introduction
The cornea is a transparent tissue that is highly specialized to refract and transmit light. Corneal transparency is heavily dependent upon the regulation of normal stromal hydration. Isolated stromal tissues swell freely in isotonic saline and become opaque, while the in vivo corneas remain thin and clear. How the limiting membranes control the stromal hydration and thus maintain the hydrophilic stroma in a state of relative deturgescence is one of the most interesting questions in corneal physiology (Ruberti & Klyce 2003).
Modelling of corneal swelling and its interaction with its environment is critical to our understanding of corneal function, particularly when important physiological parameters are refractory to experimental investigation. For the cornea, endothelial membrane transport parameters are difficult to access directly, because the membrane cannot be separated atraumatically from the underlying stromal tissue. Thus, development of an effective stromal transport model could help isolate the transport properties of the endothelial membrane from those of the stroma. Considerable efforts have been made in past decades for developing dynamic models to simulate the whole corneal transport system and to describe how the stroma and limiting layers interact to control stromal hydration (Ruberti & Klyce 2002). These models can be generally divided into two groups. The first group is the transport model (e.g. Stanley et al. 1966; Friedman 1973; Klyce & Russell 1979; Ruberti 1999; Li et al. 2004) in which the increase or decrease of stromal thickness at a particular point was determined based on the increase or decrease of the water volume at that point. The latter was calculated based on assumed stromal transport models for the flow of ions and ionic solution together with assumed boundary conditions for the flow of ions and ionic solution across epithelial and endothelial membranes. The second group is the triphasic model based on the poroelastic theory (Lai et al. 1991) in which the solid matrix is regarded as a linear isotropic elastic material and the corneal swelling is considered to be governed by the transport of ions in the electrolyte within the poroelastic medium controlled by the coupled electrochemical and mechanical processes (Bryant & McDonnell 1998). The volume change of the cornea is thus related to both the fluid flow and the elastic deformation of the corneal matrix. However, though this triphasic model is well grounded with regard to the fundamental processes responsible for transport of fluid and ions in the cornea, the model itself is actually static and is, therefore, incapable of performing dynamic simulations of the corneal response to external osmotic perturbations (Ruberti & Klyce 2002).
The work presented in this paper is the further development of our previous model (Li et al. 2004) by considering the interactions between ionic species and ions and ionic solution when they are in transport within the corneal stroma and across the epithelial and endothelial membranes. The transport equations for each ionic species and ionic solution within the corneal stroma are derived based on the transport processes developed for electrolytic solutions, whereas the transport across epithelial and endothelial membranes is modelled by using phenomenological equations derived based on the thermodynamics of irreversible processes.
2. Brief review of corneal structure
Geometrically, the human cornea can be approximately regarded as a spherical cap with a variable thickness. The base diameter of the cornea is about 12 mm and the average radius of curvature in the corneal central region is about 7.8 mm. The thickness of the cornea is roughly 0.52 mm at its centre and 0.65 mm in the periphery. The diffusion distance from the periphery to the corneal centre is over 6 mm, which is more than 10 times that from the posterior to the anterior at the centre (0.52 mm). Thus, it is clear that as far as the transport is concerned, the cornea can be modelled as a one-dimensional tissue in the anterior-to-posterior direction.
In the aspect of corneal structure and material, the human cornea is comprised of an outer stratified squamous non-keratinized epithelium, an inner connective tissue stroma with resident keratocytes and a low cuboid endothelium. All of the three layers have a uniform and consistent arrangement throughout the tissue (Gipson 1994).
The epithelium has five to seven cell layers, approximately 40 μm thick and is located at the outside surface of the cornea. The epithelium is extraordinarily regular in thickness over the entire cornea and it has an absolutely smooth, wet, apical surface that serves as the major refractive surface of the eye. The cell layers of the epithelium include three to four outer flattened squamous cells; one to three layers of mid-epithelial cells; and a single layer of columnar basal cells. The functions of the corneal epithelium include providing a barrier between the environment and the stroma of the cornea and, through its interaction with the tear film, forming a smooth refractive surface on the cornea. The epithelial barrier is formed as the epithelial cells move from the basal layer to the surface of the cornea, progressively differentiating until the superficial cells form two layers of flattened cells encircled by tight junctions, which serve as a semi-permeable, high-resistance membrane. This barrier prevents the movement of fluid from the tears into the stroma and also protects the eye from the penetration of tear-borne pathogens. In physiology, the epithelium also has the ability to actively transport chloride ions from the stroma to the tears, which assists the corneal endothelium in the regulation of stromal hydration and thereby contributes to the maintenance of corneal transparency (Klyce & Russell 1979; Klyce & Crosson 1985).
The human corneal stroma is the middle connective tissue layer that is approximately 500 μm thick and forms the bulk of or about 90% of the corneal thickness. The stroma is arranged in three clearly defined layers of extracellular matrix. These include: bordering the epithelium, the 8–10 μm Bowman's layer; the middle lamellar stroma, which comprises by far the major portion of the stroma and adjacent to the endothelium, the 8–12 μm Descemet's membrane, the thickened basement membrane secreted by the corneal endothelium (Gipson 1994). The lamellar stroma is the major layer of the stroma and is comprised of 300–500 sheets formed from flattened bundles of collagen fibrils oriented in a parallel manner. Each lamella is about 2–3 mm broad and about 1.5–2.5 μm thick and is comprised of long collagen fibrils embedded in a matrix containing proteoglycans which is highly hydrated (Maurice 1988; Daxer et al. 1998). The mean diameters of the fibrils in the corneal stroma are in the range between 22 and 32 nm (Pinsky & Datye 1991; Doughty & Bergmanson 2005). The stroma meshes with the surrounding scleral connective tissue to form a rigid framework for maintaining intraocular pressure and, thus, alignment of the optic pathways, although it has very weak rigidity in its thickness direction and can swell to several times its normal hydration in the absence of active maintenance by the epithelium and endothelium.
The corneal endothelium is a thin monolayer of hexagonal cells that forms the posterior corneal surface. The thickness of the endothelium is about 4 μm, which is 10 times thinner than that of the epithelium. Compared to the epithelium, which is a semi-permeable, ‘tight’ barrier, the endothelium is a permeable, ‘leaky’ barrier that restricts the movement of water and solutes into the hydrophilic stroma. The primary function of the endothelium is corneal dehydration. For a normal cornea, hydration is maintained at 78% water (by weight). Since fluid and solutes are continuously driven into the stroma by stromal swelling and imbibition pressures, the maintenance of corneal thickness and transparency is dependent on the active removal of fluid that leaks into the stroma. It has been thought that this is due to the attribution of the corneal endothelium, that is the so-called pump-leak hypothesis. Although the exact mechanism of the endothelial pump is not completely understood, the effect of endothelial ion transport resulting in net fluxes of sodium and bicarbonate ions from stroma to aqueous humour has been confirmed in experiments (Edelhauser et al. 1994). Corneal endothelial carbonic anhydrase, which catalyses the conversion of carbon dioxide and water into bicarbonate and hydrogen ions, is believed to provide an important source of bicarbonate for the endothelial pump (Bonanno 2003).
3. Electrolytic transport model in corneal stroma
The transport model described below is similar to those proposed by Klyce & Russell (1979) and Li et al. (2004), which is a three-compartment, one-dimensional model used to predict the change of stromal thickness in response to the concentration changes applied to corneal epithelium and/or endothelium (see figure 1). However, since the solution considered here is a multi-component solution, the governing equations for both ions and ionic solution are derived based on the transport processes in electrolytic solutions, which is different from those early developed models.
Figure 1.
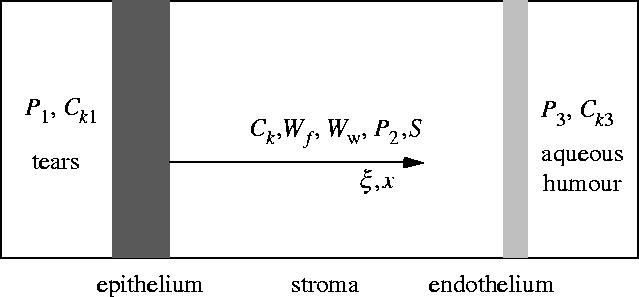
A two-membrane, three-compartment flow model for the cornea.
The governing equations describing the transport of ionic solution and ionic species in corneal stroma can be derived in terms of the mass conservation (Li et al. 2004)
| (3.1) |
| (3.2) |
where Wf in g g−1 is the mass of the solution in unit mass of dry tissue material, t in s is the time, ρf in g cm−3 is the density of the solution, Jf in cm3 (s cm2)−1 is the volume flux of the solution flowing in unit time through unit area in the thickness direction, ξ in cm is the thickness coordinate of the dry tissue material, ρd in g cm−3 is the density of the dry tissue material, Ck in mole cm−3 is the concentration of species k, Jk in mole (s cm2)−1 is the molar flux of species k flowing in unit time through unit area in the thickness direction. The index f stands for ionic solution and index k (k=1, 2, …, M) represents species k and M is the total number of species involved in the solution. Equations (3.1) and (3.2) represent the well-known mass conservation in the unit mass of dry tissue material for the solution and for species k, respectively.
The volume flux of the solution can be simply assumed to be the contribution of convection, which is given by
| (3.3) |
where v in cm s−1 is the velocity of convective flow. The molar flux of species k can be expressed in the form of the Nernst–Planck equation as follows (Newman 1973):
| (3.4) |
where zk is the charge number of species k, Dk in cm2 s−1 is the diffusion coefficient of species k, F=96 485 C mole−1 is the Faraday constant, R=8.314 J (mole K)−1 is the universal gas constant, T in K is the absolute temperature, ϕ in V is the electrostatic potential, x in cm is the transient thickness coordinate, which has the following relationship with the thickness coordinate ξ in dry tissue material
| (3.5) |
Note that for charged ions the molar fluxes of species should satisfy the conservation equation of current, which is expressed by
| (3.6) |
where I in A cm−2 is the current density. Substituting equation (3.4) into (3.6) and noting that because of the electro-neutrality, yields
| (3.7) |
Substituting equations (3.5) and (3.7) into (3.4) yields
| (3.8) |
where is the new diffusion coefficient defined as follows:
| (3.9) |
According to the Darcy law, the velocity of the convective flow in the corneal stroma is negatively proportional to the local gradient of hydrostatic pressure, i.e.
| (3.10) |
where Kμ in cm4 (s dyn)−1 is the flow conductivity coefficient and P in dyn cm−2 is the local hydrostatic pressure, which is calculated as follows (Fatt & Goldstick 1965)
| (3.11) |
where IOP=2.67×10⁴ dyn cm−2 is the intraocular pressure, S in dyn cm−2 is the stromal swelling pressure, γ=2.41×10⁶ dyn cm−2 is the empirical constant and Ww is the stromal hydration which is defined as the mass of water in unit mass of dry tissue material. Substituting equations (3.10) and (3.11) into (3.3) yields
| (3.12) |
For dilute solutions for which it can be assumed that , the following equations can be obtained to determine Ww and ρf:
| (3.13) |
where Cw in mole cm−3 is the concentration of water (solvent), υw=18 cm3 mole−1 is the partial molar volume of water, mw=18 g mole−1 is the molar mass of water, mj in g mole−1 is the molar mass of species j, ρw=1 g cm−3 is the density of water.
For given initial conditions and boundary conditions, equations (3.1) and (3.2) can be used to determine Wf and Ck, in which Jf and Jk are defined by equations (3.8) and (3.12), Ww and ρf are defined by equation (3.13).
4. Electrolytic transport model at epithelial and endothelial membranes
Note that the flux expressions given by equations (3.8) and (3.12) are only applicable to the corneal stroma. For the epithelial and endothelial membranes, the flux expressions for ionic solution and ionic species can be obtained from the theory of irreversible thermodynamics (Kedem & Katchalsky 1958; Li 2004). By assuming that the epithelial and endothelial membranes are the infinitely thin uniform film, the following volume flux for ionic solution and molar flux for species k can be obtained
| (4.1) |
| (4.2) |
where Lp in cm3 (dyn s)−1 is the hydraulic conductivity coefficient, ΔP in dyn cm−2 is the hydrostatic pressure difference on the two sides of the membrane, σk is the reflection coefficient of species k, ΔCj in mole cm−3 is the concentration difference of species j on the two sides of the membrane, Δϕ in V is the electrostaic potential difference on the two sides of the membrane, ωk in mole (dyn s)−1 is the permeability coefficient of species k, Jak in mole (s cm2)−1 is the active pump rate of species k. The sign convention used in equations (4.1) and (4.2) is defined as follows. Net fluxes of solution and solutes from outside to inside are taken as positive. The difference in solute concentration across the membrane is calculated by the outside concentration minus the inside one. Differences of hydrostatic and osmotic pressures are defined in a similar manner.
Again, the fluxes of species across the membrane should satisfy equation (3.6) from which the electrostatic potential gradient across the membrane can be eliminated. Thus, equations (4.1) and (4.2) become (Li 2004)
| (4.3) |
| (4.4) |
in which
where are the new membrane coefficients, and are the new volume flux of solution and new molar flux of species k, which are generated by the active pump rates. Note that these new coefficients are concentration dependent. The reason for this is because the fluxes can be generated by the hydrostatic pressure difference, the concentration difference or the electrostatic potential difference. Equations (4.3) and (4.4) are obtained by eliminating the electrostatic potential item using the condition of electro-neutrality. This is equivalent to absorb the electrostatic potential item into the membrane coefficients to form the new membrane coefficients. It is also interesting to note from equation (4.3) that the active pump rate may have direct contribution to the volume flux if . In past models, the ionic solution was assumed as an equal binary solution for which . Therefore, the counterbalance was actually provided by the concentration gradient, which, of course, is created by the active pump. However, in the present multi-component model, the active pumps not only provide the concentration gradient, but also directly contribute to the volume flow as is demonstrated in equation (4.3).
Equations (4.3) and (4.4) provide the flux boundary conditions of the mass transport equations (3.1) and (3.2) for the ionic solution and ionic species. If the thickness changes of the epithelial and endothelial membranes are negligible then the change of the corneal thickness can be calculated purely based on the change of the corneal stroma thickness as follows (Hedbys & Mishima 1966):
| (4.5) |
where Δh in cm is the change of corneal thickness, ξmax in cm is the thickness of the dry corneal stroma, ρf0 in g cm−3 is the initial density of the solution, Wf0 and Ww0 are the initial masses of solution and water in the unit mass of dry tissue material, respectively.
5. Numerical results
For given initial conditions (such as initial ionic concentrations and initial hydration in stroma) and boundary conditions (ionic concentrations and hydrostatic pressures in tears and aqueous humour), one can solve partial differential equations (3.1) and (3.2) using finite element methods to obtain the hydration distribution, Ww, and then use equation (4.5) to obtain the thickness variation, Δh. Figure 2 shows the comparison of the present model predictions and Fischbarg's experimental data (1973) obtained from the tests of rabbit corneas. Since in Fischbarg's experiments the bare anterior stroma (epithelium) was covered with silicone oil and the osmotic perturbations of NaCl solution were applied only to the endothelial surface, the fluxes in the numerical simulation defined at the epithelium for both solution and solutes were assumed as zero, whereas the fluxes at the endothelium were assumed to be described by equations (4.3) and (4.4). The parametric values employed in the numerical simulation for this equal binary solution are the same as those used in our previous paper (Li et al. 2004) and thus are not given again here. It can be seen from the figure that the predicted thickness response is in good agreement with the experimental data.
Figure 2.
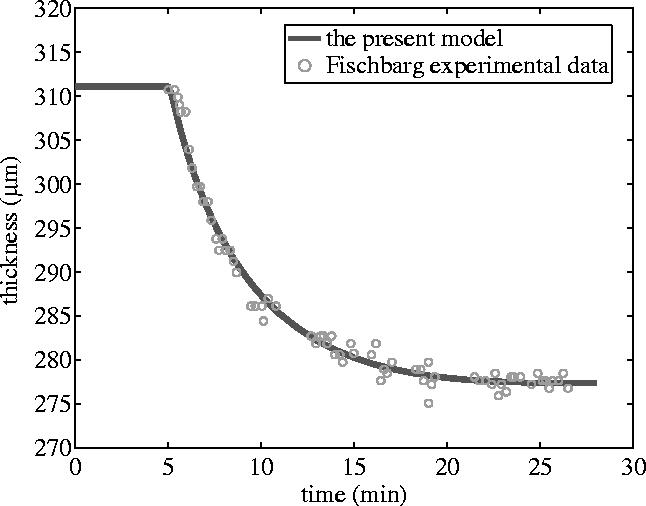
Stromal thickness response to the perfusion with 30 mOsm NaCl hypertonic solution applied to the endothelium of the rabbit cornea while the epithelial surface was blocked. The continuous calculated line was shifted temporally to mach the onset of the thinning.
Under normal in vivo physiological conditions, there is no net fluid transport since the fluid into the cornea driven by the stromal swelling pressure is exactly counterbalanced by the active secretion of fluid out of the cornea. This is the so-called ‘pump-leak’ mechanism hypothesis for maintenance of corneal hydration and transparency (Maurice 1972). It has been several decades since the hypothesis was first made. However, so far it is still not clear about which species are responsible for generating such a fluid pump leak and which species are capable of providing active pump fluxes. In literature, it has been suggested that the endothelial pump leak involves complicated ionic exchanges (such as Na+/H+ and Cl−/HCO3−) and ion cotransport (such as Na+/HCO3− and K+/HCO3−, Na+/K+/2Cl−) (Lane et al. 1997; Bonanno 2003). However, there is no quantitative model available to describe how these ionic species are interrelated and interact on each other (Kuang et al. 2004). Therefore, in the following numerical examples, the active pump rates are simply assumed.
The dominant ionic species found in tears and in aqueous humour are Na+, K+, Cl− and HCO3−. It is probably reasonable to assume these species of constant concentrations, because the volumes of tears and aqueous humour are much greater than the stromal volume. The initial concentrations of Na+, K+, Cl− and HCO3− are assumed to be uniform in the corneal stroma, the values of which together with other parametric values used in the following numerical study are given in table 1. The parametric values, which are either independent of the ionic species or only related to chloride ions, are taken from literature (Klyce & Russell 1979). The parametric values, which are related to other than chloride ions, are calculated based on the relative ratios of their diffusion coefficients to the chloride ion's diffusion coefficient.
Table 1.
Parametric values employed in the numerical studies for figures 3–6. (ρd=1.49 g cm−3 and ξmax=0.007 cm.)
| parameter | Na+ | K+ | Cl− | HCO3− |
|---|---|---|---|---|
| zk, charge number | 1 | 1 | −1 | −1 |
| mk, molar mass (g mole−1) | 11 | 19 | 17 | 31 |
| Ckb, concentration in tears (mole cm−3) | 130×10−6 | 15×10−6 | 110×10−6 | 35×10−6 |
| Lp, hydraulic conductivity coefficient at epithelium (cm3 (s dyn)−1) | 5.8×10⁻¹² a | |||
| σk, reflection coefficient at epithelium | 0.800 a | 0.610 b | 0.580 b | 0.800 b |
| RTωk, permeability coefficient at epithelium (cm s−1) | 0.99×10⁻⁷ b | 1.45×10⁻⁷ b | 1.50×10⁻⁷ a | 0.82×10⁻⁷ b |
| Jk, active pump rate at epithelium (mole (s cm2)−1) | 0 | 0 | −1.2×10⁻¹¹ a,c | 0 |
| P1, hydrostatic pressures in tears (dyn cm−2) | 0 | |||
| Ck0, initial concentration in stroma (mole cm−3) | 145×10−6 | 15×10−6 | 120×10−6 | 40×10−6 |
| Ww0, initial stromal hydration | 3.40 | |||
| Kμ, flow conductivity coefficient in stroma (cm2 (s dyn)−1) | 8.63×10⁻¹⁵Ww4 a | |||
| Dk0, diffusion coefficient in stroma (cm2 s−1) | ||||
| 0.591×10⁻⁵ b | 0.867×10⁻⁵ b | 0.900×10⁻⁵ a | 0.489×10⁻⁵ b | |
| Ckb, concentration in aqueous humour (mole cm−3) | 135×10−6 | 10×10−6 | 110×10−6 | 35×10−6 |
| Lp, hydraulic conductivity coefficient at endothelium (cm3 (s dyn)−1) | 53×10−12 a | |||
| σk, reflection coefficient at endothelium | 0.685 b | 0.467 b | 0.450 a | 0.828 b |
| RTωk, permeability coefficient at endothelium (cm s−1) | 5.25×10⁻⁵ b | 7.71×10⁻⁵ b | 8.00×10⁻⁵ a | 4.35×10⁻⁵ b |
| Jk, active pump rate at endothelium (mole (s cm2)−1) | 0 | 0 | 0 | −4.0×10⁻¹⁰ a,d |
| P3, hydrostatic pressures in aqueous humour (dyn cm−2) | l2.67×104 a |
Value taken from Klyce & Russell (1979).
Value calculated from diffusion coefficient ratio.
Value is zero in figure 5.
Value is zero in figure 6.
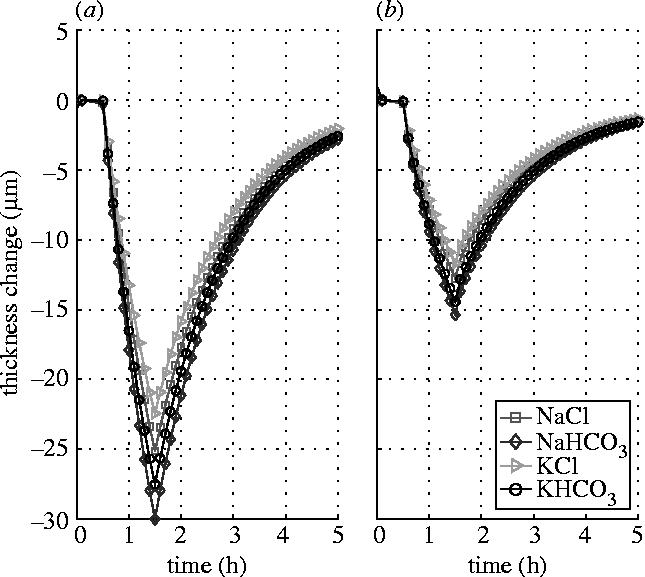
Figure 3 shows the responses of the stromal thickness to the shocks of 15 mOsm NaCl, NaHCO3, KCl and KHCO3 hypertonic solutions applied (after the steady state has been reached) to the endothelial surface for an hour duration, while the epithelial surface is either blocked (figure 3a) or left intact (figure 3b). The results show that the responses of the stromal thickness are different to the solutions of different solutes although in terms of the concentration they are actually identical. The greatest change in thickness is found to the solution of NaHCO3 for which the permeability coefficients are the smallest and the reflection coefficients are the largest. While the least change is found to the solution of KCl for which the permeability coefficients are the largest and the reflection coefficients are the smallest. The influence of the epithelial flow on the stromal thickness response to endothelial perfusion appears remarkable. When the epithelial surface is left intact and functioning, the thickness reverse becomes much quicker and also much greater.
Figure 3.
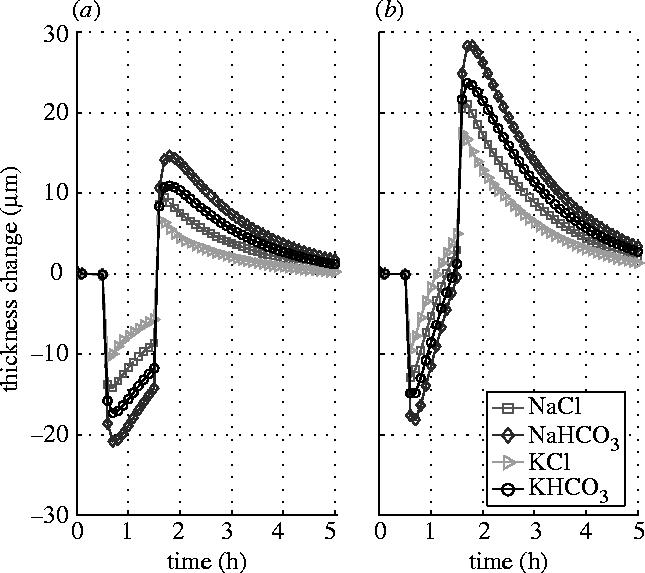
Stromal thickness responses to the shocks of 15 mOsm NaCl, NaHCO3, KCl and KHCO3 hypertonic solutions applied to the endothelial surface. (a) Epithelial surface is blocked. (b) Epithelial surface is left intact.
Figure 4 shows the responses of the stromal thickness to the same shocks but applied at the epithelial surface, while the endothelial surface is either blocked (figure 4a) or left intact (figure 4b). The results show that the stromal thickness response to the epithelial perfusion is rather slow compared to those shown in figure 3. Significant reduction in stromal thickness changes is found when the endothelium is left intact and functioning. This indicates that the endothelium is able to alleviate the stromal thickness change when the corneal is subjected to a perfusion disturbance from the epithelial side.
Figure 4.
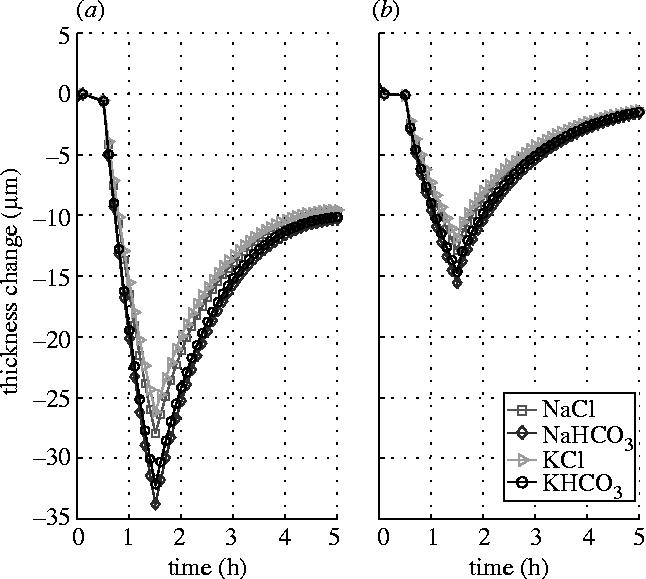
Stromal thickness responses to the shocks of 15 mOsm NaCl, NaHCO3, KCl and KHCO3 hypertonic solutions applied to the epithelial surface. (a) Endothelial surface is blocked. (b) Endothelial surface is left intact.
The effect of the active pump rate provided by ionic species in the epithelial layer is examined by using zero pump rates. Figure 5 shows the results in which the ionic pump rate for Cl− in the epithelial layer is set to zero. It is found that the stromal thickness response pattern in figure 4 is similar to that shown in figure 5. It is seen that when the endothelial surface is left intact there is almost no difference between figures 4b and 5b. The reason for this is probably partly because the value of the pump rate in the epithelial layer (figure 4) is small and partly because both the hydraulic conductivity and permeability coefficients of the epithelial membrane are very small compared to those of the endothelial membrane. The latter leads the stroma to have a slow response to the shock applied to the epithelial surface. This is why the stroma has different response patterns to the shocks applied to the epithelial and endothelial surfaces. However, when the endothelial surface is blocked, the pump rate does have some influence on the thickness responses, particularly on the reversal of the response curves. The comparison of figures 4a and 5a shows that when the active pump rate provided by Cl− is considered more thickness reduction can be achieved.
Figure 5.
Stromal thickness responses to the shocks of 15 mOsm NaCl, NaHCO3, KCl and KHCO3 hypertonic solutions applied to the epithelial surface (Ja3=0). (a) Endothelial surface is blocked. (b) Endothelial surface is left intact.
In contrast, the effect of the active pump rate provided by ionic species in the endothelial layer appears very significant. Figure 6 shows the responses of the stromal thickness to the same shocks applied to the endothelial surface while the endothelial ionic pump rate is set to zero. The figure shows that, when the bicarbonate pump is tuned off, the stromal thickness responses are about double in magnitude when compared to the same shock with the pump on (see figure 3). Also, when the pump is tuned off, there is almost no recovery in the response curves after the reversal. The former is because the corneas have different states when applying shocks, although their initial states are the same (see table 1). Since the shocks are applied after the same certain time from the same initial state, the ionic concentrations and swelling pressure are different for the two cases because of the influence of the active pump. While the latter is simply due to the function of the swelling pressure that keeps water flowing into the stroma, which is demonstrated by the response curve that has the same slope at places before and after the shock.
Figure 6.
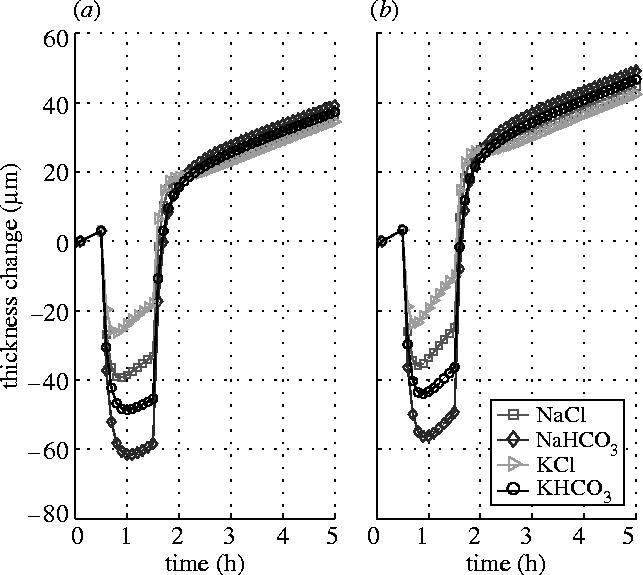
Stromal thickness responses to the shocks of 15 mOsm NaCl, NaHCO3, KCl and KHCO3 hypertonic solutions applied to the endothelial surface (Ja4=0). (a) Epithelial surface is blocked. (b) Epithelial surface is left intact.
Parametric study of the dynamic transport model on the cornea hydration has shown that, though reasonable in magnitude and in general shape, the model with using a standard set of fixed membrane transport coefficients cannot adequately describe the actual corneal response found in experiments, unless the membrane coefficients are allowed to change at the time of the perturbation and reversal (Ruberti & Klyce 2003). It is interesting to note from the present results, figure 3, for example, that the stromal responses are different to the shocks with different solutes, although each has the same concentration. Assume that there exist ionic exchanges between Na+ and H+ and between Cl− and HCO3− in the endothelial layer as it is suggested (Bonanno 2003). This implies that the initial shock of NaCl at the outside surface of the layer could become NaHCO3 and HCl when it comes to the inside surface of the layer or vice versa. If this were indeed happened, the variation of the corneal thickness could be modulated by 30%.
6. Conclusions
A computational model of the corneal hydration has been proposed for simulating the response of the corneal thickness to the perfusion with hypotonic or hypertonic solutions. The transport equations for each ionic species and ionic solution within the corneal stroma are derived based on the transport processes developed for electrolytic solutions, whereas the transport across epithelial and endothelial membranes is modelled by using phenomenological equations derived from the thermodynamics of irreversible processes. The influence of the flow across the epithelium and endothelium on the stromal thickness response has been investigated. The role of the ionic active pumps in epithelial and endothelial layers has also been examined. The present numerical examples are based on a number of assumed parametric values which are not available. The encouraging results found with present model suggest that further development of theoretical models and experimental methods that can be used to determine these parametric values will be very useful. The present model provides a starting point to simulate the complicated transport process of the human cornea involving ionic cotransports and ionic exchanges taking place in the epithelial and/or endothelial layers.
References
- Bonanno J.A. Identity and regulation of ion transport mechanisms in the corneal endothelium. Prog. Retin. Eye Res. 2003;22:69–94. doi: 10.1016/S1350-9462(02)00059-9. [DOI] [PubMed] [Google Scholar]
- Bryant M.R, McDonnell P.J. A triphasic analysis of corneal swelling and hydration control. J. Biomech. Eng. 1998;120:370–381. doi: 10.1115/1.2798004. [DOI] [PubMed] [Google Scholar]
- Daxer A, Misof K, Grabner B, Ettl A, Fratzl P. Collagen fibrils in the human corneal stroma: structure and aging. Invest. Ophthalmol. Vis. Sci. 1998;39:644–648. [PubMed] [Google Scholar]
- Doughty M.J, Bergmanson J.P.G. Resolution and reproducibility of measures of the diameter of small collagen fibrils by transmission electron microscopy—application to the rabbit corneal stroma. Micron. 2005;36:331–343. doi: 10.1016/j.micron.2005.01.003. [DOI] [PubMed] [Google Scholar]
- Edelhauser H.F, Geroski D.H, Ubels J.L. Physiology. In: Smolin G, Thoft R.A, editors. The cornea. Little, Brown and Company; Boston: 1994. pp. 25–46. [Google Scholar]
- Fatt I, Goldstick T. Dynamics of water transport in swelling membranes. J. Colloid Sci. 1965;20:962–989. doi: 10.1016/0095-8522(65)90068-1. [DOI] [PubMed] [Google Scholar]
- Fischbarg J. Active and passive properties of the rabbit corneal endothelium. Exp. Eye Res. 1973;15:615–638. doi: 10.1016/0014-4835(73)90071-7. [DOI] [PubMed] [Google Scholar]
- Friedman M.H. Unsteady aspects of corneal thickness control. Exp. Eye Res. 1973;15:645–658. doi: 10.1016/0014-4835(73)90073-0. [DOI] [PubMed] [Google Scholar]
- Gipson I.K. Anatomy of the conjunctiva, cornea, and limbus. In: Smolin G, Thoft R.A, editors. The cornea. Little, Brown and Company; Boston: 1994. pp. 3–24. [Google Scholar]
- Hedbys B.O, Mishima S. The thickness–hydration relationship of the cornea. Exp. Eye Res. 1966;5:221–228. doi: 10.1016/s0014-4835(66)80010-6. [DOI] [PubMed] [Google Scholar]
- Kedem O, Katchalsky A. Thermodynamic analysis of the permeability of biological membranes to non-electrolytes. Biochim. Biophys. Acta. 1958;27:229–246. doi: 10.1016/0006-3002(58)90330-5. [DOI] [PubMed] [Google Scholar]
- Klyce S.D, Crosson C.E. Transport processes across the rabbit corneal epithelium: a review. Curr. Eye Res. 1985;4:323–331. doi: 10.3109/02713688509025145. [DOI] [PubMed] [Google Scholar]
- Klyce S.D, Russell S.R. Numerical solution of coupled transport equations applied to corneal hydration dynamics. J. Physiol. 1979;292:107–134. doi: 10.1113/jphysiol.1979.sp012841. [DOI] [PMC free article] [PubMed] [Google Scholar]
- Kuang K, Li Y, Yiming M, Sanchez J.M, Iserovich P, Cragoe E.J, Diecke F.P, Fischbarg J. Intracellular [Na+], Na+ pathways and fluid transport in cultured bovine corneal endothelial cells. Exp. Eye Res. 2004;79:93–103. doi: 10.1016/j.exer.2004.02.014. [DOI] [PubMed] [Google Scholar]
- Lai W.M, Hou J.S, Mow V.C. A triphasic theory for the swelling and deformation behaviours of articular cartilage. J. Biomech. Eng. 1991;113:245–258. doi: 10.1115/1.2894880. [DOI] [PubMed] [Google Scholar]
- Lane J.R, Wigham C.G, Hodson S.A. Determination of Na+/Cl−, Na+/HCO3− and Na+/K+/2Cl− cp-transporter activity in corneal endothelial cell plasma membrane. Biochim. Biophys. Acta. 1997;1328:237–242. doi: 10.1016/s0005-2736(97)00101-6. [DOI] [PubMed] [Google Scholar]
- Li L.Y. Transport of multicomponent ionic solutions in membrane systems. Phil. Mag. Lett. 2004;84:593–599. doi: 10.1080/09500830512331325767. [DOI] [Google Scholar]
- Li L.Y, Tighe B.J, Ruberti J.W. Mathematical modeling of corneal swelling. Biomech. Model. Mechanobiol. 2004;3:114–123. doi: 10.1007/s10237-004-0054-7. [DOI] [PubMed] [Google Scholar]
- Maurice D.M. The location of the fluid pump in the cornea. J. Physiol. 1972;221:43–54. doi: 10.1113/jphysiol.1972.sp009737. [DOI] [PMC free article] [PubMed] [Google Scholar]
- Maurice D.M. Mechanics of the cornea. In: Cavanagh D.H, editor. The cornea; Trans. World Congr. on Cornea III. Raven Press; New York: 1988. pp. 187–193. [Google Scholar]
- Newman J.S. Prentice-Hall; Englewood Cliffs, NJ: 1973. Electrochemical systems. [Google Scholar]
- Pinsky P.M, Datye D.V. A microstructurally-based finite element model of the incised human cornea. J. Biomech. 1991;24:907–922. doi: 10.1016/0021-9290(91)90169-N. [DOI] [PubMed] [Google Scholar]
- Ruberti, J. W. 1999 Experimental and computational investigation of corneal transport properties. Ph.D. thesis, Tulane University, USA.
- Ruberti J.W, Klyce S.D. Physiology system models of the cornea. In: Hung G.K, Ciuffreda K.J, editors. Models of the visual system. Kluwer Academic/Plenum Publishers; New York: 2002. pp. 3–56. [Google Scholar]
- Ruberti J.W, Klyce S.D. NaCl osmotic perturbation can modulate hydration control in rabbit cornea. Exp. Eye Res. 2003;76:349–359. doi: 10.1016/S0014-4835(02)00301-9. [DOI] [PubMed] [Google Scholar]
- Stanley J, Mishima S, Klyce S.D. In vivo determination of endothelial permeability to water. IOVS. 1966;7:371–377. [PubMed] [Google Scholar]


