Abstract
The purpose of this study was to develop a three-dimensional finite-element model (FEM) of the human orbit, containing the globe, to predict orbital deformation in subjects following a blunt injury. This study investigated the hypothesis that such deformation could be modelled using finite-element techniques. One patient who had CT-scan examination to the maxillofacial skeleton including the orbits, as part of her treatment, was selected for this study. A FEM of one of the orbits containing the globe was constructed, based on CT-scan images. Simulations were performed with a computer using the finite-element software NISA (EMRC, Troy, USA). The orbit was subjected to a blunt injury of a 0.5 kg missile with 30 m s−1 velocity. The FEM was then used to predict principal and shear stresses or strains at each node position. Two types of orbital deformation were predicted during different impact simulations: (i) horizontal distortion and (ii) rotational distortion. Stress values ranged from 213.4 to 363.3 MPa for the maximum principal stress, from −327.8 to −653.1 MPa for the minimum principal stress, and from 212.3 to 444.3 MPa for the maximum shear stress. This is the first finite-element study, which demonstrates different and concurrent patterns of orbital deformation in a subject following a blunt injury. Finite element modelling is a powerful and invaluable tool to study the multifaceted phenomenon of orbital deformation.
Keywords: finite-element analysis, orbit, blow-out fracture
1. Introduction
The morphology of a bone is influenced by its mechanical environment and loading history (Hylander 1977; Lanyon 1987; Al-Sukhun 2003). This also applies to the orbit, and several workers have suggested that the adaptive response of the primate orbit is reflected in its morphology (Ravosa et al. 2000). The patterns of stress and deformation occurred in the orbit may influence the biomechanics of internal fixation of orbital fractures especially when using implants, e.g. biodegradable, titanium miniplates and/or autogenous bone grafts to reconstruct the orbital floor. Although treatment of orbital fractures has a moderate success rate, the long term clinical significance of orbital deformation on implant treatment is still unknown. The possibility that orbital deformation and the resulting stresses may be a source of implant failure cannot be excluded. While intra-orbital techniques, i.e. strain gauges provide a ‘gold standard’ for measurements of stresses or forces, they are complex and unsuitable for clinical use. This problem, however, may be overcome by modelling techniques, such as the finite-element analysis (FEA).
Insights into orbital deformation or loading have been gained from measurements of regional surface strain in living macaques (Ravosa et al. 2000). The extent to which these observations can be extrapolated to human beings is uncertain because of the conspicuous differences in morphology and function between the species. Currently, the direct measurement of bone strain, using electrical strain gauges, in living human subjects is impractical. Photoelastic measurements have also been made on physical models of other bony structures such as the mandible (Ralph & Caputo 1975; Mongini et al. 1979; Standlee et al. 1981), but this technique is of limited quantitative value. As in the majority of experimental stress methods, its main disadvantage is that it is not appropriate for analysing strain under in vivo conditions. However, the method is non-destructive and enables the investigator to visualize the distribution of surface strains.
The commonest approach has been to use mathematical modelling, where it is a much easier task to specify the locations and orientations of putative muscle tension vectors in three-dimensional space. While few mathematical models were reported to investigate bony structures, e.g. mandible and femur, no attempts were made to build a mathematical model to study the deformation of the orbit. In these models, it has been assumed that the bone is a rigid structure, and as such behaves according to static equilibrium theory (Gysi 1921; Robinson 1946; Hylander 1975). Mathematical models necessarily assume structural rigidity and concentricity in the sagittal view, factors which complicate the analysis and limit their usefulness. Such restrictions encourage the development of models which are more representative of non-rigid, inhomogeneous structures, and which allow the simulation of wide areas of muscle attachment (Korioth & Versulis 1997; Al-Sukhun 2003). As an alternative, indirect mathematical approach, the finite-element modelling technique offers the advantage of being able to model structures with intricate shapes and indirectly quantify their complex mechanical behaviour at any theoretical point. Since the finite-element method uses the theories of elasticity and static equilibrium, the effects of multiple external forces acting on a system can be assessed as physical events in terms of deformations, stresses or strains. This study investigated the hypothesis that such deformation could be modelled using finite-element techniques.
2. Material and methods
One patient who had CT-scan examination to the maxillofacial skeleton including the orbits, as part of her treatment, was selected for this study. The patient gave her written consent to use the CT-scan images for medical research purposes. A finite-element model (FEM) of one of the orbits containing the globe was constructed, based on CT-scan images. Simulations were performed with a computer using the finite-element software NISA (EMRC, Troy, USA).
Building a FEM can be divided into two stages—geometric modelling and finite-element modelling.
2.1 Geometric modelling and material properties
The purpose of the geometric modelling stage is to represent geometry in terms of points (grids), lines, surfaces (patches) and volumes (hyper-patches). The geometry of the human orbit including the eye, fatty tissues and extra-ocular muscles was constructed, based on CT-scan images. CT was performed using a Siemens Somatom CR CT scanner (Siemens, Erlangen, Germany). Voltage was 125 kV, MAS 500, measuring time 7 s, projections 720. Sagittal and coronal slices perpendicular to the optic nerves of both eyes were obtained using a T1-weighted spin-echo (SE) sequence 600/15/3 (TR/TE/excitations). Coronal T2-weighted fat suppression sequences 1800/20/1/150 (TR/TE/excitations/FA) of the blow-out fracture eye were obtained. The slices were 2 mm thick, with a 0.2 mm gap between slices.
The material properties of the finite-element model of the orbital bone and graft were based on the measured X-ray attenuation coefficients. These coefficients (Hounsfield values) were directly converted into density values and then into elastic stiffness values on the basis of data reported by Carter & Hayes (1977). The material properties of the several components of the eye are summarized in table 1 and taken from studies by Power (2001) and Uchio et al. (2001, 2003). The lens was modelled as a rigid body, and the vitreous as a solid mass with hydrostatic pressure of 20 mm Hg (2.7 KPa). The cornea was loaded with the intra-ocular pressure on the posterior surface and with the atmospheric pressure on the anterior surface. The loading produced by the eyelids was ignored (Kobayashi et al. 1971; Uchio et al. 2003). The FEM was loaded with multiple force vectors to simulate muscle forces over wide areas of attachment as described by Al-Sukhun et al. (in press; tables 2 and 3). Groups of parallel vectors simulated four extra-ocular muscles (superior and inferior rectus muscles, medial and lateral rectus muscles and superior and inferior oblique muscles) assumed to be directly attached to the bone. The resultant vector of muscle force (Mir) for a particular muscle in isometric contraction during a specific movement could be given by the product
where Xmi is the cross-sectional area of muscle mi in cm2, K is a constant for skeletal muscle (expressed in N cm−2) and EMGmi is the ratio or scaled value of the muscle contraction relative to its maximum response for a specific task (Korioth & Versulis 1997; Al-Sukhun 2003; Al-Sukhun et al. in press). The product [Xmi·K] is referred to as the weighting factor given to the muscle mi (table 2) and the value EMGmi as its scaling factor (table 2). Upon multiplying the weighting factor of a particular muscle by its scaling factor we obtained Mir. The product of Mir and its corresponding unit vector yielded the orthogonal vector force components. These were subsequently proportioned between the nodes, which formed the corresponding area of muscular attachment (table 2). The mean values of the cross-sectional-areas and the angulation of each muscle in the sagittal and frontal plane were obtained using CT scan imaging technique (Siemens Somatom DR 2, Siemens GmbH, Munich, Germany). It was not possible to obtain these values for the superior and inferior oblique muscles. Therefore, it was decided to model the sup oblique muscle through the trochlea, fastened between the medial wall and roof of the orbit. The inferior oblique muscle was attached between the orbital floor and the sclera. Both were defined as 0.2 mm and assigned a tensile strength of 20 MPa. The initial approximation is supported by the high tensile strength reported for collagen and the large amount of collagen in these structures (Power 2001; Uchio et al. 2001, 2003).
Table 1.
Summary of material properties. (E, Young's modulus of elasticity; ν, Poisson's ratio.)
| structure | E (MPa) | ν | density (kg m−2) | source |
|---|---|---|---|---|
| cornea | nonlinear | — | 1400 | Uchio et al. (2001) |
| sclera | nonlinear | — | 1400 | Uchio et al. (2001) |
| ciliary body | 11.0 | 0.40 | 1600 | Power (2001) |
| fatty tissue | 0.047 | 0.49 | 999 | Power (2001) |
| vitreous | 0.042 | 0.49 | 999 | Power (2001) |
| aqueous | 0.037 | 0.49 | 999 | Power (2001) |
| lens | — | — | 315 | Power (2001) |
Table 2.
Number and magnitudes of muscle loads used in the FEM. (The number of nodes reflects the amount of vectors applied to the orbit or eye ball for each corresponding muscle. The x-, y- and z-coordinates represent the muscle loads (in Newton) and their three-dimensional directions. All coordinates are referenced to a global Cartesian coordinate system where the x–y plane is the frontal plane, x–z represents the horizontal plane and the y–z indicates the mid-sagittal plane.)
| muscle | muscle cross-section (CM2) | nodes | x | y | z |
|---|---|---|---|---|---|
| superior rectus | 1.15 | 19 | −0.06 | 0.18 | 0.06 |
| inferior rectus | 1.06 | 23 | 0.23 | 0.09 | 0.49 |
| medial rectus | 0.99 | 21 | 0.11 | −0.21 | −0.01 |
| lateral rectus | 1.16 | 22 | 0.12 | 1.33 | 0.59 |
Table 3.
Maximum stress values predicted by the FEM during all simulated orbital trauma.
| direction of the missile with a 30 m s−1 velocity | |||||
|---|---|---|---|---|---|
| maximum stress (MPa) | direct blunt injury | 45° upward | 45° downward | 45° right | 45° left |
| maximum principal | 333.3 | 363.3 | 355.4 | 219.9 | 270.9 |
| minimum principal | −555.4 | −653.1 | −558.9 | −327.8 | −380.1 |
| maximum shear | 421.1 | 444.3 | 410.2 | 290.8 | 210.3 |
2.2 Finite element modelling
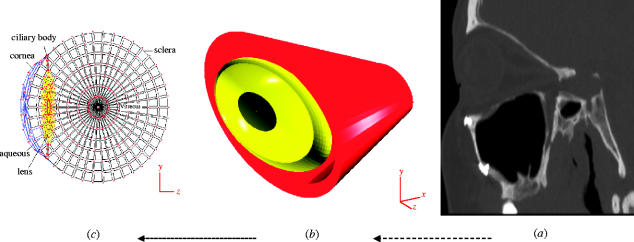
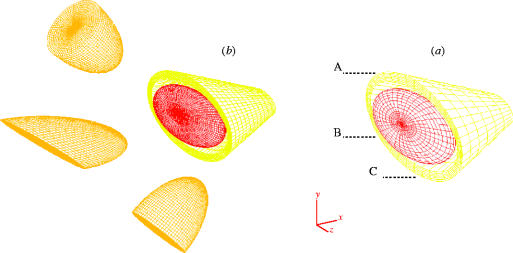
The geometric entities created in the previous step were mapped with finite-elements and nodes. The complete geometry is now defined as an assemblage of discrete pieces called elements, which are connected together at a finite number of points called nodes (figures 1 and 2). The mapping was performed with the semi-automatic option finite-element generation available in Display III (NISA, EMRC, Troy, USA). The mesh volumes of the bony orbit, vitreous and fatty tissues were subdivided into brick-shaped (six sided with 24 degrees of freedom) and wedge-shaped (five sided with 18 degrees of freedom) solid linear elements. Triangular membrane elements were used to model the cornea and sclera. Triangular elements gave better computational stability compared to quadrilateral one. To simulate the fracture line and the graft or floor interface, friction-less elements were used to allow free motion at the fractured bony sides.
Figure 1.
(a) Cross-sectional images of the scanned orbit, (b) antero-lateral view of the completed FEM model including the bony orbit and the globe, and (c) cross-section of the meshed globe and its internal structures.
Figure 2.
Antero-lateral view of the completed mesh model of the orbit en-housing the globe. (a) Mesh 8: 16 400 elements, 22 500 nodes, 32 500 degrees of freedom, (b) mesh 16: 33 334 elements, 34 762 nodes, 49 886 degrees of freedom. Points A, B and C correspond to locations where convergence was monitored. The orbit was subjected to a blunt injury of a 500 mg missile with a 30 m s−1 velocity oriented at different angles.
To maintain a proper geometrical aspect ratio, thin regions were subdivided into an extremely high number of elements. When the solid parabolic brick elements were used to model such a complex shape as that of the orbit, it was noted that although a larger amount of degrees of freedom would have given better interpolated data, the mid-side nodes of the elements also allowed for higher distortions to occur (Al-Sukhun 2003; Al-Sukhun et al. in press). Thus, by selecting a higher number of less distorted solid linear brick elements, the orbit was expected to be satisfactorily modelled. The FEM was checked for node coincidence and discontinuities (i.e. gaps between elements).
In order to establish an accurate FEM mathematically, more elements and nodes were used until the calculated displacements at a point common to all the meshes approached the exact solution (i.e. h-convergence test; Huiskes & Hollister 1993; Al-Sukhun et al. in press). The FEM was replicated to create 16 finite-element models. In all cases, the geometrical, material and boundary conditions were identical. The only difference between these models was in the number of degrees of freedom, with FEM-1 having the lowest and FEM-16 the highest number of degrees of freedom. To perform the convergence test, displacements were calculated at a variety of locations on the orbit following an impact of a blunt object, i.e. missile with a 30 m s−1 velocity (figures 1 and 3).
Figure 3.
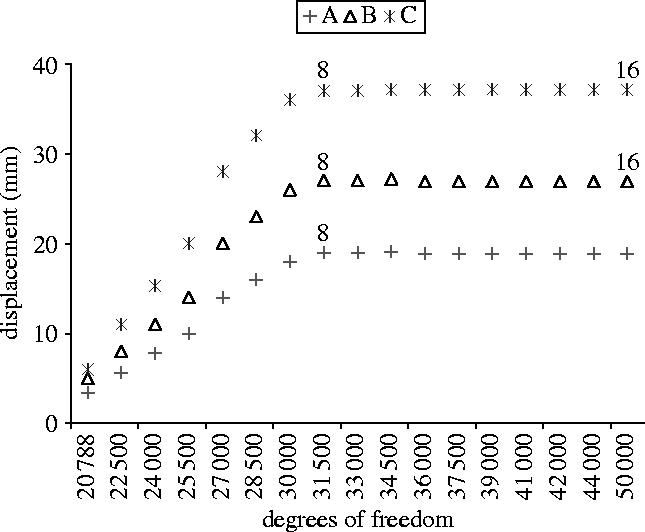
Convergence plots. Displacements of points A, B and C were plotted against the number of degrees of freedom for the 16 orbital meshes. Points A, B and C correspond to locations where convergence was monitored.
2.3 Problem definition
It is apparent that a blunt injury can cause a large range of ocular injuries. The most frequent objects involved in blunt orbital trauma include fists, balls, ends of hockey sticks and elbows. To simulate the impact of a blunt injury to the orbit it was decided to simulate a missile as a cylindrical rod, with a rounded end. The diameter of one end was larger than the orbital opening. Reviewing the literature, there was no data collected after the event of foreign body impact. Instead, some typical impact velocities were conferred from industrial accidents (Power 2001; Uchio et al. 2001). Thus a typical missile velocity of 30 m s−1 was used in this study. From considering the clinical data, the range of missile weight in this simulation was set at 0.5–1 kg. The impact was initially directed at right angle to the orbital rim. The simulation was executed five times, where the direction of the missile impact was varied by 45°—upward, downward, right and left, respectively. The FEM was then used to predict the stresses or strains at each node position.
3. Results
3.1 Verification of the FEM
Sixteen different finite-element models were developed using the NISA computer software in order to perform the convergence test (figures 1 and 3). The convergence test for calculated displacements at nodes A, B and C (figure 4) was plotted against the number of degrees of freedom and this demonstrates that accurate results were being calculated for the nodal displacement with the most refined mesh. Differences in calculated displacements were only 1–7% (comparing the results for mesh 8 and mesh 16) whereas the degrees of freedom increased by 50% (figure 1). This indicates that mesh 8 was providing accurate results, although only 34 500 degrees of freedom were needed to achieve the convergence. The validity of the developed FEM was also verified by measuring its distortion and stretch values. The software was used to measure the distortion by comparing the shapes of the ideal elements with those of the actual elements (the ideal shape of a brick element is a cube with quadrilateral faces). If an element matched the ideal shape, its distortion equalled one. As the shape of the element deviated from the target shape, the distortion value decreased. Overall, the distortion and stretch values of the finite-element models exceeded 0.4, the recommended minimum distortion index value defined by the manufacturer of the software.
Figure 4.
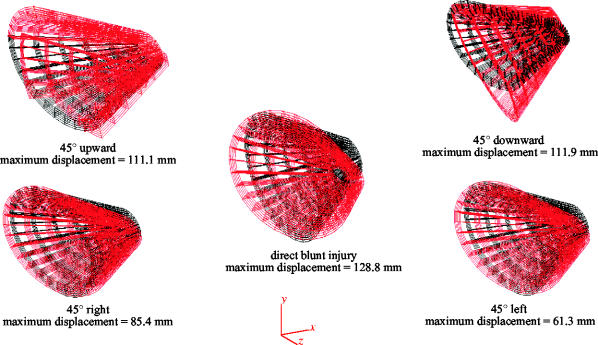
Antero-lateral view of the FEM in its non-deformed (black) and deformed (red) states during various simulations. Maximum displacements affected the medial wall and/or the postero-medial part of the orbital floor. The display of the deformed state was magnified 10 times and the globe was omitted to make the distinction more evident.
3.2 Orbital displacement
Each simulated missile impact (blunt injury) caused the orbit to deform in a different way. Antero-lateral views of the FEM are shown in figure 4. The missile was simulated at right angle to the orbital rim (MOR), 45° upward (MU), 45° downward (MD), 45° right (MR) and 45° left (ML). The non-deformed state in each figure depicts the model with its structural elements in their unloaded condition. The deformed state is one in which the action of the missile displaced the structural elements, and the model has reached the state of static equilibrium. Displacement has been magnified in the figures to make orbital deformation more evident. Actual deformations were relatively large; the maximum displacement for the MOR was 128.8 mm, for MR 85.4 mm, for ML 61.3, for MU 111.1 mm and for MD 111.9 mm. During MOR and MD the orbit deformed in anti-clockwise manner, and the inferior walls were displaced downward and inwards indicating orbital rotation. During MR and ML the right and left sides of the orbit deformed turning anti-clockwise and clockwise, respectively. During MU the medial and inferior walls were displaced laterally and inferiorly, respectively, rather than being rotated, indicating decreased orbital rotation compared to MD and MOR.
3.3 Orbital stresses
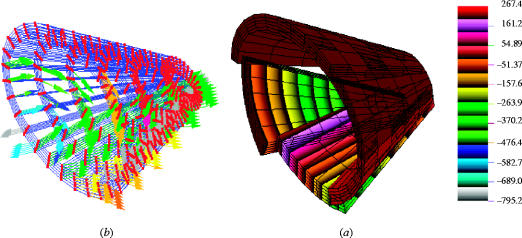
Stress values ranged from 213.4 to 363.3 MPa for the maximum principal stress, from −327.8 to −653.1 MPa for the minimum principal stress, and from 212.3 to 444.3 MPa for the maximum shear stress (table 3). In all cases the maximum stress occurred in the postero-medial part of the orbital floor (figures 4 and 5). The stress distributions are shown in the form of contoured bands plots where each band represents a different value.
Figure 5.
(a) Maximum principal stress bands on the orbit when subjected to a blunt injury of a missile with 30 m s−1 velocity directed at right angle to the orbital rim. Colour numbers reflect stress magnitudes. To enhance the distribution patterns of principal stresses on the cortical surface of the orbit, the stresses were displayed at lower ranges of magnitude. (b) Deformation shown in the form of vector display of maximum principal stress. The highest values (blue and green arrows) affected the medial wall and the postero-medial part of the orbital floor. The display of the deformed state was magnified 10 times and the globe was omitted to make the distinction more evident.
3.4 Orbital floor stresses
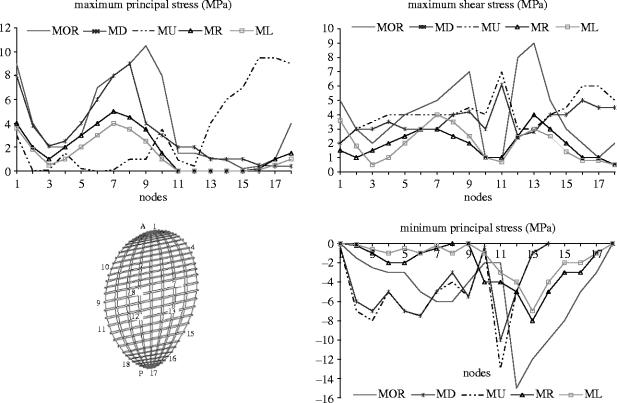
Special attention was given to orbital floor stress analysis due to its importance in the treatment of orbital trauma. Stresses were quantified for MOR, ML, MR, MU and ML. In all cases, MR and ML evoked the lowest stress magnitudes (figure 6).
Figure 6.
Principal and maximum shear stress magnitudes at the orbital floor during various simulations. Stress values were plotted at 18 nodes forming the cortical outline of the orbital floor. Nodes 2–9 were located on the anterior (A) aspect of the orbital floor outline and nodes 11–18 on the posterior (P) side.
Maximum principal stress was higher on the posterior aspect of the orbital region than on its anterior side during all simulations except MU, which evoked higher magnitudes of stress at the anterior region of the floor. In all cases, the lowest values were found at the most lateral locations.
Minimum principal stresses had peaks of intensity at the anterior aspect of the orbital floor during MU, MD and MOR. The magnitudes of maximum shear stress were approximately symmetrically distributed between the anterior and the posterior aspects of the orbital floor region during all simulations except when load was applied at right angle to the orbital rim, which caused higher shear on the anterior orbital rim.
The average, maximum and total force magnitudes for 36 nodes forming the cortical outline of the postero-medial part of the orbital floor, during various simulations, are shown in table 4. Although slightly dissimilar in total magnitude, the orbital forces were similar when load was applied at right and left angulations. When load was applied at right angle to the orbital rim, upward angulation and downward angulation, the postero-medial region experienced the highest average and total forces overall.
Table 4.
The average, maximum and total forces are given for 36 nodes forming the cortical outline of the postero-medial part of the orbital floor.
| direction of the missile with a 30 m s−1 velocity | |||||
|---|---|---|---|---|---|
| orbital force (N) | direct blunt injury | 45° upward | 45° downward | 45° right | 45° left |
| average | 8.4 | 8.2 | 7.9 | 6.3 | 6.4 |
| maximum | 8.9 | 8.4 | 8.0 | 7.6 | 7.8 |
| total | 199.3 | 187.0 | 182.1 | 175.0 | 176.0 |
4. Discussion
Several three-dimensional finite-element modes of the eyeball have been created (Power 2001; Uchio et al. 2001, 2003). In general, all the models have been severely compromized by the oversimplification of material properties and boundary conditions. However, the most important deficiency in these models has probably been the exclusion of biologically relevant boundary conditions, such as the assignment of experimentally derived muscular forces. Although the above studies have demonstrated the biomechanical injuries of the globe, these models were of eyeball only and ignored other important structures such as the orbital bone and fat. The number of elements in these studies was less than 6632, which was small compared with the present study (16 400). Another consistent error in all the finite-element models mentioned here was the fact that they did not apply the convergence theory, known as a t-test, to validate their models and to decide whether the refined mesh is mathematically acceptable. The best available data on the orbital physical properties were applied to the developed model.
It would have been ideal to determine the material properties of the orbital bone used in the present study, since the properties of bone have been shown to vary significantly according to porosity and mineral content (Currey 1988), as well as age, gender and race (Evans 1973). It was felt, however, that these factors would not have affected the results significantly, since large variations in material properties (up to 25%) would have been necessary to induce significant changes in the strain patterns (Power 2001; Al-Sukhun 2003; Al-Sukhun et al. in press).
Finite element techniques currently used to determine trabecular stress are only able to analyse very small regions of bone with a limited number of trabeculae (Keyak et al. 1990) or a much larger region of bone based on the assumption that it is a solid with apparent material properties (Al-Sukhun 2003; Al-Sukhun et al. in press). In this project, the measurement of the physical properties involved the use of CT to directly derive the mechanical properties of bone (Keyak et al. 1990). Since a linear relationship exists between the CT number and the apparent density of bone, it is theoretically possible to assess the density of bone from the images and to estimate its elastic modulus using an equation proposed by Carter & Hayes (1977). However, studies have demonstrated a poor relationship between mechanically derived material properties and those obtained by CT (Snyder & Schneider 1991). An alternative approach using ultrasound to determine the mechanical properties of cortical and trabecular bone seems encouraging, since acoustic material testing methods have proved reliable (Ashman et al. 1984).
Ideally, clinical experiments with orbital trauma would need to be performed to validate the FEM. At the time of this report the only available data, in the literature was published by Ahmad et al. (2003). They have demonstrated that the mean force required to cause orbital floor fracture ranged between 2.22 and 2.54 J. In this study, the simulation of a 500 g missile with a velocity of 30 m s−1 produced a kinetic energy of 2.25 J and resulted in maximum principal stress manifested mainly at the medial wall and the postero-medial region of the orbital floor. Previous investigations, based on results obtained from in vivo studies on animals using strain gauges, have demonstrated the elastic deformation of the mammalian orbit during function (Ravosa et al. 2000). These studies concluded that the orbital bone manifests two basic patterns of deformation: (i) horizontal distortion, either medially or laterally directed and (ii) rotational distortion, either clockwise or counter clockwise. Similar forms of deformation were noticed during various simulations. However, comparisons between the orbital stresses predicted by the human FEM of this study and those obtained in macaques by Ravosa et al. (2000) were difficult due to the lack of control of macaque orbital loading and thus the absence of specific stresses. Difficult experimental and anatomical conditions further constrained the acquisition of data in macaques. During all simulations, the FEM predicted bands of maximum principal stress, which ran medially and obliquely from the medial wall to the anterior and postero-medial aspect of the orbital floor. This corresponds to the well-known fact that human bone adapts its shape and density (stiffness) according to the loading environment, resulting in a larger bone cross-section at the infraorbital rim. The posterior aspect of the orbital floor was mostly affected with lower magnitudes of principal stresses. This might be explained by the cushioning effect of the eyeball and the underlying fatty tissues, which provides an ideal stress-breaking mechanism to minimize orbital deformation. This highlights the importance of restoring the fatty tissue during orbital floor reconstruction following an orbital blow out fracture. Our investigation confirms previous reports of Waterhouse et al. (1999) namely, that the buckling mechanism produces fractures in the postero-medial aspect of the orbital floor and in contrast to the hydraulic mechanism, medial wall involvement is infrequent. According to the buckling theory direct trauma to the orbit may cause transient deformation of the infra-orbital rim. This is transmitted to the thinner orbital floor causing disruption of the bone without fracture of rim. The hydraulic theory, in contrast, proposes that the hydraulic pressure from the globe is transmitted to the walls of the orbit, resulting in fracture of the orbital floor. Anatomically, the infra-orbital rim is the thickest region in the orbit. The maximum shear stresses predicted in this study by the FEM for this region reached only half of the ultimate shear strength measured experimentally for cortical bone. The low stress value is probably related to the relatively large cross-sectional area of cortical bone when compared to the relatively small size of the region, since an increase in the cross-sectional thickness of a structure is advantageous to countering shearing stresses (Al-Sukhun 2003; Al-Sukhun et al. in press). The smallest cross-sectional surface of cortical bone in the infra orbital rim region of the FEM yielded an area of 65.5 mm2, which was close to the value of 58 mm2 reported by Hylander (Robinson 1946). The relatively thick cortical cross-section in both macaque and human orbits apparently helped to decrease shear stresses. Since these stresses did not reach the lowest values of ultimate shear strength, the model corroborated Waterhouse et al. (1999) and Ravosa et al. (2000) assumptions that the infraorbital region was well suited to withstand elevated stresses during powerful missile impact.
5. Conclusion and future recommendations
This study established that it is possible to build a three-dimensional FEM to represent a complex structure such as the human orbit containing the globe. This is the first study to provide data on extra-ocular muscles magnitudes and directions. It is feasible to simulate muscle-induced changes in the mechanical behaviour of the orbit with FEA. Forces can be applied to the model over wide areas at the probable sites of muscle attachment.
We have for the first time, recorded the stresses and forces exerted on the orbit required to produce a fracture. However, extra efforts must be invested to study the effect of changing the geometrical relationship, material properties and boundary conditions on stress or strain readings. The relationship between form and function of the orbital system could be further explored to include the effects of variations in muscle action on the growth and development of the orbit. Finite element modelling could also be used to determine the most convenient location, design and material of the fracture fixation devices. In order, to specifically test for ideal placements and types of these devices on the orbit, the FEM could be used to simulate fractures, the cuts bridged by fixation plates, and orbital stress areas explored for different loading conditions and craniofacial types. The repair of the orbital floor is still a surgical challenge for the surgeon. It will be important to explore various methods used currently in the reconstruction procedure and whether an adequate long term clinical outcome can be achieved.
References
- Ahmad F, Kirkpatrick W.N, Lyne J, Urdang M, Garey L.J, Waterhouse N. Strain gauge biomechanical evaluation of forces in orbital floor fractures. Br. J. Plast. Surg. 2003;56:3–9. doi: 10.1016/s0007-1226(02)00467-8. doi:10.1016/S0007-1226(02)00467-8 [DOI] [PubMed] [Google Scholar]
- Al-Sukhun J. 2003. Modelling of mandibular functional deformation. Ph.D. thesis, University of London. [Google Scholar]
- Al-Sukhun, J., Lindqvist, C. & Kontio, R. In press. Orbital stress analysis. Part II. Variables affecting the predictive behaviour of a finite-element model of a human orbit. J. Oral Maxillofac. Surg. [DOI] [PubMed]
- Ashman R.B, Cowin S.C, van Buskirk W.C, Rice J.C. A continuous wave technique for the measurement of the elastic properties of cortical bone. J. Biomech. 1984;17:349–361. doi: 10.1016/0021-9290(84)90029-0. doi:10.1016/0021-9290(84)90029-0 [DOI] [PubMed] [Google Scholar]
- Carter D.R, Hayes W.C. The compressive behaviour of bone as a two-phase porous structure. J. Bone Joint Surg. 1977;59:954–962. [PubMed] [Google Scholar]
- Currey J.D. The effect of porosity and mineral content on the Young's modulus of elasticity of compact bone. J. Biomech. 1988;21:131–139. doi: 10.1016/0021-9290(88)90006-1. doi:10.1016/0021-9290(88)90006-1 [DOI] [PubMed] [Google Scholar]
- Evans F.G. Charles C. Thomas; Springfield, IL: 1973. Mechanical properties of bone. [Google Scholar]
- Gysi A. Studies on the leverage problem of the mandible. Dent. Digest. 1921;27:74–84. See also pages 144–150, 203–208. [Google Scholar]
- Huiskes R, Hollister S.J. From structure to process, form to organ: recent developments of FE analysis in orthopaedic biomechanics. J. Biomed. Eng. 1993;115:520–527. doi: 10.1115/1.2895534. [DOI] [PubMed] [Google Scholar]
- Hylander W.L. The human mandible: lever or link? Am. J. Phys. Anthropol. 1975;43:227–242. doi: 10.1002/ajpa.1330430209. [DOI] [PubMed] [Google Scholar]
- Hylander W.L. In vivo bone strain in the mandible of Galago crassicaudatus. Am. J. Phys. Anthropol. 1977;46:309–326. doi: 10.1002/ajpa.1330460212. doi:10.1002/ajpa.1330460212 [DOI] [PubMed] [Google Scholar]
- Keyak J.H, Meagher J.M, Skinner H.B, Mote C.D., Jr Automated three-dimensional finite-element modelling of bone: a new method. J. Biomed. Eng. 1990;12:389–397. doi: 10.1016/0141-5425(90)90022-f. [DOI] [PubMed] [Google Scholar]
- Kobayashi A.S, Woo S.L, Lawrence C, Schlegel W.A. Analysis of the corneo-scleral shell by the method of direct stiffness. J. Biomech. 1971;4:323–330. doi: 10.1016/0021-9290(71)90053-4. doi:10.1016/0021-9290(71)90053-4 [DOI] [PubMed] [Google Scholar]
- Korioth T.P, Versulis A. Modelling of the biomechanical behaviour of the jaws and their related structures by finite-element analysis. Crit. Rev. Oral Biol. Med. 1997;8:90–104. doi: 10.1177/10454411970080010501. [DOI] [PubMed] [Google Scholar]
- Lanyon L.E. Functional stress in bone tissue as an objective, and a controlling stimulus for adaptive bone remodelling. J. Biomech. 1987;20:1083–1093. doi: 10.1016/0021-9290(87)90026-1. doi:10.1016/0021-9290(87)90026-1 [DOI] [PubMed] [Google Scholar]
- Mongini F, Calderale P.M, Barberi G. Relationship between structure and the stress pattern in the human mandible. J. Dent. Res. 1979;58:2334–2337. doi: 10.1177/00220345790580120101. [DOI] [PubMed] [Google Scholar]
- Power, E. D. 2001 A nonlinear finite-element model of the human eye to investigate Ocular injuries from night vision goggles. M.D. thesis, Virginia Polytechnic Institute and State University, Virginia.
- Ralph J.P, Caputo A.A. Analysis of stress patterns in the human mandible. J. Dent. Res. 1975;54:814–821. doi: 10.1177/00220345750540042001. [DOI] [PubMed] [Google Scholar]
- Ravosa M.J, Noble V.E, Hylander W.L, Johnson K.R, Kowalski E.M. Masticatory stress, orbital orientation and the evolution of the primate postorbital bar. J. Hum. Evol. 2000;38:667–693. doi: 10.1006/jhev.1999.0380. doi:10.1006/jhev.1999.0380 [DOI] [PubMed] [Google Scholar]
- Robinson M. The temporomandibular joint: theory of reflex controlled non-lever action of the mandible. J. Am. Dent. Assoc. 1946;33:1260–1271. doi: 10.14219/jada.archive.1946.0176. [DOI] [PubMed] [Google Scholar]
- Snyder S.M, Schneider E. Estimation of mechanical properties of cortical bone by computed tomography. J. Orthop. Res. 1991;9:422–431. doi: 10.1002/jor.1100090315. doi:10.1002/jor.1100090315 [DOI] [PubMed] [Google Scholar]
- Standlee J.P, Caputo A.A, Ralph J.P. The condyle as a stress-distributing component of the temporomandibular joint. J. Oral Rehab. 1981;8:391–400. doi: 10.1111/j.1365-2842.1981.tb00513.x. [DOI] [PubMed] [Google Scholar]
- Uchio E, Onho S, Kudoh K, Andoh K, Kisielewicz L.T. Simulation of air bag impact on a post-radial keratectomy by finite-element analysis method. J. Cataract Refract. Surg. 2001;27:1847–1853. doi: 10.1016/s0886-3350(01)00966-x. doi:10.1016/S0886-3350(01)00966-X [DOI] [PubMed] [Google Scholar]
- Uchio E, Watanabe Y, Kadonosono K, Matsuoka Y, Goto S. Simulation of Air bag impact on eyes after photo refractive keratectomy by finite-element analysis method. Arch. Clin. Exp. Ophthalmol. 2003;241:497–504. doi: 10.1007/s00417-003-0679-8. doi:10.1007/s00417-003-0679-8 [DOI] [PubMed] [Google Scholar]
- Waterhouse N, Lyne J, Urdang M, Garey L. An investigation into the mechanism of orbital blowout fractures. Br. J. Plast. Surg. 1999;52:607–612. doi: 10.1054/bjps.1999.3194. doi:10.1054/bjps.1999.3194 [DOI] [PubMed] [Google Scholar]


