

Abstract
Context/Objective
Given the increasing rates of both childhood obesity and type 2 diabetes (T2DM), we investigated whether maternal diabetes status during pregnancy is a determinant of risk factors associated with T2DM or cardiovascular disease in offspring during childhood.
Design/Participants
Forty-two Pima Indians, aged 7–11 yr, were identified retrospectively from maternal oral glucose tolerance tests as offspring of a diabetic pregnancy (22 ODM, eight males, 14 females) or offspring born before the mother developed diabetes (20 PRE, 12 males, eight females).
Setting/Main Outcome Measures
Weight, height, body mass index, percent body fat, blood pressure, and fasting concentrations of glucose, insulin, hemoglobin A1c (HbA1c), total cholesterol, triglycerides, and high-density lipoprotein-cholesterol were measured while staying in an in-patient clinical research unit and compared in cross-sectional analyses.
Results
After adjustment for age and gender, ODM had significantly higher concentrations of HbA1c (ODM = 5.7 ± 0.4, PRE = 5.0 ± 0.4%, P = 0.002), higher systolic (SBP) blood pressure (ODM = 118 ± 13, PRE = 107 ± 10 mm Hg; P = 0.02), and lower concentrations of high-density lipoprotein (ODM = 41 ± 9, PRE = 48 ± 6 mg/dl, P = 0.03) than PRE. Maternal diabetes status during pregnancy persisted as a significant determinant of SBP (beta = 7.50, P = 0.03) and HbA1c (beta = 0.43, P = 0.002), independent of age, gender, and percent body fat.
Conclusion
Intrauterine exposure to diabetes is a significant determinant of higher SBP and HbA1c during childhood, independent of adiposity and a genetic predisposition to T2DM. These data suggest that in utero exposure to diabetes confers an additional independent risk for the development of T2DM and/or cardiovascular disease later in life.
Abbreviations: BMI, Body mass index; CVD, cardiovascular disease; DBP, diastolic blood pressure; HbA1c, hemoglobin A1c; HDL, high-density lipoprotein; MSTAT, mother’s diabetes status; ODM, offspring of mothers with diabetes (either T2DM or gestational) during the index pregnancy; PRE, offspring of mothers who were normal glucose tolerant during the pregnancy but who subsequently developed T2DM after the index pregnancy and before the age of 40 yr; SBP, systolic blood pressure; TC, total cholesterol; T2DM, type 2 diabetes; TG, triglyceride
The intrauterine environment has been identified as a critical period for programing the risk of both type 2 diabetes (T2DM) and cardiovascular disease (CVD) later in life (1, 2). Specifically, associations between in utero exposure to diabetes and various components of the insulin resistance syndrome such as adiposity (3–7), high blood pressure (8–10), hyperinsulinemia (6, 10–12), and dyslipidemia (13, 14) have been observed. However, it is not clear whether these associations are primarily a consequence of the earlier onset of obesity that is often reported in offspring of diabetic mothers (2, 3, 5–7, 11) or due to the diabetic intrauterine milieu, independent of obesity. Indeed, the presence of high blood pressure (15, 16) and dyslipidemia (17, 18) in the general pediatric population are attributed primarily, but not exclusively, to the concurrent increased prevalence of childhood obesity.
Both obesity and hyperinsulinemia, either together or independently, are proposed to be unifying links between the insulin resistance syndrome and subsequent development of T2DM and CVD (19–22). However, individual and ethnic differences in the presence of or relationships between the various components of the insulin resistance syndrome suggest that it is a heterogeneous disorder (22–26). Furthermore, the temporal relationships between this syndrome and subsequent development of T2DM and CVD vary among individuals and populations (27, 28). Finally, there are neither established criteria for the diagnosis of the insulin resistance syndrome in children nor a unified definition thereof (24, 26). Therefore, understanding the impact of the in utero environment on these variables during childhood, independent of adiposity or genetics, would be useful for earlier identification of high-risk individuals and for targeting more effective and timely intervention strategies.
A significant number of Pima Indian children are markedly overweight and hyperinsulinemic by as early as 5 yr of age (29). Interestingly, this population has a genetic predisposition for obesity and T2DM (30) but not CVD. Furthermore, within the population, intrauterine exposure to a diabetic environment is associated with a greater risk for onset of T2DM at a younger age (31) due to lower insulin secretory rates (and thus higher glucose levels) for a similar level of adiposity or insulin sensitivity (32). Once diabetic, offspring of diabetic pregnancies also have a greater risk for renal disease (33). However, it is not clear whether the offspring within this population are also at greater risk for developing other components of the insulin resistance syndrome such as dyslipidemia or hypertension, which are closely associated with obesity and subsequent development of CVD.
Our aim was to investigate whether maternal diabetes status during pregnancy is a determinant for risk factors associated with T2DM or CVD in offspring during childhood. Using previously collected data, we retrospectively compared cross-sectional measures of anthropometry, blood pressure, and fasting concentrations of lipids, glucose, insulin, and hemoglobin A1c (HbA1c) in children identified as either offspring of mothers with diabetes (either T2DM or gestational) during the index pregnancy (ODM) or offspring of mothers who were normal glucose tolerant during the pregnancy but who subsequently developed T2DM after the index pregnancy and before the age of 40 yr (PRE). The PRE group represents children who have a genetic risk of diabetes, whereas ODM children have both genetic and intrauterine risk factors for the disease. We hypothesized that the ODM group would have higher fasting glucose and HbA1c concentrations than the PRE group, independent of adiposity. We further hypothesized that the degree of adiposity, rather than the mother’s diabetes status (MSTAT), would be the significant determinant of those variables associated with obesity (i.e. blood pressure and lipid and insulin concentrations).
Subjects and Methods
Subjects
Forty-two (20 males, 22 females) Pima Indian children, aged 7–11 yr, were studied during the summer months of 2001–2003. Pima Indian children were of full Indian heritage and at least 50% Pima and/or Tohono O’Odham heritage. Review of the mothers’ charts verified that the children were born full term (>37 wk) and that the pregnancies were uncomplicated with the exception of a diagnosis of maternal diabetes for 22 (eight males, 14 females) of these children.
Children and their mothers were admitted to the National Institutes of Health (NIH) Clinical Research Unit located at the Phoenix Indian Medical Center for a study primarily designed to evaluate patterns of food intake in this cohort. Health status was determined by medical history, physical examination, and urine and blood samples, and only healthy children were studied. Before participation, children and their mothers were fully advised of the nature and purpose of the study, and informed consent/assent was obtained. The experimental protocol was approved by the Institutional Review Boards of the NIDDK, the Phoenix Area Indian Health Service, and the Tribal Council of the Gila River Indian Community.
Determination of maternal diabetes status
Maternal diabetes status during pregnancy was determined from an oral glucose tolerance test performed during the last 180 d of pregnancy. In mothers who were normal glucose tolerant during the index pregnancy but who subsequently developed T2DM after the child was born and before the age of 40 yr, T2DM was diagnosed according to World Health Organization standards (2 h plasma glucose >11.1 m ) (34) from an oral glucose tolerance test using a 75-g glucose load and at least one random plasma glucose level greater than 11.1 m.
Anthropometry measurements
Height was measured without shoes. Body weight was measured while the children were wearing a preweighed robe. Body mass index (BMI) was calculated from weight and height measures [weight (kilograms)/height (square meters)] and converted to z-scores from percentiles established for age and gender (35). Body composition was determined using dual-energy x-ray absorptiometry as previously described (36). Waist circumference was measured at the level of the umbilicus while children were in the supine position. Measurements at birth (weight, length, and weight-for-length percentile) were obtained from the child’s medical record.
Analytical measurements
After being on a standardized diet for 2 d in the Clinical Research Unit, fasting blood samples were drawn. Fasting serum glucose concentrations were measured using the glucose oxidase method (Beckman Instruments Inc., Fullerton, CA) and fasting serum lipids [triglycerides (TGs), total cholesterol (TC), and high-density lipoprotein (HDL)-cholesterol] were measured by the colorimetric method (Dimension clinical chemistry system; Dade-Behring, Deerfield, IL). In a subset of 31 children (17 ODM = six males, 11 females; 14 PRE = nine males, five females), fasting plasma insulin concentrations were measured with an automated RIA (ICN Biochemicals, Costa Mesa, CA). We were unable to obtain an adequate blood sample for fasting plasma insulin measurements in the remaining 11 children due to their request to discontinue the procedure.
Blood pressure measurements
Systolic (SBP) and diastolic (DBP) blood pressures were determined from the first and fifth Korotkoff sounds, respectively, using an appropriately sized cuff (37). Measurements were taken in the morning of the day of admission after the child had been quietly resting at least 5 min in a sitting position with the right arm supported and cubital fossa at heart level (38).
Statistical methods
All statistical analyses were performed using software of the SAS Institute (Cary, NC). Throughout the text, data are expressed as means ±. Fasting concentrations of TC, TGs, HDL, and insulin were log trans-formed (log10) to normalize the distribution before analysis. General linear models were used to assess the impact of MSTAT on all variables, after adjustment for age and gender. Variables that were statistically different between ODM and PRE children were further separately adjusted for each anthropometric variable using multiple regression analyses. The level of significance was set at P ≤0.05.
Results
Comparisons of variables by age, gender, and MSAT pregnancy (Table 1)
TABLE 1.
Subject characteristics
| Variable | ODM (n = 22, 8 M/14 F) | PRE (n = 20, 12 M/8 F) | P value |
|---|---|---|---|
| Birth weight (g) | 3777 ± 497 | 3524 ± 450 | 0.10 |
| Birth length (cm) | 50.6 ± 2.2 | 50.8 ± 2.0 | 0.97 |
| Weight for length (percentile) | 68.5 ± 26.3 | 45.5 ± 28.9 | 0.03 |
| Age (yr) | 9.3 ± 1.1 | 10.0 ± 1.1 | 0.05 |
| Weight (kg) | 58.8 ± 14.1 | 49.5 ± 16.2 | 0.12 |
| Height (cm) | 141 ± 6 | 142 ± 10 | 0.20 |
| BMI (z-score) | 1.9 ± 0.9 | 1.6 ± 1.0 | 0.32 |
| Body fat (%) | 44.5 ± 9.8 | 38.5 ± 10.0 | 0.27 |
| Waist circumference (cm) | 83.6 ± 12.8 | 81.9 ± 16.2 | 0.48 |
| SBP (mm Hg) | 118 ± 13 | 107 ± 10 | 0.02 |
| DBP (mm Hg) | 63.1 ± 10.2 | 61.6 ± 8.9 | 0.10 |
| HbA1c | 5.7 ± 0.4 | 5.0 ± 0.4 | 0.002 |
| Glucose (mg/dl) | 87 ± 6 | 83 ± 4 | 0.11 |
| Cholesterol (mg/dl) | 148 ± 27 | 139 ± 22 | 0.61 |
| Triglycerides (mg/dl) | 101 ± 32 | 89 ± 34 | 0.32 |
| HDL (mg/dl) | 41 ± 9 | 48 ± 6 | 0.03 |
| Insulin (μU/ml)a | 38.6 ± 11.4 | 31.3 ± 11.7 | 0.24 |
Variables at birth and BMI z-score and age are unadjusted means ±. All other values are after adjustment for age and gender. Cholesterol, triglycerides, HDL, and insulin were log transformed (log10) for statistical analyses. Conversion factors to millimoles per liter: glucose × 0.05551; cholesterol and HDL × 0.02586; triglycerides × 0.01129; conversion to picomoles per liter: insulin × 7.175. M, Male; F, female. Boldface values are statistically significant differences between offspring of diabetic pregnancies and offspring born before mothers developed diabetes.
n = 17 ODM (6 M/11 F); 14 PRE (9 M/5 F).
Whereas the weight-for-length percentile at birth was higher (P = 0.03) in the ODM than the PRE group, none of the other anthropometric variables was different. Age was a significant determinant for all childhood variables (P = 0.02) except DBP and serum glucose and TGs. After adjustment for age and gender, the ODM group had significantly higher HbA1c (P = 0.02 unadjusted; P = 0.002 adjusted, Fig. 1) and SBP (P = 0.02) and lower HDL (P = 0.03) levels than the PRE group.
Fig. 1.
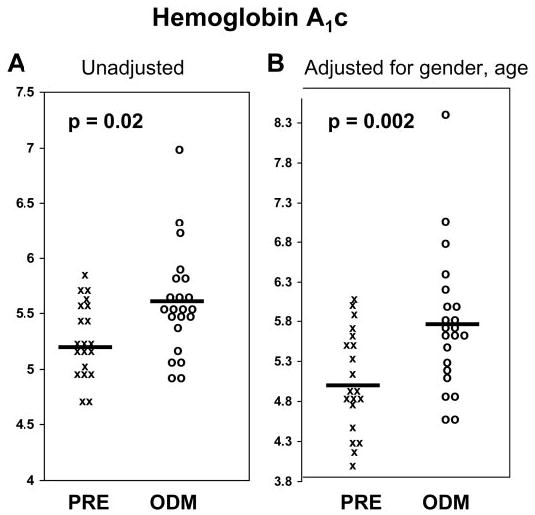
Scatter plots of individual HbA1c values in children born before their mothers developed type 2 diabetes (PRE) and in offspring of diabetic pregnancies (ODM). A, Unadjusted values. B, Values after adjustment for gender and age. X, PRE; O, ODM; solid bars, group means.
Comparisons based on MSTAT were adjusted for both age and gender because the ODM group was younger (P = 0.05) and there was a disproportionate number of boys and girls in the PRE vs. ODM groups. SBP was the only variable with a gender difference after adjustment for age (boys = 116 ± 14, girls = 106 ± 10 mm Hg; P = 0.05).
Impact of MSTAT after adjustment for adiposity (Table 2)
TABLE 2.
Determinants of significant variables in 7- to 11-yr-old Pima Indians
| Systolic blood pressure
|
HbA1c
|
Fasting HDL-cholesterol (log10)
|
|||||||
|---|---|---|---|---|---|---|---|---|---|
| Determinants | (β) | SE | P | (β) | SE | P | (β) | SE | P |
| Age (yr) | 4.45 | 1.51 | 0.006 | 0.146 | 0.057 | 0.02 | −0.02 | 0.01 | 0.03 |
| Gender (male) | 12.82 | 3.28 | 0.0004 | 0.187 | 0.124 | 0.14 | −0.02 | 0.02 | 0.39 |
| MSTAT (ODM) | 7.50 | 3.42 | 0.03 | 0.43 | 0.14 | 0.002 | −0.04 | 0.02 | 0.07 |
| Body fat (%) | 0.62 | 0.16 | 0.0004 | 0.003 | 0.007 | 0.68 | −0.004 | 0.001 | 0.0002 |
| Total R2 | 0.53 (<0.0001) | 0.30 (0.01) | 0.49 (<0.0001) | ||||||
Boldface variables are significant.
After adjustment for age, gender, and percent body fat, MSAT remained a significant determinant for SBP (Fig. 2) but was no longer a significant determinant for HDL concentrations. Similar results were observed when substituting any of the anthropometric variables in the model (data not shown). MSTAT and age were the significant determinants of HbA1c.
Fig. 2.
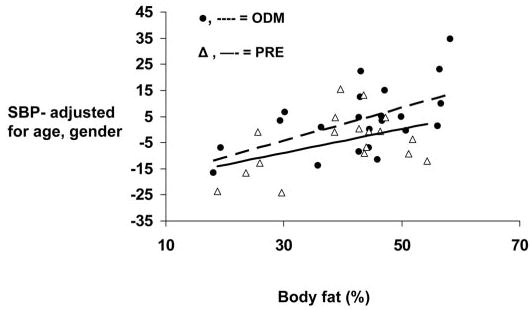
Relationships between gender- and age-adjusted measures of SBP and percent body fat in children born before their mothers developed type 2 diabetes (PRE) and offspring of diabetic pregnancies (ODM).▵, solid line, PRE;•, dashed line, ODM.
Discussion
Independent of adiposity, Pima Indian offspring of a diabetic pregnancy had significantly higher SBP and fasting serum concentrations of HbA1c than offspring of mothers who did not develop T2DM until after the index pregnancy. Regardless of the mother’s diabetes status during pregnancy, percent body fat was significantly correlated with SBP and fasting serum concentrations of TGs, HDL, and insulin.
MSTAT was a significant determinant of childhood HbA1c but not fasting serum glucose concentrations. This suggests that postprandial glucose levels may be chronically higher in the ODM than the PRE children. In regression analysis, the slope (beta) for MSTAT as a determinant of HbA1c was 0.43%. A 1% increase in HbA1c represents a 35 mg/dl increase in mean plasma glucose (39), suggesting that this slope is roughly equivalent to a mean plasma glucose concentration that is 15 mg/dl higher. Indeed, impaired glucose tolerance often develops before an impaired fasting glucose level is detected (22, 28); unfortunately, we do not have oral glucose tolerance data in this particular cohort of children to support these suppositions. However, because this difference was independent of adiposity, differences in HbA1c may reflect differences in insulin secretion rather than insulin sensitivity. In our laboratory, adult ODM had a lower insulin secretory response to a glucose challenge, compared with non-ODM adults, independent of adiposity and insulin sensitivity (32). In the present cohort of Pima Indian children, there were no differences between the ODM and PRE children in measures of adiposity or fasting glucose or insulin concentrations. Although we cannot say for certain that a lower insulin secretory capacity is the mechanism for higher serum HbA1c levels in the ODM children, these data do suggest that the intrauterine environment might program glucose regulation in a way that is independent of adiposity or genetics.
Currently it is not clear whether HbA1c levels in children are a risk factor for T2DM; however, it was found to be associated with other known risk factors for T2DM in 4- to 17-yr-olds from the Third National Health and Nutrition Examination Survey (1988–1994) (40). That study also reported higher mean HbA1c percentages in African Americans and Mexican Americans than non-Hispanic Whites after controlling for age, sex, BMI, and poverty income ratio. In adults, there is evidence of a relationship between HbA1c and risk for CVD in both diabetic and nondiabetic populations. Specifically, after adjusting for other known risk factors, a 1% increase in HbA1c was associated with an 18% increased risk for CVD in adults with T2DM (41) and a 26% increase in cardiovascular events in nondiabetic adults (42). Taken together, these studies illustrate the need for clinical trials to determine the utility of HbA1c as an independent risk factor for T2DM and CVD in children and adults.
An unexpected finding was the significant relationship between intrauterine exposure to diabetes and a higher SBP that was independent of adiposity, weight, or height. Whereas other studies of offspring of diabetic mothers (with or without intrauterine exposure) have reported higher SBP (9, 10, 17), these ODM groups were also heavier or more obese. Because of these observations, and the observed association of increases in weight and adiposity with higher blood pressures in children (15, 16), we hypothesized that any differences in blood pressure be attributed to relationships with adiposity rather than MSTAT. The clinical significance of this independent effect of the intrauterine environment on childhood SBP is not known; however, in this small cohort it should be noted that 10 of the 22 ODM children had a SBP that was more than the 90th percentile for age, gender, and height percentile (43). Although we cannot give a diagnosis of prehypertension or hypertension in these children without repeated measurements, mothers were advised to have their pediatricians closely monitor the children for hypertension in the future.
Birth weight has been identified as a significant factor linking the in utero environment with later development of hypertension (10, 25, 44, 45). Whereas there were no differences in birth weight between the ODM and PRE groups, the weight-for-length percentile was higher in the ODM group. However, none of the anthropometric measurements at birth were significant determinants for blood pressure in these children when included in the regression analyses.
It is difficult to speculate why our ODM cohort has higher SBP than our PRE cohort. Although we were able to account for factors such as maternal history of hypertension, birth size, anthropometry, gender, or age, we could not account for other potential confounding factors such as paternal or family history of hypertension. Furthermore, blood pressure was measured on only a single occasion, but it was measured under identical, standardized conditions in all children.
Of the mechanisms other than obesity that have been suggested to affect childhood hypertension (46), both hyperin-sulinemia (47, 48) and renal parenchymal disease (46, 49) are plausible; however, there was no difference in fasting plasma insulin concentrations between the ODM and PRE children. Whether intrauterine exposure to diabetes has altered renal structure or function in a way that correlates with SBP in these children cannot be determined from these data but is worth further exploration, particularly because a relationship between intrauterine exposure to T2DM and urinary albumin excretion has already been demonstrated in adult diabetic Pima Indians (33).
Although ODM children had lower HDL levels than PRE children, once HDL levels were adjusted for levels of adiposity, the differences were no longer significant; however, HDL levels tended to remain lower in the ODM group. Intrauterine exposure to type 1 diabetes has been associated with higher TC to HDL ratios in 5- to 11-yr-old children, compared with matched controls (14), and lower HDL levels have also been reported in adult offspring of diabetic parents (17). However, as with blood pressure, these relationships appear to be related to differences in adiposity.
In summary, intrauterine exposure to diabetes is a significant determinant of higher SBP and higher serum concentrations of HbA1c during childhood independent of other risk factors such as adiposity or genetic predisposition to T2DM. Despite the limitations of retrospective analysis, these data suggest that intrauterine exposure to diabetes confers an additional independent risk for the development of T2DM and/or CVD later in life, and evidence for this association begins to emerge during childhood. Future research that includes prospective studies in children of diabetic pregnancies is warranted.
Acknowledgments
We gratefully acknowledge the help of the National Insitutes of Health (NIH)-supported summer interns and the nursing and technical staffs of the NIH Clinical Diabetes and Nutrition Section in Phoenix. We are grateful to the members of the Gila River Indian Community for their continuing cooperation in our studies and particularly to the children and families who participated in this study.
References
- 1.Barker DJP, Gluckman PD, Godfrey KM, Harding JE, Owen JA, Robinson JS. Fetal nutrition and cardiovascular disease in adult life. Lancet. 1993;341:938–941. doi: 10.1016/0140-6736(93)91224-a. [DOI] [PubMed] [Google Scholar]
- 2.Pettitt DJ, Nelson RG, Saad MF, Bennet PH, Knowler WC. Diabetes and obesity in the offspring of Pima Indian women with diabetes during pregnancy. Diabetes Care. 1993;16(Suppl 1):310–314. doi: 10.2337/diacare.16.1.310. [DOI] [PubMed] [Google Scholar]
- 3.Plagemann A, Harder T, Kohlhoff R, Rohde W, Dorner G. Overweight and obesity in infants of mothers with long-term insulin-dependent diabetes or gestational diabetes. Int J Obes. 1997;21:451–456. doi: 10.1038/sj.ijo.0800429. [DOI] [PubMed] [Google Scholar]
- 4.Vohr BR, McGarvey ST, Tucker R. Effects of maternal gestational diabetes on offspring adiposity at 4–7 years of age. Diabetes Care. 1999;22:1284–1291. doi: 10.2337/diacare.22.8.1284. [DOI] [PubMed] [Google Scholar]
- 5.Dabelea D, Pettitt DJ. Intrauterine diabetic environment confers risks for type 2 diabetes mellitus and obesity in the offspring, in addition to genetic susceptibility. J Pediatr Endocrinol Metab. 2001;14:1085–1091. doi: 10.1515/jpem-2001-0803. [DOI] [PubMed] [Google Scholar]
- 6.Kostalova L, Leskova L, Kapellerova A, Strbak V. Body mass, plasma leptin, glucose, insulin and c-peptide in offspring of diabetic and non-diabetic mothers. Eur J Endocrinol. 2001;145:53–58. doi: 10.1530/eje.0.1450053. [DOI] [PubMed] [Google Scholar]
- 7.Gillman MW, Rifas-Shiman S, Berkey CS, Field AE, Colditz GA. Maternal gestational diabetes, birth weight, and adolescent obesity. Pediatrics. 2003;111:E221–E226. doi: 10.1542/peds.111.3.e221. [DOI] [PubMed] [Google Scholar]
- 8.Pribylova H, Dvorakova L. Long-term prognosis of infants of diabetic mothers. Relationships between metabolic disorders in newborns and adult offspring. Acta Diabetol. 1996;33:30–34. doi: 10.1007/BF00571937. [DOI] [PubMed] [Google Scholar]
- 9.Nilsson PM. Increased weight and blood pressure in adolescent male offspring to mothers with pre-pregnancy diabetes—a genetic link? J Hum Hypertens. 1999;13:793–795. doi: 10.1038/sj.jhh.1000819. [DOI] [PubMed] [Google Scholar]
- 10.Cho NH, Silverman BL, Rizzo TA, Metzger BE. Correlations between the intrauterine metabolic environment and blood pressure in adolescent offspring of diabetic mothers. J Pediatr. 2000;136:587–592. doi: 10.1067/mpd.2000.105129. [DOI] [PubMed] [Google Scholar]
- 11.Silverman BL, Metzger BE, Cho NH, Loeb CA. Impaired glucose tolerance in adolescent offspring of diabetic mothers: relationship to fetal hyper-insulinism. Diabetes Care. 1995;18:611–617. doi: 10.2337/diacare.18.5.611. [DOI] [PubMed] [Google Scholar]
- 12.Moran A, Sinaiko AR. Influence of intrauterine environment on development of insulin resistance. J Pediatr. 2000;136:567–569. doi: 10.1067/mpd.2000.106561. (Editorial) [DOI] [PubMed] [Google Scholar]
- 13.Akisu M, Darcan S, Oral R, Kultursay N. Serum lipid and lipoprotein composition in infants of diabetic mothers. Indian J Pediatr. 1999;66:381–386. doi: 10.1007/BF02845529. [DOI] [PubMed] [Google Scholar]
- 14.Manderson JG, Mullan B, Patterson CC, Hadden DR, Traub AI, McCance DR. Cardiovascular and metabolic abnormalities in the offspring of diabetic pregnancy. Diabetologia. 2002;45:991–996. doi: 10.1007/s00125-002-0865-y. [DOI] [PubMed] [Google Scholar]
- 15.Sorof J, Daniels S. Obesity hypertension in children: a problem of epidemic proportions. Hypertension. 2002;40:441–447. doi: 10.1161/01.hyp.0000032940.33466.12. [DOI] [PubMed] [Google Scholar]
- 16.Muntner P, He J, Cutler JA, Wildman RP, Whelton PK. Trends in blood pressure among children and adolescents. JAMA. 2004;291:2107–2113. doi: 10.1001/jama.291.17.2107. [DOI] [PubMed] [Google Scholar]
- 17.Srinivasan SR, Frontini MG, Beenson GS. Longitudinal changes in risk variables of insulin resistance syndrome from childhood to young adulthood in offspring of parents with type 2 diabetes: the Bogalusa Heart Study. Metabolism. 2003;52:443–450. doi: 10.1053/meta.2003.50065. [DOI] [PubMed] [Google Scholar]
- 18.American Diabetes Association . Management of dyslipidemia in children and adolescents with diabetes. Diabetes Care. 2003;26:2194–2197. doi: 10.2337/diacare.26.7.2194. [DOI] [PubMed] [Google Scholar]
- 19.Despres JP, Lamarche B, Mauriege P, Cantin B, Dagenais GR, Moorjani S, Lupien PJ. Hyperinsulinemia as an independent risk factor for ischemic heart disease. N Engl J Med. 1996;334:952–957. doi: 10.1056/NEJM199604113341504. [DOI] [PubMed] [Google Scholar]
- 20.Kahn BB, Flier JS. Obesity and insulin resistance. J Clin Invest. 2000;106:473–481. doi: 10.1172/JCI10842. [DOI] [PMC free article] [PubMed] [Google Scholar]
- 21.Steinberger J, Daniels SR. Obesity, insulin resistance, diabetes, and cardiovascular risk in children: an American Heart Association scientific statement from the Atherosclerosis, Hypertension, and Obesity in the Young Committee (Council on Cardiovascular Disease in the Young) and the Diabetes Committee (Council on Nutrition, Physical Activity, and Metabolism) Circulation. 2003;107:1448–1453. doi: 10.1161/01.cir.0000060923.07573.f2. [DOI] [PubMed] [Google Scholar]
- 22.Weiss R, Dziura J, Burgert TS, Tamborlane WV, Taksali SE, Yeckel CW, Allen K, Lopes M, Savoye M, Morrison J, Sherwin RS, Caprio S. Obesity and the metabolic syndrome in children and adolescents. N Engl J Med. 2004;350:2362–2374. doi: 10.1056/NEJMoa031049. [DOI] [PubMed] [Google Scholar]
- 23.Berenson GS, Srinivasan SR, Bao W, Newman IIIWP, Tracy RE, Wattigney WA. Association between multiple cardiovascular risk factors and atherosclerosis in children and young adults. N Engl J Med. 1998;338:1650–1656. doi: 10.1056/NEJM199806043382302. [DOI] [PubMed] [Google Scholar]
- 24.Lambert M, Paradis G, O’Loughlin J, Delvin EE, Hanley JA, Levy E. Insulin resistance syndrome in a representative sample of children and adolescents from Quebec, Canada. Int J Obes. 2004;28:833–841. doi: 10.1038/sj.ijo.0802694. [DOI] [PubMed] [Google Scholar]
- 25.Mzayek F, Sherwin R, Fonseca V, Valdez R, Srinivasan SR, Cruickshank JK, Berenson GS. Differential association of birth weight with cardiovascular risk variables in African-Americans and Whites: The Bogalusa Heart Study. Ann Epidemiol. 2004;14:258–264. doi: 10.1016/j.annepidem.2003.09.014. [DOI] [PubMed] [Google Scholar]
- 26.Steinbeck KS. Insulin resistance syndrome in children and adolescents: clinical meaning and indication for action. Int J Obes. 2004;28:829–832. doi: 10.1038/sj.ijo.0802723. (Editorial) [DOI] [PubMed] [Google Scholar]
- 27.Chen W, Bao W, Begum S, Elkasabany A, Srinivasan SR, Berenson GS. Age related patterns of the clustering of cardiovascular risk variables of syndrome X from childhood to young adulthood in a population made up of black and white subjects: the Bogalusa Heart Study. Diabetes. 2000;49:1042–1048. doi: 10.2337/diabetes.49.6.1042. [DOI] [PubMed] [Google Scholar]
- 28.Ten S, Maclaren N. Insulin resistance syndrome in children. J Clin Endocrinol Metab. 2004;89:2526–2539. doi: 10.1210/jc.2004-0276. [DOI] [PubMed] [Google Scholar]
- 29.Salbe AD, Weyer C, Lindsay RS, Ravussin E, Tataranni PA. Assessing risk factors for obesity between childhood and adolescence: I. Birth weight, childhood adiposity, parental obesity, insulin, and leptin. Pediatrics. 2002;110:299–306. doi: 10.1542/peds.110.2.299. [DOI] [PubMed] [Google Scholar]
- 30.Knowler WC, Pettitt D, Saad M. Obesity in the Pima Indians its magnitude and relationship with diabetes. Am J Clin Nutr. 1991;53:1543S–1551S. doi: 10.1093/ajcn/53.6.1543S. [DOI] [PubMed] [Google Scholar]
- 31.Dabelea D, Knowler WC, Pettitt DJ. Effect of diabetes in pregnancy on offspring: follow-up research in the Pima Indians. J Matern Fetal Med. 2000;9:83–88. doi: 10.1002/(SICI)1520-6661(200001/02)9:1<83::AID-MFM17>3.0.CO;2-O. [DOI] [PubMed] [Google Scholar]
- 32.Gautier JF, Wilson C, Weyer C, Mott D, Knowler WC, Cavaghan M, Polonsky KS, Bogardus C, Pratley RE. Low acute insulin secretory responses in adult offspring of people with early onset type 2 diabetes. Diabetes. 2001;50:1828–1833. doi: 10.2337/diabetes.50.8.1828. [DOI] [PubMed] [Google Scholar]
- 33.Nelson RG, Morgenstern H, Bennett PH. Intrauterine exposure and the risk of renal disease in diabetic Pima Indians. Diabetes. 1998;47:1489–1493. doi: 10.2337/diabetes.47.9.1489. [DOI] [PubMed] [Google Scholar]
- 34.World Health Organization. Geneva: World Health Organization; 1985. Diabetes mellitus: report of a WHO study group (technical report series, no. 727) [PubMed] [Google Scholar]
- 35.Centers for Disease Control and Prevention. [last accessed December 18]. 2004. A SAS program for the CDC growth charts. http://www.cdc.gov/nccdphp/dpna/growthcharts/sas.html. [Google Scholar]
- 36.Mazess RB, Barden HS, Bisek JP, Hanson J. Dual energy x-ray absorptiometry for total body and regional bone mineral and soft tissue composition. Am J Clin Nutr. 1990;55:950–954. doi: 10.1093/ajcn/51.6.1106. [DOI] [PubMed] [Google Scholar]
- 37.Gomez-Marin O, Prineas RJ, Rastam L. Cuff bladder width and blood pressure measurement in children and adolescents. J Hypertens. 1992;10:1235–1241. [PubMed] [Google Scholar]
- 38.Netea RT, Lenders JW, Smits P, Thien T. Both body and arm position significantly influence blood pressure measurement. J Hum Hypertens. 2003;17:389–395. doi: 10.1038/sj.jhh.1001573. [DOI] [PubMed] [Google Scholar]
- 39.American Diabetes Association. Tests of glycemia in diabetes. Diabetes Care. 2004;27(Suppl 1):S91–S93. doi: 10.2337/diacare.27.2007.s91. [DOI] [PubMed] [Google Scholar]
- 40.Eldeirawi K, Lipton RB. Predictors of hemoglobin A1c in a national sample of nondiabetic children: the Third National Health and Nutrition Examination Survey, 1988–1994. Am J Epidemiol. 2003;157:624–632. doi: 10.1093/aje/kwg023. [DOI] [PubMed] [Google Scholar]
- 41.Selvin E, Marinopoulos S, Berkenblit G, Rami T, Brancati FL, Powe NR, Golder SH. Meta-analysis: glycosylated hemoglobin and cardiovascular disease in diabetes mellitus. Ann Intern Med. 2004;141:421–431. doi: 10.7326/0003-4819-141-6-200409210-00007. [DOI] [PubMed] [Google Scholar]
- 42.Khaw KT, Wareham N, Bingham S, Luben R, Welch A, Day N. Association of hemoglobin A1c with cardiovascular disease and mortality in adults: the European prospective investigation into cancer in Norfolk. Ann Intern Med. 2004;141:413–420. doi: 10.7326/0003-4819-141-6-200409210-00006. [DOI] [PubMed] [Google Scholar]
- 43.National High Blood Pressure Education Program Working Group on High Blood Pressure in Children and Adolescents. The fourth report on the diagnosis, evaluation, and treatment of high blood pressure in children and adolescents. Pediatrics. 2004;114 (2, Pt 3 of 3):558–559. [PubMed] [Google Scholar]
- 44.Law CM, Barker DJP. Fetal influences on blood pressure. J Hypertens. 1994;12:1329–1332. [PubMed] [Google Scholar]
- 45.Law CM, Shiell AW. Is blood pressure inversely related to birth weight? The strength of evidence from a systematic review of the literature. J Hypertens. 1996;14:935–941. [PubMed] [Google Scholar]
- 46.Nehal US, Ingelfinger JR. Pediatric hypertension: recent literature. Curr Opin Pediatr. 2002;14:189–196. doi: 10.1097/00008480-200204000-00008. [DOI] [PubMed] [Google Scholar]
- 47.DeFronzo RA. The effect of insulin on renal sodium metabolism. A review with clinical implications. Diabetologia. 1981;21:165–171. doi: 10.1007/BF00252649. [DOI] [PubMed] [Google Scholar]
- 48.Anderson EA, Mark AL. The vasodilator action of insulin. Implications for the insulin hypothesis of hypertension. Hypertension. 1993;21:136–141. doi: 10.1161/01.hyp.21.2.136. [DOI] [PubMed] [Google Scholar]
- 49.Munoz S. Blood pressure studies in pediatric populations: metabolic syndrome in hypertensive children and adolescents. J Hum Hypertens. 2000;14:S10–S15. doi: 10.1038/sj.jhh.1000980. [DOI] [PubMed] [Google Scholar]