Sample preparation, characterization, crystallization and preliminary X-ray analysis are reported for a HNF1β–DNA binary complex.
Keywords: protein–DNA complex, diabetes, POU transcription factor
Abstract
Hepatocyte nuclear factor 1β (HNF1β) is a member of the POU transcription-factor family and binds the target DNA as a dimer with nanomolar affinity. The HNF1β–DNA complex has been prepared and crystallized by hanging-drop vapor diffusion in 6%(v/v) PEG 300, 5%(w/v) PEG 8000, 8%(v/v) glycerol and 0.1 M Tris pH 8.0. The crystals diffracted to 3.2 Å (93.9% completeness) using a synchrotron-radiation source under cryogenic (100 K) conditions and belong to space group R3, with unit-cell parameters a = b = 172.69, c = 72.43 Å. A molecular-replacement solution has been obtained and structure refinement is in progress. This structure will shed light on the molecular mechanism of promoter recognition by HNF1β and the molecular basis of the disease-causing mutations found in it.
1. Introduction
Hepatocyte nuclear factor 1β (HNF1β) is a tissue-specific transcription factor that plays an essential role in early vertebrate development and embryonic survival (Giuffrida & Reis, 2005 ▶; Malecki, 2005 ▶; Yamagata, 2003 ▶). First identified as a key regulator in the liver, HNF1β is also expressed in the pancreas, kidney, lung, thymus and throughout the gastrointestinal tract. It can act either as a homodimer or as a heterodimer with HNF1α. In humans, heterozygous mutations in the HNF1β gene are associated with the autosomal dominant subtype of diabetes known as MODY (maturity-onset diabetes of the young; Horikawa et al., 1997 ▶) as well as a variety of renal developmental disorders such as renal cysts, familial hypoplastic glomerulocystic kidney disease, renal malformation and atypical familial hyperuricemic nephropathy (Bellanne-Chantelot et al., 2004 ▶; Bingham & Hattersley, 2004 ▶; Bohn et al., 2003 ▶; Igarashi et al., 2005 ▶). Other clinical features include genital tract malformations, abnormal liver function tests, pancreatic atrophy and exocrine insufficiency, and biliary manifestations (Edghill et al., 2006 ▶).
Heterozygous mutations in genes encoding five cell-specific transcription factors are associated with different MODY subtypes: HNF4α (MODY1), HNF1α (MODY3), IPF1/PDX1 (MODY4), HNF1β (MODY5) and NeuroD1 (MODY6) (Fajans et al., 2001 ▶; Giuffrida & Reis, 2005 ▶; Malecki, 2005 ▶; Mitchell & Frayling, 2002 ▶). It has been proposed that these transcription factors form an integrated regulatory network in pancreatic β-cells which is involved in β-cell development, glucose metabolism and insulin secretion (Mitchell & Frayling, 2002 ▶; Odom et al., 2004 ▶), yet the precise mechanism and the affected target genes leading to the MODY phenotypes are largely unknown. Two of the MODY genes, HNF1α and HNF1β, belong to a distinct subclass of the homeodomain transcription-factor family known as POU transcription factors (Chi et al., 2002 ▶). They are encoded by two different genes (HNF1α on 12q22-qter and HNF1β on 17cen-q21.3) and distinctive sets of MODY mutations are found in HNF1α and HNF1β (Chi, 2005 ▶; Ryffel, 2001 ▶). They share highly conserved DNA-binding domains composed of an atypical POU-specific domain (POUS) and POU homeodomain (POUH) and a more divergent C-terminal transactivation domain (Chi et al., 2002 ▶). HNF1α and HNF1β display similar DNA-binding sequence specificity and bind DNA as homodimers or heterodimers (Rey-Campos et al., 1991 ▶); however, they recruit different sets of proteins for transactivation and their mutations result in distinctive phenotypes (Pearson et al., 2004 ▶). For example, renal developmental disorders and genital malformations are more prominent with the mutations in HNF1β (Bellanne-Chantelot et al., 2004 ▶; Bohn et al., 2003 ▶), even though both have been associated with diabetes. While the structural and functional properties of HNF1α have been extensively studied, the structural features of HNF1β remain essentially uncharacterized and are mainly inferred from its homology to HNF1α. Thus, to elucidate the molecular basis of HNF1β function and the monogenic causes of diabetes, we have prepared and crystallized human HNF1β DNA-binding domains in complex with a high-affinity promoter containing the recognition sequence.
2. Materials and methods
2.1. Construction, expression and purification of HNF1β 91–310
The cDNA harboring the human HNF1β full-length sequence was purchased from Invitrogen. A fragment of human HNF1β cDNA (amino-acid sequence 91–310) was subcloned by standard PCR into a modified pET41a vector in which a thrombin-cleavage site was replaced by a TEV (tobacco etch virus) protease-cleavage site for higher specificity. The boundary for the HNF1β DNA-binding domains was selected using the previous HNF1α–DNA complex crystal structure (Chi et al., 2002 ▶) and the sequence alignment between HNF1α and HNF1β (Fig. 1 ▶). The primers used in this construct were forward-F91 (CAT GGA TCC ATC CTC AAG GAG CTG CAG) and reverse-R310 (GTA CTC GAG CTA CCG GAA TGC CTC CTC CTT), which introduces a BamHI site at the N-terminus and a XhoI site as well as a stop codon at the C-terminus, respectively. The correct sequence of the final construct was confirmed by DNA sequencing.
Figure 1.
Sequence alignment of human HNF1α and HNF1β. Identical residues and homologous residues are shown in red and blue, respectively. POUS and POUH regions are also highlighted by boxes with cyan and orange backgrounds, respectively. Within the DNA-binding domain region, sequence variations are minimal except the flexible linker between the two domains where insertion/deletion has occurred. The starting residue numbers are indicated in parentheses.
For overexpression and purification, the recombinant plasmid was used to transform Escherichia coli BL21 (DE3) cells (Novagen). Transformed cells were grown on LB media containing 50 µg ml−1 kanamycin, induced with 0.5 mM IPTG at an OD600 of 0.6–0.8 and then grown for a further 4 h at 310 K. The expressed N-terminal GST-fusion proteins were isolated using glutathione-agarose beads (Molecular Probes) in the presence of 0.6 M NaCl to prevent nonspecific binding to bacterial DNA. HNF1β was liberated with TEV protease (complete digestion; data not shown) and further purified by ion-exchange chromatography (Mono-S FPLC). Cleavage with TEV protease produced the desired 91–310 sequence extended by three residues of sequence RGS at the N-terminus. After elution, the protein-containing fractions were analyzed by SDS–PAGE followed by staining with Coomassie blue and were estimated to be 95% pure. Fractions were pooled and stored at 193 K as a 10%(v/v) glycerol stock.
2.2. Preparation of DNA oligonucleotides
Tritylated oligonucleotides were purchased from the Midland Certified Reagent Company (Midland, TX, USA) and further purified by reverse-phase HPLC on a C8 XTerra prep column (Waters) using a linear 5–50% acetonitrile gradient in 50 mM triethylamine acetate buffer pH 7.0. Excess mobile phase containing acetonitrile was removed using HiTrapQ (GE Healthcare) and the trityl groups were removed with 80%(v/v) acetic acid. The deprotected oligonucleotides were precipitated with 75%(v/v) ethanol, dissolved in water for concentration measurement by A 260 and lyophilized prior to storage at 193 K. Double-stranded DNAs were generated by heating equimolar amounts of complementary oligonucleotides to 368 K for 10 min and slowly cooling to 277 K.
2.3. Electrophoretic mobility shift assay (EMSA)
Binding reactions of different protein:DNA molar ratios were assembled at 298 K in a total volume of 10 µl in 10 mM Tris pH 7.5, 50 mM NaCl, 1 mM MgCl2, 0.5 mM DTT, 0.5 mM EDTA, 100 µg ml−1 BSA, 10 µg ml−1 poly(dI-dC) and 4%(v/v) glycerol. Purified HNF1β was incubated in the binding buffer at 298 K for 10 min prior to the addition of oligo DNA. Oligo DNA was identical to that used in crystallization. Reaction mixtures were incubated at 298 K for an additional 20 min before being loaded onto a 6% non-denaturing polyacrylamide gel that had been pre-run at 277 K for 30 min in 0.5× TBE (45 mM Tris, 45 mM borate, 1 mM EDTA pH 8.3). Electrophoresis continued for about 1 h before the gel was stained with 0.1 µg ml−1 ethidium bromide in 0.5× TBE buffer.
2.4. Dynamic light-scattering measurement
The effective molecular radius and the homogeneity/monodispersity of the complex within various particular buffer conditions were measured using the dynamic light-scattering instrument Dynapro-99 (Proterion Corporation) and the DynaPro-MSTC200 microsampler (Protein Solutions) and analyzed using DYNAMICS v.5.26.60 (Protein Solutions). 20 µl sample was inserted into the cuvette with the temperature control set to 293 K. The light-scattering signal was collected at a wavelength of 830.7 nm. Protein concentrations were about 2 mg ml−1 in each buffer and an average of 15 readings were recorded for each measurement.
2.5. Isothermal titration calorimetry
To obtain a direct binding affinity between HNF1β and DNA, 0.12 mM HNF1β 91–310 was titrated against 4 µM dsDNA using a VP-ITC microcalorimeter (MicroCal). The samples of DNA and proteins were prepared in the same buffer containing 20 mM imidazole pH 8.0 and 50 mM NaCl that had been identified by the Solubility Screening Kit (Jena Biosiences; see Results and discussion ). Duplex DNA was placed in the thermostated cell (1.5 ml) and HNF1β 91–310 was introduced into the stirred cell by means of a syringe via 25 individual injections (each of 8 µl and of 16 s in duration, with 240 s intervals in between injections). The experiment was performed at 303 K and the data were fitted using the software Origin7.0 (MicroCal).
2.6. Crystallization and optimization
The initial crystallization trials were carried out at 295 K in 24-well plates using the sparse matrix (Jancarik & Kim, 1991 ▶) by the hanging-drop vapor-diffusion method. Drops consisting of 0.5 µl protein–DNA solution were mixed with an equal volume of reservoir solution and were equilibrated against 500 µl reservoir solution. The conditions yielding small crystals were further optimized by variation of crystallization parameters and additives. Although many different DNA constructs were used for screenings, diffraction-quality crystals were only reproducibly obtained using the overhang 21-mer shown in Fig. 2 ▶.
Figure 2.
Overhang 21-mer used to obtain diffraction-quality crystals. The HNF1β-recognition motif is underlined.
The initial condition contains 20%(v/v) PEG 300, 5%(w/v) PEG 8000, 10%(v/v) glycerol and 0.1 M Tris pH 8.5. Various optimization approaches were made and various conditions of dehydration and crystal annealing were tested using the home X-ray source: a Rigaku generator coupled with an R-AXIS IV++ image-plate detector.
2.7. Data collection and processing
Since the original mother liquor contains sufficient amount of cryoprotectants (increasing the concentration of PEG 300 and glycerol did not improve the data quality in terms of the resolution limit and mosaicity), the crystals were directly harvested from the drop and instantly plunged into liquid nitrogen and stored for data collection. The native data were collected at 100 K at APS (SER-CAT 22-BM) and processed using HKL2000 (Otwinowski & Minor, 1997 ▶).
3. Results and discussion
For overexpression of HNF1β, we used the modified version of the pET41a vector that harbors a TEV cleavage site instead of a thrombin site. This was performed because it had been discovered from our previous experience that thrombin can nonspecifically cut proteins of interest, including HNF1β (data not shown). Recombinant HNF1β proteins have been purified to homogeneity and mixed with pure DNA for subsequent studies. One additional mutant construct was made for initial crystallization screenings in which 30 amino acids in the flexible linker between the POUS and POUH domains were deleted in order to reduce the size of the linker for favorable crystal contacts and to mimic the linker length of HNF1α that had been successfully crystallized (Chi et al., 2002 ▶). However, to our surprise, only the wild-type proteins produced crystals.
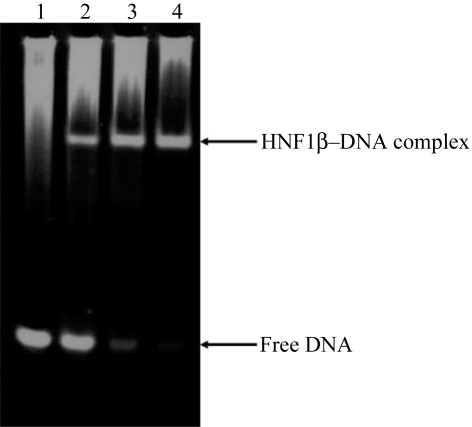
To confirm the DNA-binding activity of the recombinant HNF1β, we performed EMSA experiments and the result is shown in Fig. 3 ▶, in which the correct 2:1 stoichiometry of HNF1β:dsDNA was also confirmed. We chose the HNF1β target sequence from the human α1-antitrypsin promoter because it showed a high binding affinity (Chi et al., 2002 ▶; Courtois et al., 1987 ▶).
Figure 3.
EMSA experiment to confirm HNF1β binding to the 21-mer DNA duplex used for crystallization. Lane 1, dsDNA only; lane 2, 1:1 HNF1β:dsDNA; lane 3, 2:1 HNF1β:dsDNA; lane 4, 3:1 HNF1β:dsDNA.
Dynamic light scattering (DLS) is a useful tool to monitor protein solubility behavior and to predict favorable crystallization conditions (Wilson, 2003 ▶). We used the Solubility Screening Kit (Jena Biosciences) in conjunction with DLS (Jancarik et al., 2004 ▶) in order to identify the optimal buffer condition for complex formation and crystallization. The best polydispersity value of 0.06 was obtained with buffer containing 20 mM imidazole pH 8.0 and 50 mM NaCl and this optimal buffer was used for subsequent ITC experiments and crystallization.
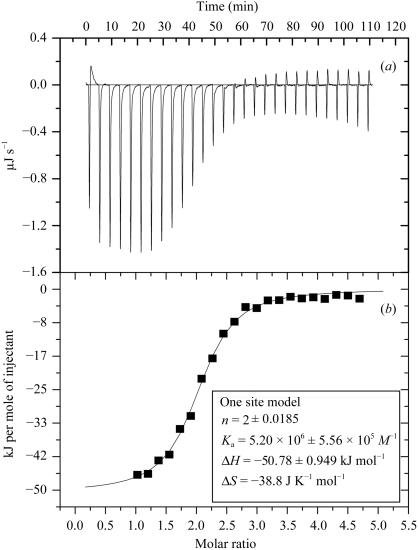
To measure the direct binding affinity of HNF1β to its cognate DNA sequence, we performed ITC experiments with different concentrations of HNF1β (in the syringe) and DNA (in the cell). Purified HNF1β 91–310 and DNA were exhaustively dialyzed against the optimal binding buffer (20 mM imidazole pH 8.0, 50 mM NaCl) and thoroughly degassed prior to the ITC experiments. The concentrations were chosen so that the specific binding would be titrated to saturation. The optimal concentrations were 0.12 mM HNF1β 91–310 titrated against 4 µM dsDNA and the results are shown in Fig. 4 ▶. The curve fitted to the binding isotherm also confirms that the binding occurred with a 2:1 HFN1β:dsDNA stoichiometry. The continuous line represents the non-linear least-squares fit of the overall binding affinity K a = 5.20 × 10⁶ M −1 (K d = 1.92 × 10⁻⁷ M), enthalpy ΔH = −50.78 kJ mol−1 and stoichiometry n = 2 (dimer) for dsDNA (Fig. 4 ▶). This value will serve as a reference when we study the effects of MODY mutations on DNA binding in the near future.
Figure 4.
ITC data for complex formation. (a) Trace of the isothermal titration of HNF1β with a recognition target DNA. The experiment was performed in 20 mM imidazole pH 8.0 and 50 mM NaCl at 303 K. The concentrations of reactants are 0.12 mM HNF1β and 4 µM dsDNA. (b) Binding isotherm obtained from the experiment shown in (a). The association constant and the enthalphy and entropy of association are presented in the enclosed box.
For crystallization, purified HNF1β 91–310 and the overhang 21-mer DNA were simply mixed in a 2:1.2 molar ratio, dialyzed against the optimal binding buffer (20 mM imidazole pH 8.0, 50 mM NaCl) and concentrated using 10 kDa cutoff concentrators (Millipore). The protein–DNA concentration was 10 mg ml−1 for initial screenings and 20 mg ml−1 for final optimization. The initial crystallization trials were carried out at 295 K in 24-well plates with Crystal Screens I and II (Hampton Research), Natrix and PEG/Ion Screens (Hampton Research), Cryo I and II (Molecular Dimensions) and Wizard I and II (DeCode) by the hanging-drop vapor-diffusion method.
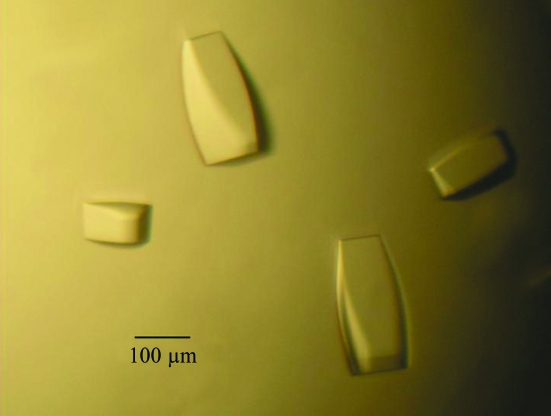
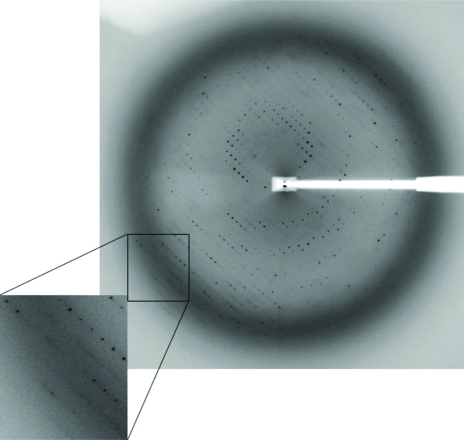
Crystals were grown at 295 K using the hanging-drop vapor-diffusion method and the presence of the HNF1β–DNA complex in the crystals was confirmed by running both SDS–PAGE and 0.5% agarose gels (data not shown). Crystals initially appeared within 2 d and continued to grow until they reached average dimensions of 0.1 × 0.1 × 0.3 mm (Fig. 5 ▶). Various pH values, temperatures and additives such as organic solvents, divalent cations and polyamines were used in attempts to improve the crystal quality. The final optimized condition consisted of 6%(v/v) PEG 300, 5%(w/v) PEG 8000, 8%(v/v) glycerol and 0.1 M Tris pH 8.0. Addition of 2%(v/v) dioxane to the mother liquor helped to reduce the number of nucleations and the diffusion rate; however, it did not improve the crystal quality in terms of resolution limit and mosaicity. Dehydration and crystal annealing have been used by many others to improve crystal diffraction (Heras & Martin, 2005 ▶); however, neither seemed to work for our crystals. The flexible linker consisting of over 50 residues (Fig. 1 ▶) might contribute to the intrinsic weak diffracting power of HNF1β–DNA crystals. The best crystal diffracted to 3.2 Å at the synchrotron source and belongs to space group R3, with unit-cell parameters a = b = 172.69, c = 72.43 Å (Fig. 6 ▶). The value of the Matthews coefficient (Matthews, 1968 ▶) is 3.28 Å3 Da−1 for one complex in the asymmetric unit and the estimated solvent content is 62.2% based on the protein specific density of 1.34. Final native data-collection statistics are summarized in Table 1 ▶.
Figure 5.
Typical crystals of HNF1β–DNA complex. Approximate size is indicated by a black bar.
Figure 6.
A typical X-ray diffraction pattern from a crystal of HNF1β–DNA complex. The diffraction image was recorded on a MAR-225 CCD detector at the APS SER-CAT 22-BM beamline. The oscillation range was 1°.
Table 1. Data-collection statistics for HNF1β–DNA crystal.
Values in parentheses are for the highest resolution bin.
| Space group | R3 |
| Unit-cell parameters (Å,°) | a = b = 172.69, c = 72.43, α = β = 90, γ = 120 |
| Wavelength (Å) | 0.97923 |
| Resolution | 30–3.2 (3.31–3.20) |
| Observed reflections | 79773 |
| Unique reflections | 12635 |
| Redundancy | 6.3 (3.8) |
| Completeness (%) | 94.3 (63.4) |
| I/σ(I) | 28.8 (3.35) |
| Rmerge† (%) | 8.3 (29.2) |
| Matthews coefficient (Å3 Da−1) | 3.28 |
| Solvent content (%) | 62.2 |
| Molecules per ASU | 1 HNF1β–DNA complex |
R
merge = 
 , where I(h) is the intensity of reflection h,
  is the sum over all reflections and
  is the sum over i measurements of reflection h.
The structure was determined by molecular replacement using the HNF1α–DNA complex structure (Chi et al., 2002 ▶) as a search model and the program MOLREP (Vagin & Teplyakov, 1997 ▶) from the CCP4 suite (Winn, 2003 ▶). An unambiguous solution was found that gave an initial R value of 51.4% and a correlation coefficient of 0.36 using 15–3.5 Å data. The subsequent σ-weighted 2F o − F c map after rigid-body refinement clearly revealed density corresponding to the structural differences between the search model and the HNF1β–DNA complex. Model improvement and refinement of the structure are in progress.
Acknowledgments
We wish to thank the staff at Advanced Photon Source beamline 22-BM (SER-CAT) for their help with data collection and Bartley Morris for his assistance in sample preparations. Use of the Advanced Photon Source is supported by the US Department of Energy. This work was funded by the Juvenile Diabetes Research Foundation (2004-503) to YIC and NIH Grant P20RR20171 from the COBRE program of the National Center for Research Resources.
References
- Bellanne-Chantelot, C., Chauveau, D., Gautier, J. F., Dubois-Laforgue, D., Clauin, S., Beaufils, S., Wilhelm, J. M., Boitard, C., Noel, L. H., Velho, G. & Timsit, J. (2004). Ann. Intern. Med.140, 510–517. [DOI] [PubMed] [Google Scholar]
- Bingham, C. & Hattersley, A. T. (2004). Nephrol. Dial. Transplant.19, 2703–2708. [DOI] [PubMed] [Google Scholar]
- Bohn, S., Thomas, H., Turan, G., Ellard, S., Bingham, C., Hattersley, A. T. & Ryffel, G. U. (2003). J. Am. Soc. Nephrol.14, 2033–2041. [DOI] [PubMed] [Google Scholar]
- Chi, Y. I. (2005). Hum. Genet.116, 433–444. [DOI] [PMC free article] [PubMed] [Google Scholar]
- Chi, Y. I., Frantz, J. D., Oh, B. C., Hansen, L., Dhe-Paganon, S. & Shoelson, S. E. (2002). Mol. Cell, 10, 1129–1137. [DOI] [PubMed] [Google Scholar]
- Courtois, G., Morgan, J. G., Campbell, L. A., Fourel, G. & Crabtree, G. R. (1987). Science, 238, 688–692. [DOI] [PubMed] [Google Scholar]
- Edghill, E. L., Bingham, C., Ellard, S. & Hattersley, A. T. (2006). J. Med. Genet.43, 84–90. [DOI] [PMC free article] [PubMed] [Google Scholar]
- Fajans, S. S., Bell, G. I. & Polonsky, K. S. (2001). N. Engl. J. Med.345, 971–980. [DOI] [PubMed] [Google Scholar]
- Giuffrida, F. M. & Reis, A. F. (2005). Diabetes Obes. Metab.7, 318–326. [DOI] [PubMed] [Google Scholar]
- Heras, B. & Martin, J. L. (2005). Acta Cryst. D61, 1173–1180. [DOI] [PubMed] [Google Scholar]
- Horikawa, Y., Iwasaki, N., Hara, M., Furuta, H., Hinokio, Y., Cockburn, B. N., Lindner, T., Yamagata, K., Ogata, M., Tomonaga, O., Kuroki, H., Kasahara, T., Iwamoto, Y. & Bell, G. I. (1997). Nature Genet.17, 384–385. [DOI] [PubMed] [Google Scholar]
- Igarashi, P., Shao, X., McNally, B. T. & Hiesberger, T. (2005). Kidney Int.68, 1944–1947. [DOI] [PubMed] [Google Scholar]
- Jancarik, J. & Kim, S.-H. (1991). J. Appl. Cryst.24, 409–411. [Google Scholar]
- Jancarik, J., Pufan, R., Hong, C., Kim, S.-H. & Kim, R. (2004). Acta Cryst. D60, 1670–1673. [DOI] [PubMed] [Google Scholar]
- Malecki, M. T. (2005). Diabetes Res. Clin. Pract.68, Suppl. 1, S10–S21. [Google Scholar]
- Matthews, B. W. (1968). J. Mol. Biol.33, 491–497. [DOI] [PubMed] [Google Scholar]
- Mitchell, S. M. & Frayling, T. M. (2002). Mol. Genet. Metab.77, 35–43. [DOI] [PubMed] [Google Scholar]
- Odom, D. T., Zizlsperger, N., Gordon, D. B., Bell, G. W., Rinaldi, N. J., Murray, H. L., Volkert, T. L., Schreiber, J., Rolfe, P. A., Gifford, D. K., Fraenkel, E., Bell, G. I. & Young, R. A. (2004). Science, 303, 1378–1381. [DOI] [PMC free article] [PubMed] [Google Scholar]
- Otwinowski, Z. & Minor, W. (1997). Methods Enzymol.276, 307–326. [DOI] [PubMed]
- Pearson, E. R., Badman, M. K., Lockwood, C. R., Clark, P. M., Ellard, S., Bingham, C. & Hattersley, A. T. (2004). Diabetes Care, 27, 1102–1107. [DOI] [PubMed] [Google Scholar]
- Rey-Campos, J., Chouard, T., Yaniv, M. & Cereghini, S. (1991). EMBO J.10, 1445–1457. [DOI] [PMC free article] [PubMed] [Google Scholar]
- Ryffel, G. U. (2001). J. Mol. Endocrinol.27, 11–29. [DOI] [PubMed] [Google Scholar]
- Vagin, A. & Teplyakov, A. (1997). J. Appl. Cryst.30, 1022–1025. [Google Scholar]
- Wilson, W. W. (2003). J. Struct. Biol.142, 56–65. [DOI] [PubMed] [Google Scholar]
- Winn, M. D. (2003). J. Synchrotron Rad.10, 23–25. [DOI] [PubMed] [Google Scholar]
- Yamagata, K. (2003). Endocr. J.50, 491–499. [DOI] [PubMed] [Google Scholar]


