

Abstract
The termination of mature eukaryotic mRNAs occurs at specific polyadenylation sites located downstream from stop codons in the 3′-untranslated region (UTR). An accurate delineation of these sites is essential for the study of 3′-UTR-based gene regulation and for the design of pertinent probes for transcriptome analysis. Although typical poly(A) sites are located between 0 and 2 kb from the stop codon, EST sequence analyses have identified sites located at unexpectedly long ranges (5–10 kb) in a number of genes. Here we perform a complete mapping of EST and full-length cDNA sequences on the mouse and human genome to observe putative poly(A) sites extending beyond annotated 3′-ends and into the intergenic regions. We introduce several quality parameters for poly(A) site prediction and train a classification tree to associate P-values to predicted sites. We observe a higher than background level of high-scoring sites up to 12–15 kb past the stop codon, both in human and mouse. This leads to an estimate of about 5000 human genes having unreported 3′-end extensions and about 3500 novel polyadenylated transcripts lying in present “intergenic” regions. These high-scoring, long-range poly(A) sites corresponding to novel transcripts and gene extensions should be incorporated into current human and mouse gene repositories.
Keywords: polyadenylation, 3′ UTR, transcript isoforms, genome annotation
INTRODUCTION
Most eukaryotic mRNAs are terminated by cleavage and addition of a poly(A) tail at specific sites in the 3′-untranslated region (3′-UTR). At least 50% of genes have several polyadenylation sites (Beaudoing and Gautheret 2001; Tian et al. 2005), sometimes combined with alternative splicing of 3′-exons. This phenomenon produces 3′-UTRs of varying sequences and lengths. As 3′-UTRs may contain essential regulatory elements, including large numbers of microRNA targets (John et al. 2004; Lewis et al. 2005), delineating 3′-ends accurately is an important aspect of gene annotation. The average size of human 3′-UTRs ranges in the literature from 600 nt to 1000 nt (Stratchan and Read 1999; Mignone et al. 2002). Human transcripts in the current Ensembl genome database (Birney et al. 2004) display a mean 3′-UTR size of 997 nt. How far are these estimates from reality, and should we look further in the 3′ direction for alternative 3′-ends? Several recent studies based on EST sequence analysis have emphasized the existence of unexpectedly long transcripts for a number of genes (Iseli et al. 2002; Tian et al. 2005; Yan and Marr 2005). None has attempted, however, to evaluate long-range poly(A) sites systematically at the genomic scale.
The most abundant data source on polyadenylated transcripts is the public database of complete or partial cDNAs. Although full-length cDNA sequences are knowingly more reliable than ESTs, their coverage with respect to the number of transcript isoforms is poor in comparison. On the other hand, EST data are both error prone and fragmented, each EST covering only a fraction of a transcript. In order to curb mispredictions, previous EST-based analyses have imposed heavy constraints when mapping ESTs to gene or genome sequences. This often involved requiring that ESTs display a complete match to a trusted mRNA sequence, for instance, from the RefSeq database (Pruitt et al. 2005). This method has been efficient for the identification of many novel poly(A) sites (Gautheret et al. 1998; Tian et al. 2005), but it was obviously unable to detect 3′-UTRs extending beyond reference transcripts. Another approach authorized UTR extension when supported by overlapping EST clusters. This revealed many novel long-range poly(A) sites (Iseli et al. 2002), yet this could not identify poly(A) sites that were not bridged to existing transcripts by overlapping ESTs.
In this study, we set out to develop new quality criteria to identify and evaluate long-range poly(A) sites. Based on a mapping of 3′-EST and cDNA sequences onto the whole human and mouse genomes, we collected all the putative poly(A) sites, independently of their position relative to known genes. About half of the poly(A) sites were found in the vicinity of or within known genes, but the other half was observed in so-called intergenic regions from several kilobases up to several hundreds of kilobases from any known gene. A detailed characterization of these “intergenic” poly(A) sites led us to propose an unexpected number of long-distance 3′-extensions to known genes, as well as frequent polyadenylated transcripts corresponding to yet-unidentified genes. We show here how these sites can be evaluated and classified.
RESULTS
Poly(A) site mapping
We performed a complete mapping of all 3′-ESTs and full-length cDNAs onto the human and mouse genomes. Potential poly(A) sites were identified based on several quality criteria including the presence of at least two ESTs/cDNAs ending at the same site, correct alignment of cDNA/EST extremities, absence of adenosine tracts in downstream genomic regions that may cause internal priming of cDNA, and presence of a valid poly(A) signal near the predicted 3′-end (see Materials and Methods). This protocol identified a total of 89,778 and 71,561 candidate poly(A) sites in the human and mouse genomes, respectively. Less than half of these (41%) were within known Ensembl genes or in close proximity (<2 kb), leaving a large proportion of potential poly(A) sites in apparent intergenic regions.
Distribution of poly(A) sites
We focused our analysis on predicted poly(A) sites located between two annotated genes, gi and gi + 1, located on the same DNA strand between the stop codon of gi and the transcription start of gi + 1. Such sites may be classified into three categories:
True poly(A) sites pertaining to the 5′-flanking annotated gene, hereafter called “gene-assigned PAS” or GPAS.
True poly(A) sites pertaining to a yet-unannotated gene in the intergenic region, hereafter called “intergenic PAS” or IPAS.
Mispredicted sites, hereafter called “false-positive PAS” or FPAS.
The solid blue curve in Figure 1 shows the overall distribution of candidate sites at increasing distance from the nearest annotated stop codon. Expectedly, site distribution is denser in the vicinity of the stop codon where true poly(A) sites occur. Total site density then slowly decreases over the whole region, suggesting that the background density is not constant. This background slope is most likely explained by the finite distance between genes in the genome. As a random false-positive site cannot be located at an arbitrary long distance from the nearest gene, the distribution of randomly occurring false positives is slightly skewed toward shorter distances. To estimate this background noise, we picked random positions in intergenic regions so that the density at 50 kb was the same as that observed in our data set. The resulting distribution (Fig. 1, dashed blue line) closely follows the observed distribution between 50 kb and 15–20 kb past the stop codon, clearly departing from the reference curve at ∼15 kb. This suggests GPAS may extend to 15 kb past the stop codon, which is considerably longer than the commonly accepted 3′-UTR size range.
FIGURE 1.

Distribution of predicted poly(A) sites downstream of stop codons in the human genome. (Solid blue curve) Total predicted sites; (dashed blue curve) simulated background noise (see text); (solid red curve) sites supported by 5′-ESTs mapping to flanking gene; (solid gray curve) ratio of (total sites)/(5′-EST-supported sites). Curves are smoothed using a moving average over a 2000-nt window.
Reach of 3′ extensions (GPAS)
In order to distinguish poly(A) sites of the GPAS type, i.e., pertaining to the 5′-flanking annotated gene, we sought, for each 3′-EST, a corresponding 5′-EST sequenced from the same cDNA clone. When any of the 3′-ESTs supporting a poly(A) site had a corresponding 5′-EST mapping within the nearest annotated transcript, the poly(A) site was said to be “5′-supported,” meaning that it most likely pertains to the 5′-flanking transcription unit or gene. The solid red curve in Figure 1 shows the distribution of 5′-supported sites. The overall shape is similar to that of the general curve, with a steep initial decline followed by a slow decrease over the whole 50-kb region. The position at which 5′-supported sites disappear and yield way to background noise is not clearly apparent. To identify this position, we computed the ratio (5′-supported sites)/(total sites) (Fig. 1, solid gray curve). This curve is easier to exploit as it becomes flatter at ∼9 kb past the stop codon. We infer that true 5′-supported sites extend up to 9 kb past the stop codon and that subsequent 5′-supported sites are false positives.
The observed 9-kb limit for 5′-supported sites does not mean that actual GPAS are limited to this position. Indeed, inherent limitations of the cDNA cloning procedure limit, in turn, the maximal distance separating 3′- and 5′-ESTs, so that if an actual poly(A) site was located 10 kb or more from its annotated part, it is very unlikely that the corresponding 5′-EST would fall within the annotation. Consequently, the sites we observed above from 9 kb to 15 kb past the stop codon can be real in spite of their lack of 5′-EST support. Based on the blue curve in Figure 1, and after subtracting background, their number would be ∼900. Although Figure 1 suggests that distal sites could extend even further, up to 20 kb or more, it should be noted that the curves are shown on a log scale and the actual number of sites in this area is very small relative to sites in the 0–15-kb range. On the other hand, it is reasonable to assume that all poly(A) sites located at 20 kb or more past the nearest stop codon are either IPAS or FPAS.
False and true positives
What fraction of long-range or intergenic poly(A) site candidates can we expect to be real? Variations in the ratio of canonical to total poly(A) signals (CS/TS) can help answer this question. All predicted poly(A) sites contain either a canonical AAUAAA signal, or one of 12 possible single-base variants (Beaudoing et al. 2000). We expect false positives to display a CS/TS ratio close to random (i.e., 0.089; see Materials and Methods), while true sites should use canonical signals more often. Figure 2 plots the CS/TS ratio for predicted poly(A) sites, as a function of their distance to the nearest stop codon. In the vicinity of stop codons, canonical signal usage is ∼52%, while long-range sites are only 25%–35% canonical. Both human and mouse curves meet background level at ∼14 kb, consistent with previous results. At 0.29–0.34, the observed background is consistently higher than the random CS/TS ratio, which indicates a significant level of true positives at this range. On the other hand, the CS/TS ratio at short range (0.52) appears lower than the expected CS/TS of 0.65 for true sites (see Materials and Methods), indicating a significant level of false positives at this range.
FIGURE 2.

Ratio of canonical to total poly(A) signals (CS/TS) in EST-based poly(A) site candidates, as a function of distance from the nearest stop codon, for mouse (top) and human (bottom). The stop codon is taken as the end of translation of the Ensembl transcript. (Horizontal lines) Estimated background, as measured by averaging CS/TS ratios between 30 kb and 50 kb after the stop codon. Curves are smoothed using a moving average over a 2000-nt window.
Assuming that GPAS are completely absent at 40–50 kb past the stop codon and IPAS are completely absent at 1 kb past the stop codon, and knowing the observed and expected CS/TS ratios at each range, we obtained a four-equation system presented in Materials and Methods. It results from these equations that, in intergenic regions, the density of IPAS is 35 sites/500 nt and the density of FPAS is 71 sites/500 nt, i.e., a proportion of 33% true positives. Considering that 42,123 sites are located at 20 kb or more from the stop codon, we conclude that 13,713 intergenic sites (33%) are true poly(A) sites pertaining to yet-unannotated genes, or IPAS. Using the same calculation, we conclude that ∼23% of short-range sites (<1 kb) are false positives. The same calculation carried out from mouse data yields 13% FPAS at 1 kb and 50% FPAS at 40 kb. This lower false-positive rate in mouse may be attributed to the larger proportion of high-quality EST and full-length cDNA libraries available for this organism.
Classifying and scoring poly(A) sites
Our next objective was to obtain a measure of the accuracy of each predicted poly(A) site. Such a measure would be a useful guide in the selection of the most promising candidates for experimental validation of novel 3′ isoforms or intergenic transcripts. We identified the following eight parameters as relevant for this purpose: presence of a canonical AAUAAA signal; support by full-length cDNAs; support by 5′-ESTs from the same clone mapping in the upstream genomic region; support by ESTs/cDNAs overlapping an upstream poly(A) site; support by poly(T)/(A)-terminated ESTs; support by ESTs/cDNAs from different libraries; the number of supporting ESTs/cDNAs; and the ERPIN score for the downstream region—ERPIN is a motif search program that we used previously to characterize sequence elements around poly(A) sites (Legendre and Gautheret 2003). The first six parameters are binary, while the last two are integer or real numbers. In this context of mixed discrete and continuous variables, classification trees are a suitable supervised learning method (Breiman et al. 1984). For this purpose, a training set was defined using 18,740 sites located in the 0–1-kb region past the stop codon (Class 1) and 42,243 sites located at 20 kb or more (Class 2). Based on the above analysis, we expect Class 1 to be strongly enriched in true sites and Class 2 to be enriched in false positives. Classes 1 and 2 thus serve as our positive and negative models, respectively. In the typical classification tree procedure, the complete training set is partitioned recursively, using at each step the combination of variable and value that best discriminates Class 1 and Class 2 objects. This results in a final unique tree where each terminal leaf maximizes enrichment in Class 1 or Class 2 elements. Although powerful, such trees suffer from instability. Breiman (2001) suggests using instead of a single tree a set of K trees each trained over a random sample of the original data. Each tree uses at each node a subset of variables taken randomly among all variables. Figure 3 shows the contribution of each variable to this “random forest.” The number of ESTs/cDNAs is the most discriminating factor by a large margin, and support by a full-length cDNA is second.
FIGURE 3.

Relative importance of the eight different variables used in the classification tree. (can) Presence of a canonical AAUAAA signal; (erpin) ERPIN score for downstream region; (pApT) support by poly(T)/(A) terminated ESTs; (over) support by ESTs/cDNAs overlapping an upstream poly(A) site; (cDNA) support by full-length cDNAs; (monolib) support by ESTs/cDNAs from different libraries; (fivep EST 50k) support by 5′-ESTs from same clone mapping in upstream 50-kb region; (nbEST) number of supporting ESTs/cDNAs.
The score of a poly(A) site corresponds to the proportion of trees within the “random forest” that classified it in Class 1. This score thus estimates the probability of a site belonging to Class 1. In the following, the term “P-value” refers to this probability. The top two rows of Table 1 show the number of initial Class 1 and Class 2 sites that would be classified as Class 1 or Class 2 using a P-value cutoff of 0.5. Obviously, a larger than expected number of Class 1 sites end up in Class 2 (8818 sites, or 47.1%). We changed the P-value cutoff in such a way that the overall number of reclassified sites (former Class 1 sites reclassified as Class 2 and vice versa) reflected as much as possible our above estimate of false positives in the corresponding regions. At a score cutoff of 0.02, 18.8% of Class 1 sites are reclassified as Class 2, while 36.2% of Class 2 sites are reclassified as Class 1 (Table 1, bottom rows). This compares better to our estimate of 19% FPAS (false positives) in Class 1 and 37% IPAS (true positives) in Class 2.
TABLE 1.
Classification table for Class 1 (<1 kb from stop) and Class 2 (>20 kb from stop) poly(A) sites

The discrepancy between the size of predicted classes at a P-value cutoff of 0.5 and estimated numbers of true and false positives could be related to the quality of our initial training set. As a control, we used 4674 poly(A) sites from the VEGA database of known transcripts (Ashurst et al. 2005), as a training set for Class 1. We obtained similar ratios of reclassified sites as with our initial training set (data not shown). Therefore, the most likely explanation for the observed discrepancy is that the probability of belonging to Class 1 is not exactly equivalent to the probability of being a bona fide site, since a fraction of bona fide sites may have Class 2 characteristics using our limited parameter set. As a result, we expect to observe a predominance of bona fide sites in the P-value range over 0.02 rather than over 0.5. However, high-confidence poly(A) sites should be sought in the range 0.5–1.
After classification trees were trained on the test sets, all predicted poly(A) sites in the human and mouse genomes were scored using the same set of trees. Figure 4 shows the variation in average P-value for sites located at increasing distance from stop codons. P-values are necessarily higher near stop codons, from where the positive training set comes. The background P-value corresponding to IPAS + FPAS is reached at ∼12 kb and stays flat over the whole intergenic region represented. This provides further support, independently from direct counts used in Figure 1, that distal poly(A) sites extend to at least 12 kb past the nearest annotated stop codon.
FIGURE 4.

Average P-values of poly(A) sites as a function of distance from the stop codon, in human and mouse. P-values are averaged in a 500-nt window.
Probable 3′-extensions and novel transcripts
We can now use classification P-values to distinguish false positives from real sites, at any location in the genome. Independent measures indicate an over-representation of poly(A) sites up to 12–13 kb from the nearest annotated stop codon. At this distance, it is unlikely that a complete gene is inserted between the poly(A) site and the upstream annotated gene, as human genes are on average 30 kb long and separated by 100 kb. Even if exceptions are possible, we consider these predicted poly(A) sites to be overwhelmingly of the GPAS type, i.e., pertaining to the nearest annotated gene, or FPAS, i.e., false positives. There are 44,216 predicted sites in this distance range. If we consider as GPAS only those sites with P-values >0.5, there are 18,523 GPAS in the 0–13-kb range. Out of these, 12,492 sites lie within the boundaries of Ensembl transcripts, but 6031 would extend Ensembl transcripts beyond their 3′-ends, with a median extension of 1971 nt. At a more conservative cutoff (P > 0.9), there would still be 3566 human genes with an unreported 3′-extension. All gene extensions with P > 0.5 are presented in Supplemental Table 1 (see http://tagc.univ-mrs.fr/pub/).
To assess whether long-range GPAS could be attributed to a transcriptional “leakage” or to more significant, conserved events, we compared occurrences of long-range sites in pairs of human–mouse orthologs. Table 2 shows positions of most distal poly(A) sites in pairs of human/mouse orthologs. A very low χ2-test P-value (<10e − 40) indicates a strong dependency between the occurrence of long-range sites in human and mouse, suggesting that long-range sites do not result from a random phenomenon. Finally, most of the long-range sites are caused by alternative polyadenylation. Table 3 shows that, while 65.1% of short-range sites (0–1 kb) are first sites, the fraction of first sites drops to 14.4% in the 9–10-kb region. In other words, as many as 85% of the long-range sites correspond to alternative transcripts.
TABLE 2.
Contingency table showing number of poly(A) sites at specified distance from stop codon in human/mouse orthologous gene pairs

TABLE 3.
Percentage of poly(A) sites that are first sites (5′-most) or unique sites, in function of their distance from stop codon

We could not detect any excess of poly(A) sites after 15 kb past the stop codon. We assume that all sites lying past this limit are of the IPAS (intergenic) or FPAS (false positives) type. Using a P-value of 0.5 to distinguish FPAS from IPAS, there would be 3406 IPAS, and 1278 IPAS with P > 0.9. These predicted poly(A) sites that correspond to yet unnanotated genes are presented in Supplemental Table 2 (see http://tagc.univ-mrs.fr/pub/).
Signal-free polyadenylated transcripts
The above analysis only considered poly(A) sites flanked by a AAUAAA signal or a known variant. If we considered transcripts that do not contain a known signal at their 3′-ends, our procedure would predict 252,000 sites in the human genome instead of 90,000. These signal-free sites are not irrelevant biologically, as recent studies in yeast have shown that “cryptic unstable transcripts” lacking a poly(A) signal could be polyadenylated by a distinct polyadenylation complex and subsequently targeted for degradation (LaCava et al. 2005; Wyers et al. 2005). We extracted all these signal-free poly(A) sites and submitted them to our classification tree procedure using the same training set as above to define true and false positives. Interestingly, only 16,450 of the 252,000 signal-free sites were classified as high quality (P > 0.5). In other words, ∼94% of sites lacking an apparent poly(A) signal are classified as false positives. As low P-values are mostly related to low EST or full-length cDNA support (on average, 30 ESTs or cDNAs per site at P > 0.5 versus 4 ESTs or cDNA per site at P < 0.5), this observation is consistent with most of these sites resulting from unstable transcripts. On the other hand, the 16,000 signal-less sites with high P-values generally have strong EST/cDNA support and may thus represent abundant functional transcripts. High-quality, signal-free sites are listed in Supplemental Table 3 (see http://tagc.univ-mrs.fr/pub/).
DISCUSSION
We introduced here a method to evaluate the quality of poly(A) sites predicted by cDNA/EST mapping and applied it to poly(A) sites that are unusually distant from known genes. While high-confidence sites represent 53% of sites in the vicinity of the stop codon, they only represent 7.5% of sites located past 20 kb from the stop codon. Although a fraction of low-quality sites may result from limitations of the prediction procedure such as undetected internal priming or ambiguous EST-to-genome alignments, we hypothesize that most low-quality sites result either from background transcription or background polyadenylation at cryptic poly(A) sites. Given the massive amount of transcript variation that is observed in mammals (Kampa et al. 2004; Carninci et al. 2005; Johnson et al. 2005), rare transcripts containing a functional poly(A) signal can be expected to form at multiple locations in the genome. Beside these background signal-containing transcripts, we expect other transcripts that do not contain poly(A) signals and yet are polyadenylated, as shown in yeast (LaCava et al. 2005; Wyers et al. 2005). Indeed, 252,000 such signal-free sites are observed in the human genome, and their ratio of high-quality sites is also very low (6%). This suggests that the largest part of overall poly(A) site diversity in the genome may represent nonfunctional sites that may be polyadenylated by chance or through some surveillance system.
Our protocol identifies over 3400 high-quality poly(A) sites corresponding to novel intergenic transcripts, or ∼19% of the total signal-containing sites. These results are consistent with the extensive transcription observed in intergenic regions and on reverse strands of known genes (Kampa et al. 2004; Johnson et al. 2005). As we defined here “intergenic” regions as located between two genes on the same DNA strand, some of the novel intergenic poly(A) sites we identified may correspond to antisense transcripts for genes on the reverse strand.
Beside intergenic transcripts, we identify likely 3′-extensions for 5045 different genes (a quarter of mapped genes), mostly in the form of novel alternative poly(A) sites. These additional sites may have escaped prior analyses because they represent minor transcript isoforms: sites located at 3 kb past the stop codon are supported by ∼35% fewer ESTs on average than sites at 1 kb from the stop codon (11 ESTs/site versus 31 ESTs/site, respectively). Alternatively, owing to technical limitations in cDNA library constructions, cDNAs deriving from very long mRNAs are not cloned as efficiently as others. Few full-length cDNA clone inserts are longer than 6 kb in practice, and this should include both UTRs and the coding sequence (Carninci et al. 2001). We may therefore expect very long transcripts to escape sequencing more frequently than others.
Long-range poly(A) sites that extend the 3′-boundaries of known genes can be the result of three distinct mechanisms. First, they may result from alternative cleavage site selection by the polyadenylation machinery. This occurs when the long-range site is located in the same 3′-exon as one or more other sites. Second, they may result from alternative splicing, in which alternative 3′-exons each carries its own poly(A) site (Edwalds-Gilbert et al. 1997). We excluded alternative 3′-exons as much as possible in our analysis. However, since there may be many unreported splice variants, some long-range poly(A) sites may be associated with alternative splicing, especially in the case of very distant sites. A third mechanism that may explain long-range poly(A) sites is the presence of transcription starts in the 3′-exon of genes (Carninci et al. 2005). The distal sites identified here would then correspond to partial, forward-strand transcripts, for which no function has been proposed yet.
Further functional analysis of poly(A) sites may be possible only through experiment or comparative genomics. In a recent comparative analysis of distal sites, we showed that <20% of poly(A) sites in or near terminal exons bear conserved features that suggest a selective pressure for specific sites (Ara et al. 2006). There are known examples of functional elements located at long distance in the UTR that may confer functional importance to a distal poly(A) site. For instance, the Fibroblast Growth Factor 2 mRNA has a translational enhancer located between 5.4 kb and 6.8 kb past the stop codon, between the fourth and eighth poly(A) site (Touriol et al. 2000). Use of alternative poly(A) sites for this mRNA was shown to be regulated in a tissue-specific manner, thus producing transcripts that may or may not contain the enhancer.
The detection of novel alternative or extended 3′-UTRs in more than 5000 human genes may have consequences for functional studies of UTR-mediated gene regulation. Searches for microRNA targets or other regulatory elements should include these neglected UTR regions, and, as novel poly(A) sites increase transcript diversity, they should be incorporated as well into microarray probe design procedures.
MATERIALS AND METHODS
Poly(A) site prediction
EST sequences were obtained from dbEST v. Dec/1/2006 (7,536,519 human and 4,688,994 mouse ESTs). Full-length cDNA sequences were obtained from H-Inv 2.4 (56,419 sequences) (Imanishi et al. 2004) and FANTOM 3.00 (102,801 sequences) (Carninci et al. 2003). ESTs annotated as 3′ were extracted (1,922,199 human and 1,895,840 mouse ESTs), and trailing poly(A) or poly(T) sequences of 5 nt or more were removed, with one mismatch (non-A or non-T) allowed for poly(A)/T tails of 10 or more. Both 3′-EST and cDNA sequences were aligned to the Ensembl Repeat-Masked genome sequences (human NCBI35.dec and mouse NCBIM34.dec) using the Megablast program (McGinnis and Madden 2004). We did not need here an accurate exon junction mapping software, since we were only interested in the end of the 3′-exon. All hits presenting at least 95% identity with the genomic sequence were retained (hit size is >28 nt at default E-value). Partial hits flanking a Repeat-Masked region of the genome were then realigned to the locally unmasked region. Hits with 95% identity after this step were retained. Clusters were formed with ESTs having either their 5′ or 3′ extremities falling within a 10-nt distance (ESTs were not oriented at this stage). Each cluster was analyzed using a sliding window to locate the most likely cleavage site, defined as the position where the window contains the most EST/cDNA ends. The following filters were then applied:
Dangling ends: Discard hits with more than five unmatched nucleotides at the extremity of the cDNA or EST sequence.
Internal priming: Discard cleavage sites flanked by A-rich region (at least nine As out of 10 nt) in the 50-nt downstream genomic sequence.
Poly(A) signal: Retain only cleavage sites of which 30-nt upstream genomic sequence contains one of the 11 poly(A) signals identified in our previous study (Beaudoing et al. 2000): AAUAAA, AUUAAA, AGUAAA, UAUAAA, CAUAAA, GAUAAA, AAUAUA, AAUACA, AAUAGA, AAUGAA, ACUAAA, or two variants identified more recently, AACAAA, UUUAAA (F. Lopez and D. Gautheret, unpubl.).
Only those cleavage sites passing the filters and supported by at least two ESTs/cDNAs were retained as predicted poly(A) sites. From the starting EST/cDNA data sets, we finally retained 870,770 ESTs and 32,497 full-length cDNAs to identify 89,778 different poly(A) sites in human, and 863,133 ESTs and 49,173 full-length cDNAs to identify 71,561 different poly(A) sites in mouse.
Assignment of poly(A) sites to nearest upstream stop codon
Poly(A) sites are assigned to transcript sequences taken from Ensembl (human: 37.35j, mouse: 37.34e) (Birney et al. 2004) or (when applicable) to alternative transcripts taken from the AltSplice database Release 2 (Le Texier et al. 2006). If the poly(A) site lies within one or more annotated transcripts, downstream from the end of translation, the site is affected by each of these transcripts, and the “distance to stop” is measured from the end of translation to the poly(A) site. If the poly(A) site lies upstream of the end of translation, then it is considered as “in CDS” and is not used for calculating the distance to stop. If the poly(A) site does not map any annotated transcript, it is affected to the nearest 5′-transcript.
Measure of FPAS, IPAS, and GPAS based on CS/TS ratio
Assuming that GPAS are completely absent at 40–50 kb past the stop codon, all sites observed at this distance are either FPAS or IPAS. The density of aggregated sites at 40–50 kb is 106 per 500-nt window (Fig. 1); therefore:
 |
where TSipas and TSfpas are the total numbers of sites of the IPAS and FPAS type, respectively, in a 500-nt window. At 40–50 kb from the stop codon, the CS/TS ratio is 0.275 (Fig. 2). This ratio is the combination of the CS/TS ratio of GPAS and that of IPAS, so that:
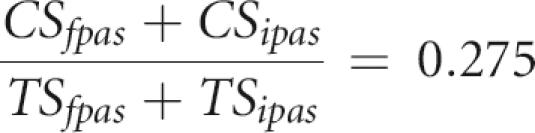 |
where CSipas and CSfpas are the numbers of canonical sites of the IPAS and FPAS type, respectively. We can assume that the CS/TS ratio of FPAS is that of random sequences. The expected random ratio of canonical (AAUAAA) to total sites (AAUAAA + 12 variants above) was computed using human genome single-nucleotide frequencies G: 0.205; C: 0.205; A: 0.295; and T: 0.295 (Venter et al. 2001) and is:
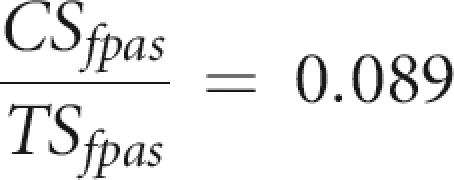 |
Finally, we estimate that the CS/TS ratio of true sites (IPAS) should be close to that observed in a reliable set of transcript 3′-ends, such as H-inv full-length cDNAs (Imanishi et al. 2004) or the VEGA database (Ashurst et al. 2005). CS/TS is 0.67 in H-inv2 and 0.63 in VEGA. Hence, using a mean value of 0.65:
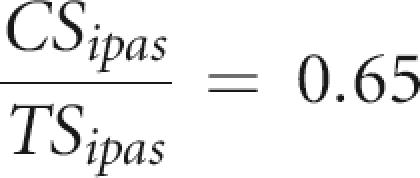 |
It ensues from the four equations that TSipas = 35 and TSfpas = 71. The same equations were solved for mouse poly(A) sites using the Fantom transcript database (Carninci et al. 2003) to obtain the reference CS/TS ratio. Based on a CS/TS ratio of 0.61 in the Fantom database, observed CS/TS ratios of 0.54 at 1 kb and 0.345 at 40 kb (Fig. 2), and a density of 100 sites per 500 nt, we obtain TSipas = 50 and TSfpas = 50 for mouse.
Classification tree
The partition was performed as follows: when a variable x is binary, rules are of the type x = 0 and when x is integer or real, the rule has the form x < s, where s is a threshold taken among all the possible values of x. At each node of the tree, an optimal binary rule is selected among all the possible rules over the eight variables. Optimality is measured using entropy, such that data at a node are split in two subsamples using the rule that minimizes the heterogeneity of the new subsets with respect to the class of its observations. Random forests (Breiman 2001) were generated based on a 500 bootstrap sample.
SUPPLEMENTAL MATERIAL
The main data files generated during this study can be found at http://tagc.univ-mrs.fr/pub/ These include complete lists of predicted, scored poly(A) sites in the human and mouse genomes, and supplemental tables 1, 2 and 3, containing subsets of reliable poly(A) sites corresponding to unreported extensions of known transcripts, unreported intergenic transcripts, and signal-less transcripts, respectively.
ACKNOWLEDGMENTS
This work was funded by the European Commission FP6 Programme, contract number LSHG-CT-2003-503329.
Footnotes
Article published online ahead of print. Article and publication date are at http://www.rnajournal.org/cgi/doi/10.1261/rna.136206.
REFERENCES
- Ara, T., Lopez, F., Ritchie, W., Benech, P., Gautheret, D. Conservation of alternative polyadenylation patterns in mammalian genes. BMC Genomics. 2006;7 doi: 10.1186/1471-2164-7-189. [DOI] [PMC free article] [PubMed] [Google Scholar]
- Ashurst, J.L., Chen, C.K., Gilbert, J.G., Jekosch, K., Keenan, S., Meidl, P., Searle, S.M., Stalker, J., Storey, R., Trevanion, S., et al. The Vertebrate Genome Annotation (Vega) database. Nucleic Acids Res. 2005;33:D459–D465. doi: 10.1093/nar/gki135. [DOI] [PMC free article] [PubMed] [Google Scholar]
- Beaudoing, E., Gautheret, D. Identification of alternate polyadenylation sites and analysis of their tissue distribution using EST data. Genome Res. 2001;11:1520–1526. doi: 10.1101/gr.190501. [DOI] [PMC free article] [PubMed] [Google Scholar]
- Beaudoing, E., Freier, S., Wyatt, J., Claverie, J.M., Gautheret, D. Patterns of variant polyadenylation signals in human genes. Genome Res. 2000;10:1001–1010. doi: 10.1101/gr.10.7.1001. [DOI] [PMC free article] [PubMed] [Google Scholar]
- Birney, E., Andrews, T.D., Bevan, P., Caccamo, M., Chen, Y., Clarke, L., Coates, G., Cuff, J., Curwen, V., Cutts, T., et al. An overview of Ensembl. Genome Res. 2004;14:925–928. doi: 10.1101/gr.1860604. [DOI] [PMC free article] [PubMed] [Google Scholar]
- Breiman, L. Random forests. Mach. Learn. 2001;45:5–32. [Google Scholar]
- Breiman, L., Friedman, J.H., Olshen, R., Stone, C.J. Classification and regression trees. Wadsworth; Belmont, CA: 1984. [Google Scholar]
- Carninci, P., Shibata, Y., Hayatsu, N., Itoh, M., Shiraki, T., Hirozane, T., Watahiki, A., Shibata, K., Konno, H., Muramatsu, M., et al. Balanced-size and long-size cloning of full-length, cap-trapped cDNAs into vectors of the novel λ-FLC family allows enhanced gene discovery rate and functional analysis. Genomics. 2001;77:79–90. doi: 10.1006/geno.2001.6601. [DOI] [PubMed] [Google Scholar]
- Carninci, P., Waki, K., Shiraki, T., Konno, H., Shibata, K., Itoh, M., Aizawa, K., Arakawa, T., Ishii, Y., Sasaki, D., et al. Targeting a complex transcriptome: The construction of the mouse full-length cDNA encyclopedia. Genome Res. 2003;13:1273–1289. doi: 10.1101/gr.1119703. [DOI] [PMC free article] [PubMed] [Google Scholar]
- Carninci, P., Kasukawa, T., Katayama, S., Gough, J., Frith, M.C., Maeda, N., Oyama, R., Ravasi, T., Lenhard, B., Wells, C., et al. FANTOM Consortium; RIKEN Genome Exploration Research Group and Genome Science Group (Genome Network Project Core Group) The transcriptional landscape of the mammalian genome. Science. 2005;309:1559–1563. doi: 10.1126/science.1112014. [DOI] [PubMed] [Google Scholar]
- Edwalds-Gilbert, G., Veraldi, K.L., Milcarek, C. Alternative poly(A) site selection in complex transcription units: Means to an end? Nucleic Acids Res. 1997;25:2547–2561. doi: 10.1093/nar/25.13.2547. [DOI] [PMC free article] [PubMed] [Google Scholar]
- Gautheret, D., Poirot, O., Lopez, F., Audic, S., Claverie, J.M. Expressed sequence tag (EST) clustering reveals the extent of alternate polyadenylation in human mRNAs. Genome Res. 1998;8:524–530. doi: 10.1101/gr.8.5.524. [DOI] [PubMed] [Google Scholar]
- Imanishi, T., Itoh, T., Suzuki, Y., O'Donovan, C., Fukuchi, S., Koyanagi, K.O., Barrero, R.A., Tamura, T., Yamaguchi-Kabata, Y., Tanino, M., et al. Integrative annotation of 21,037 human genes validated by full-length cDNA clones. PLoS Biol. 2004;2 doi: 10.1371/journal.pbio.0020162. [DOI] [PMC free article] [PubMed] [Google Scholar]
- Iseli, C., Stevenson, B.J., de Souza, S.J., Samaia, H.B., Camargo, A.A., Buetow, K.H., Strausberg, R.L., Simpson, A.J., Bucher, P., Jongeneel, C.V. Long-range heterogeneity at the 3′ ends of human mRNAs. Genome Res. 2002;12:1068–1074. doi: 10.1101/gr.62002. [DOI] [PMC free article] [PubMed] [Google Scholar]
- John, B., Enright, A.J., Aravin, A., Tuschl, T., Sander, C., Marks, D.S. Human microRNA targets. PLoS Biol. 2004;2 doi: 10.1371/journal.pbio.0020363. [DOI] [PMC free article] [PubMed] [Google Scholar]
- Johnson, J.M., Edwards, S., Shoemaker, D., Schadt, E.E. Dark matter in the genome: Evidence of widespread transcription detected by microarray tiling experiments. Trends Genet. 2005;21:93–102. doi: 10.1016/j.tig.2004.12.009. [DOI] [PubMed] [Google Scholar]
- Kampa, D., Cheng, J., Kapranov, P., Yamanaka, M., Brubaker, S., Cawley, S., Drenkow, J., Piccolboni, A., Bekiranov, S., Helt, G., et al. Novel RNAs identified from an in-depth analysis of the transcriptome of human chromosomes 21 and 22. Genome Res. 2004;14:331–342. doi: 10.1101/gr.2094104. [DOI] [PMC free article] [PubMed] [Google Scholar]
- LaCava, J., Houseley, J., Saveanu, C., Petfalski, E., Thompson, E., Jacquier, A., Tollervey, D. RNA degradation by the exosome is promoted by a nuclear polyadenylation complex. Cell. 2005;121:713–724. doi: 10.1016/j.cell.2005.04.029. [DOI] [PubMed] [Google Scholar]
- Le Texier, V., Riethoven, J.J., Kumanduri, V., Gopalakrishnan, C., Lopez, F., Gautheret, D., Thanaraj, T.A. Transcript pattern variants annotated for both alternative splicing and alternative polyadenylation. BMC Bioinformatics. 2006;7 doi: 10.1186/1471-2105-7-169. [DOI] [PMC free article] [PubMed] [Google Scholar]
- Legendre, M., Gautheret, D. Sequence determinants in human polyadenylation site selection. BMC Genomics. 2003;4 doi: 10.1186/1471-2164-4-7. [DOI] [PMC free article] [PubMed] [Google Scholar]
- Lewis, B.P., Burge, C.B., Bartel, D.P. Conserved seed pairing, often flanked by adenosines, indicates that thousands of human genes are microRNA targets. Cell. 2005;120:15–20. doi: 10.1016/j.cell.2004.12.035. [DOI] [PubMed] [Google Scholar]
- McGinnis, S., Madden, T.L. BLAST: At the core of a powerful and diverse set of sequence analysis tools. Nucleic Acids Res. 2004;32:W20–W25. doi: 10.1093/nar/gkh435. [DOI] [PMC free article] [PubMed] [Google Scholar]
- Mignone, F., Gissi, C., Liuni, S., Pesole, G. Untranslated regions of mRNAs. Genome Biol. 2002;3 doi: 10.1186/gb-2002-3-3-reviews0004. [DOI] [PMC free article] [PubMed] [Google Scholar]
- The NCBI handbook [Internet]. 2002. Chapter 17, The Reference Sequence (RefSeq) Project. National Library of Medicine (US), National Center for Biotechnology Information, Bethesda, MD.
- Pruitt, K.D., Tatusova, T., Maglott, D.R. NCBI Reference Sequence (RefSeq): A curated non-redundant sequence database of genomes, transcripts and proteins. Nucleic Acids Res. 2005;33:D501–D504. doi: 10.1093/nar/gki025. [DOI] [PMC free article] [PubMed] [Google Scholar]
- Stratchan, T., Read, A.P. Human molecular genetics 2. BIOS Scientific Publishers Ltd; New York: 1999. [Google Scholar]
- Tian, B., Hu, J., Zhang, H., Lutz, C.S. A large-scale analysis of mRNA polyadenylation of human and mouse genes. Nucleic Acids Res. 2005;33:201–212. doi: 10.1093/nar/gki158. [DOI] [PMC free article] [PubMed] [Google Scholar]
- Touriol, C., Roussigne, M., Gensac, M.C., Prats, H., Prats, A.C. Alternative translation initiation of human fibroblast growth factor 2 mRNA controlled by its 3′-untranslated region involves a poly(A) switch and a translational enhancer. J. Biol. Chem. 2000;275:19361–19367. doi: 10.1074/jbc.M908431199. [DOI] [PubMed] [Google Scholar]
- Venter, J.C., Adams, M.D., Myers, E.W., Li, P.W., Mural, R.J., Sutton, G.G., Smith, H.O., Yandell, M., Evans, C.A., Holt, R.A., et al. The sequence of the human genome. Science. 2001;291:1304–1351. doi: 10.1126/science.1058040. [DOI] [PubMed] [Google Scholar]
- Wyers, F., Rougemaille, M., Badis, G., Rousselle, J.C., Dufour, M.E., Boulay, J., Regnault, B., Devaux, F., Namane, A., Seraphin, B., et al. Cryptic Pol II transcripts are degraded by a nuclear quality control pathway involving a new poly(A) polymerase. Cell. 2005;121:725–737. doi: 10.1016/j.cell.2005.04.030. [DOI] [PubMed] [Google Scholar]
- Yan, J., Marr, T.G. Computational analysis of 3′-ends of ESTs shows four classes of alternative polyadenylation in human, mouse, and rat. Genome Res. 2005;15:369–375. doi: 10.1101/gr.3109605. [DOI] [PMC free article] [PubMed] [Google Scholar]