

Abstract
BACKGROUND
Bcl-2 is anti-apoptotic and overexpression is associated with prostate tumor aggressiveness. We hypothesized that Bcl-2 has a role in prostate cancer radiation (RT) response. The relationship of Bcl-2 expression in four prostate cancer cell lines, and the effect of modulating expression with a Bcl-2 antisense oligonucleotide (G3139, Genasense®, oblimersen sodium, Genta Incorporated), to RT was examined.
METHODS
The four cell lines studied were LNCaP (wild type p53), PC3 (p53 null), Bcl-2 stably transfected LNCaP (LNCaP-BST) and PC3 (PC3-BST) cells. Cells were treated with antisense Bcl-2 (AS) alone or with RT (2–6 Gy). Following RT, cells were processed at 3–6 hr for Western blots, 18 hr for Annexin V staining and flow cytometric analysis, 24 hr for caspases 3+7 quantification by fluorometric assay, and immediately for clonogenic survival..
RESULTS
AS caused a significant reduction in Bcl-2 expression in all cell lines. P53 expression was elevated following RT treatment in LNCaP and LNCaP-BST cells. P21 was increased by RT treatment in all cell lines. AS caused a significant increase in caspase 3+7 activity over the mismatch (MM) controls in all cell lines. When AS was combined with RT, caspase 3+7 activity was further increased significantly over all other groups in all cell lines. Moreover, AS+RT resulted in significantly reduced clonogenic survival over MM+RT, which was dampened in the bcl-2 overexpressing lines.
CONCLUSIONS
To our knowledge, these data demonstrate for the first time that a bcl-2 specific antisense oligonucleotide sensitizes prostate cancer cells to RT. p53 is not required for this effect.
Keywords: Antisense Bcl-2, prostate cancer, radiation, apoptosis
INTRODUCTION
One of the primary treatments for prostate cancer is radiation (RT) therapy. Although there has been a reduction in failure rates with the ability to increase radiation (RT) dose using sophisticated planning and delivery methods, local persistence of disease still remains in many cases (1). Cure rates should be improved by enhancing cell death in response to RT.
Bcl-2 belongs to a family of genes whose proteins are central to the regulation of programmed cell death (apoptosis) in both normal and abnormal cells (2,3). Bcl-2 is overexpressed in a variety of human cancers, including prostate cancer (4–6). In prostate cancer, overexpression of bcl-2 is associated with prostate tumor aggressiveness (7–9). Moreover, Bcl-2 protein is increased in the majority of tumors from men with androgen-refractory disease and is associated with resistance to androgen deprivation and RT (4,6,10–13).
Bcl-2 has been targeted to increase the efficacy of androgen deprivation and chemotherapy. Antisense oligonucleotides against Bcl-2 (AS) have been shown to inhibit Bcl-2, postpone the development of resistance to AD, and enhance the effects of chemotherapy (14–20). We hypothesized that AS would sensitize prostate cancer cells to RT. The effects of AS with RT were tested in four cell lines: LNCaP (wild type p53 and androgen sensitive), Bcl-2 stably transfected LNCaP (LNCaP-BST), PC3 (p53 null and androgen insensitive) and Bcl-2 stably transfected PC3 (PC3-BST) cells.
METHODS AND MATERIALS
Antisense Oligonucleotides
The antisense Bcl-2 (AS) molecule used here is an 18-mer phosphorothioate DNA oligonucleotide that is complementary to the first six codons of the human Bcl-2 open reading frame. Antisense Bcl-2 (Genasense®, G3139) was provided by Genta Incorporated (Berkeley Heights, NJ) as a concentrated solution in sterile saline. The sequences of the oligodeoxynucleotides (ODNs) used are as follows: Bcl-2 antisense G3139 (AS; 5′-TCTCCCAGCGTGCGCCAT-3′) and a two-base mismatch control G4126 (MM; 5′-TCTCCCAGCATGTGCCAT-3′). They were stored as frozen aliquots at −20oC.
Cell Culture and Transfection
LNCaP and PC3 cells were maintained in Dulbecco’s modified Eagle’s medium (DMEM)-F12 medium, containing 10% fetal bovine serum (FBS), 1% L-glutamine, and 1% penicillin-streptomycin (complete medium [CM]) as described previously (21). Cells were typically cultured in complete medium for 2–3 days before the incubation with AS.
To establish stable transfectants of bcl-2, 1 x 10⁶ LNCaP, or PC3, cells were seeded onto 10 cm dishes for 48 hours and transfected with the neomycin-selectable pSFFV/bcl-2 expression plasmid (kindly provided by Dr. Stanley Korsmeyer, Harvard Medical School, Boston, MA) by incubation in the presence of 7 μg/ml Lipofectin according to the manufacturer’s procedure (Invitrogen, Carlsbad, CA). Neomycin-resistant cells were selected by incubation with 800 ug/ml Geneticin (G418, Life Technologies, Gaithersburg, MD) 48 hours after transfection. Expression of Bcl-2 was tested by Western blot analysis of cells selected from individual colonies.
Western Blot Analysis
The protein levels of Bcl-2, p53, p21, Bax and β-actin were analyzed as described previously (21,22). Cells were cultured in complete medium for 2–3 days, incubated with 200 nM of AS or MM in 4.5 ml culture medium for 24–48 hours in the presence of 7 μg/ml Lipofectin, and then given 5 Gy of γ-irradiation (RT) using a Cesium-137 irradiator (Model 81-14R, J.L. Shepherd & Associates, San Fernando, CA). Cells were lysed at various times after RT in a lysis buffer (50 mM Tris-HCL, pH 6.8, 2% sodium dodecyl sulfate [SDS] with protease inhibitor cocktail set I [Calbiochem, San Diego, CA]), and were sonicated for 30 second on ice. Protein concentration was determined using the BCA protein assay reagent kit (Pierce, Rockford, IL). Identical amounts of protein were fractionated by SDS-PAGE electrophoresis and transferred to polyvinylidene difluoride (PVDF) membranes (Millipore, Bedford, MA). The membranes were then incubated in blocking buffer (PBS containing 0.1% Tween 20 and 5% non-fat milk) for 1 h at room temperature and were washed three times with the washing buffer (PBS containing 0.1% Tween 20) for 5 min.
The membranes were then incubated with the appropriate primary antibody; anti-Bcl-2 monoclonal antibody (mAb) at 1:1000 (DAKO A/S, Carpinteria, CA); anti-p53 mAb at 1:1000; anti-p21 mAb at 1:1000 and anti-β actin at 1:5000 dilution (all of the latter antibodies were from Calbiochem, San Diego, CA), or anti-Bax polyclonal IgG at 1:1000 dilution (Santa Cruz Biotechnology, Inc, Santa Cruz, CA) overnight at 4°C. After washing, the membranes were then incubated with 1:1500 diluted sheep anti-mouse IgG or donkey-rabbit IgG horseradish peroxidase conjugated secondary antibody (Amersham Pharmacia Biotech, Piscataway, NJ) for 1 h at room temperature. After repeating the washes, the proteins of interest were detected by the enhanced chemiluminescence reagents according the manufacturer’s directions (Amersham, Aylesbury, UK). The integrated density of protein band was quantified using IMAGE software from the National Institutes of Health.
Measurements of Apoptosis
Two apoptotic assays were performed to determine whether the inhibition of Bcl-2 protein expression in the presence or absence of RT enhanced apoptotic cell death. Apoptosis was measured by Annexin V staining and caspase 3+7 activity assays as described previously (21). LNCaP or LNCaP-BST (2 X 10⁵), and PC3 or PC-BST cells (1.5 X 10⁵), were seeded onto 60 mm dish for 48 hours and then treated with 200 nM AS or MM in the presence of Lipofectin (7 ng/mL) for 24 or 48 hr. Cells were then irradiated to 5 Gy. After 18 or 24 hr, cells floating in the culture were collected and those attached to the plates were harvested by trypsinization. The collected cells in the supernatant and trypsinized cells were centrifuged and incubated with Annexin V-Phycoerythrin (Annexin V-PE) and 7-amino-actinomycin D (7-AAD) (Guava Technologies Inc, Burlingame, CA) according to the manufacturer’s instructions. The percentage of Annexin V-PE positive and 7-AAD negative cells were used as a measuew of early apoptosis. The samples were then analyzed by flow cytometry on a GuavaPC personal flow cytometer (Guava Technologies).
Caspase 3+7 activity was measured using a fluorometric substrate, Z-DEVD–Rhodamine (The Apo-ONETM Homogeneous Caspase-3/7 Assay kit; Promega, Madison, WI), as described previously (21). Cells were incubated with 200 nM AS or MM for 24–48 hr and then irradiated to 5 Gy. After 24 hr, a total of 5 X 10⁴ cells in 50 nL culture medium were mixed with 50 nL of Homogeneous Caspase-3/7 reagent in 96 well plates and incubated at room temperature for 24 hours. Substrate cleavage was quantified fluorometrically at 485 nm excitation and 538 nm emission. Fluorescence was measured on a fluorescent plate reader (LabSystems Inc, Franklin, MA).
Radiation Treatment and Clonogenic Assay
Cells were incubated with 500 nM AS or MM in presence of Lipofectin (7 μg/ml). After 48 hr, cells were irradiated to 2, 4 and 6 Gy. Immediately following irradiation, the cells were trypsinized, serially diluted, and known numbers replated onto 100-mm dishes. The plates were incubated for 14 days and stained with 0.25% methylene blue. Colonies were counted using an automated counter (Imaging products Internation, Inc, Chantilly, VA). Clonogenic survival results were corrected for differences in plating efficiency ([number of colonies/number of colonies of unirradiated control] x 100) for the various culture conditions. Dilutions for clonogenic assay were done in triplicate and the results were averaged together (intra-experiment averages). The data shown in the clonogenic survival table represent the average from multiple experiments (inter-experiment average), as delineated.
RESULTS
Effect of Antisense Bcl-2 ± RT on the Expression of Multiple Proteins
As shown by Western blot analysis in Figure 1A, Bcl-2 expression was inhibited by AS (200 nM) in wild-type LNCaP cells. The inhibition of Bcl-2 expression by AS was dose-dependent (data not shown). There was no change in Bcl-2 expression at 3 and 6 hr after RT (5 Gy) exposure, although as expected, the level of p53 increased at 3 hr after RT. A relative increase in p53 from RT was also seen when AS was present, although the level of p53 at 0 hr RT was higher and the relative increase from RT less than without AS present. The level of p21 was increased by RT treatment alone at 3 hr and 6 hr, which was slightly blunted by AS treatment. There was no substantive change in Bax protein levels by either AS or RT treatment.
Figure 1.

Effects of AS-Bcl-2 and radiation on protein levels of Bcl-2, p53, p21 and Bax in LNCaP, LNCaP-BST, PC3 and PC3-BST cells. AS or MM was administered at 200 nM and 48 hr later RT at 5 Gy was given. The cells were harvested at 0, 3 and 6 hr later and the protein levels were examined by Western blotting. LC, Lipofectin control.
Figure 1B shows the effect of AS and/or RT on the expression of these proteins in LNCaP-BST cells. Although it is not apparent in the figure because of differences in exposure times between panels A and B, LNCaP-BST cells had a 13.6 fold higher level of Bcl-2 expression over wild-type LNCaP cells, as determined by integrated density measurements of the Western blot bands. AS caused a reduction in the Bcl-2 protein level. In the presence of AS, the relative changes in p53 and p21 were blunted, like that seen in wild-type LNCaP cells. Bax protein expression was altered little by AS and/or RT.
The expression of Bcl-2, p21 and Bax were also determined in PC3 (p53 null and androgen insensitive) cells and Bcl-2 overexpressing PC3 (PC3-BST) cells. Although it is not apparent in the figure because of differences in exposure times between panels C and D, Bcl-2 expression was increased 15 fold in PC3-BST cells over wild-type PC3 cells. As illustrated in Figures 1C and 1D, Bcl-2 expression was significantly inhibited by AS treatment in both PC3 and PC3-BST cells. P21 was elevated to a greater degree after RT treatment in PC3, in contrast to PC3-BST cells. No change on Bax protein levels was observed in both cell lines following Bcl-2 inhibition by AS and/or RT.
Effect of AS±RT on Apoptotic Cell Death
The ability of AS to enhance the apoptotic response of prostate cancer cells to RT was measured by Annexin V binding and Caspase 3+7 production assays. Cells were cultured in complete medium for 2–3 days and then incubated with 200 nM AS or MM for 24 h with LNCaP and LNCaP-BST cells, and 48 h with PC3 and PC3-BST cells, before 5 Gy γ-irradiation was administered. Twenty-four hours after irradiation, cells were prepared for caspase 3+7 activity.
A summary of seven experiments measuring caspase 3+7 activity in LNCaP and LNCaP-BST cells is shown in Table 1. AS exposure resulted in a significant increase in caspase 3+7 activity over that of MM or the lipofectin controls. When AS was combined with RT, caspase 3+7 activity was further increased significantly over all of the other groups in both cell lines. AS+RT also resulted in a similar pattern for early apoptosis by Annexin V staining in LNCaP cells. Table 2 shows that early apoptosis (Annexin-V-PE-positive and 7-AAD-negative) was significantly higher from AS+RT (32.2%) over either AS alone (23.1%), RT alone (8.4%) or MM+RT (18%). However, for LNCaP-BST cells there was no significant difference between AS and AS+RT.
Table 1.
Effects of AS±RT on LNCaP and LNCaP-BST Cell Caspase-3 + 7 Activity
| Caspase-3 + 7 activity (RFLUs)
|
||||
|---|---|---|---|---|
| Treatment | LNCaP | LNCaP-BST | ||
| Mean ± SEM | p* | Mean ± SEM | p* | |
| LC | 91 ± 15 | ----- | 117 ± 14 | ----- |
| MM | 196 ± 28 | .976 | 193 ± 27 | 1.000 |
| AS | 493 ± 58 | <0.0001 | 593 ± 51 | <0.00001 |
| LC+RT | 123 ± 14 | <0.0001 | 117 ± 8 | <0.00001 |
| MM+RT | 257 ± 19 | 0.308 | 206 ± 22 | 1.000 |
| AS+RT** | 819 ± 42 | <0.0001 | 773 ± 57 | <0.0001 |
LNCaP and LNCaP-BST cells were treated with AS-Bcl-2 (200 nM) alone or in combination with RT (5 Gy). Caspase-3+7 activity was measured by fluorometric assay.
Abbreviations: RFLUs = relative fluorescence units; LC = lipofectin control; AS = antisense Bcl-2; MM = antisense mismatch; RT = radiation.
Compared to group above, One way ANOVA, Bonferroni test. The data shown represent the mean values (M±SEM) from seven independent experiments for each cell line.
Other LNCaP ANOVA comparisons (n = 6 treatment groups): AS + RT versus AS alone (p <0.0001). Other LNCaP-BST comparisons (n = 6 treatment groups): AS + RT versus AS alone (p = 0.013).
Table 2.
Effects of AS+RT on LNCaP and LNCaP-BST Cell Annexin V Staining
| % Annexin V positive | ||||
|---|---|---|---|---|
| Treatment | LNCaP | LNCaP-BST | ||
| Mean ± SEM | p* | Mean ± SEM | p* | |
| LC | 5.3 ± 0.7 | ----- | 2.6 ± 0.6 | ----- |
| MM | 14.0 ± 0.5 | 0.001 | 12.4 ± 2.2 | 0.037 |
| AS | 23.1 ± 1.9 | <0.0001 | 15.6 ± 2.4 | 1.000 |
| LC+RT | 8.4 ± 0.7 | <0.0001 | 3.7 ± 0.7 | 0.006 |
| MM+RT | 18.0 ± 1.4 | <0.0001 | 13.3 ± 3.0 | 0.044 |
| AS+RT** | 32.2 ± 1.3 | <0.0001 | 17.1 ± 2.2 | 1.000 |
LNCaP and LNCaP-BST cells were treated with AS-Bcl-2 (200 nM) alone or in combination with RT (5 Gy). The percentage of early apoptotic cells was measured by flow cytometric analysis of the percentage of Annexin V-PE positive and 7-AAD negative stained cells.
Abbreviations: LC = lipofectin control; AS = antisense Bcl-2; MM = antisense mismatch; RT = radiation.
Compared to group above, One way ANOVA, Bonferroni test. The data shown represent the mean values (±SEM) from five independent experiments.
Other LNCaP ANOVA comparisons (n = 6 treatment groups): AS + RT versus AS alone (p<0.0001). Other LNCaP-BST comparisons (n = 6 treatment groups): AS + RT versus AS alone (p=1.000).
In PC3 and PC3-BST cells, the pattern of apoptotic cell death observed by the caspase 3+7 assay was very similar to that seen in both LNCaP and LNCaP-BST cells. As shown in Table 3, caspase 3+7 activity was increased from AS+RT as compared to AS or RT treatment individually for both PC3 and PC3-BST cell lines. Table 4 shows that AS caused a significant increase in the percentage of Annexin V positive cells compared to MM and the lipofectin controls. The combination of AS+RT did not result in a further increase in early apoptosis by Annexin V staining in PC3 cells. There was no difference between AS and MM or AS and AS+RT by Annexin V binding assay in PC3-BST cells (Table 4).
Table 3.
Effects of AS+RT on PC3 and PC3-BST Cell Caspase-3 + 7 Activity
| Caspase-3 + 7 activity (RFLUs) | ||||
|---|---|---|---|---|
| Treatment | PC3 | PC3-BST | ||
| Mean ± SEM | p* | Mean ± SEM | p* | |
| LC | 75 ± 6 | ----- | 88 ± 16 | ----- |
| MM | 231 ± 45 | 0.873 | 214 ± 35 | 1.000 |
| AS | 435 ± 43 | 0.221 | 464 ± 77 | 0.011 |
| LC+RT | 97 ± 7 | 0.003 | 115 ± 32 | <0.0001 |
| MM+RT | 287 ± 58 | 0.331 | 330 ± 45 | 0.046 |
| AS+RT** | 781 ± 106 | <0.0001 | 757 ± 58 | <0.0001 |
PC3 and PC3-BST cells were treated with AS-Bcl-2 (200 nM) alone or in combination with RT (5 Gy). Caspase-3+7 activity was measured by fluorometric assay.
Abbreviations: RFLUs = relative fluorescence units; LC = lipofectin control; AS = antisense Bcl-2; MM = antisense mismatch; RT = radiation.
Compared to group above, one way ANOVA, Bonferroni test. The data shown represent the average values (±SEM) from six independent PC3 experiments and seven independent PC3-BST experiments.
Other PC3 ANOVA comparisons (n = 6 treatment groups): AS + RT versus AS alone (p=0.002). Other PC3-BST comparisons (n = 6 treatment groups): AS + RT versus AS alone (p =0.002).
Table 4.
Effects of AS+RT on PC3 and PC3-BST Cell Annexin V Staining
| % Annexin V positive | ||||
|---|---|---|---|---|
| Treatment | PC3 | PC3-BST | ||
| Mean ± SEM | p* | Mean ± SEM | p* | |
| LC | 2.4 ± 0.6 | ----- | 1.2 ± 0.2 | ----- |
| MM | 10.6 ± 2.3 | 0.092 | 7.2 ± 1.8 | 0.09 |
| AS | 20.5 ± 7.9 | 0.022 | 12.2 ± 1.9 | 0.30 |
| LC+RT | 3.5 ± 1.1 | <0.0001 | 2.5 ± 0.6 | 0.001 |
| MM+RT | 13.4 ± 0.9 | 0.022 | 8.0 ± 0.7 | 0.182 |
| AS+RT** | 19.2 ± 1.6 | 0.684 | 14.0 ± 2.1 | 0.092 |
PC3 and PC3-BST cells were treated with AS-Bcl-2 (200 nM) alone or in combination with RT (5 Gy) and the percentage of apoptotic cells was measured by flow cytometric analysis of the percentage of Annexin V-PE positive and 7-AAD negative stained cells.
Abbreviations: LC = lipofectin control; AS = antisense Bcl-2; MM = antisense mismatch; RT = radiation therapy.
Compared to group above, One way ANOVA, Bonferroni test. The data shown represent the average values (±SEM) from five independent experiments.
Other PC3 ANOVA comparisons (n = 6 treatment groups): AS + RT versus AS alone (p=1.000). Other PC3-BST comparisons (n = 6 treatment groups): AS + RT versus AS alone (p=1.000).
Effect of AS±RT on Overall Cell Death by Clonogenic Cell Survival Assay
Clonogenic cell survival experiments were performed to determine whether the increase in apoptotic cell death translates into reduced overall cell survival. Figures 2 and 3 show the clonogenic assay results for LNCaP, LNCaP-BST and PC3, PC3-BST cells grown in vitro for 2–3 days and then treated with Lipofectin alone, AS, or MM for 24hr prior to RT. The cells were replated immediately after 2, 4 or 6 Gy RT. Overall cell survival was significantly reduced over the LC and MM controls by AS when 4 and 6 Gy RT was given to LNCaP cells (Table 5). A similar trend was observed for PC3 cells (Table 6), although AS + 4 Gy RT was not significantly different from MM + 4 Gy RT. There were no significant differences in the survival between AS+RT and MM+RT in LNCaP-BST or PC3-BST cells.
Figure 2.
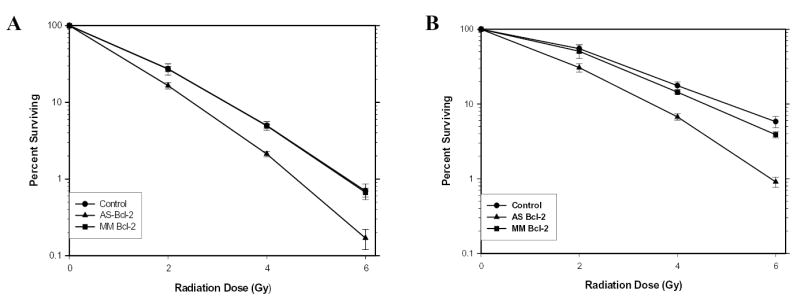
Clonogenic assays of LNCaP (A) and PC3 (B) cells cultured in CM with LC, AS or MM (500 nM) added for 24 hr before RT at 2, 4 or 6 Gy. Values were expressed as a percent surviving (Mean±SEM) from five separate experiments for LNCaP cells and three separate experiments for PC3 cells.
Figure 3.
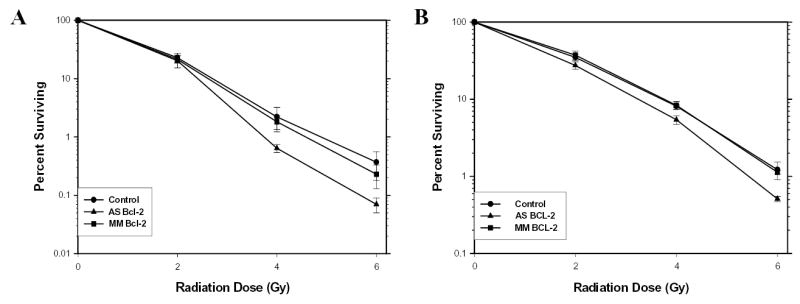
Clonogenic assays of LNCaP-BST (A) and PC3-BST (B) cells cultured in CM with LC, AS or MM (500 nM) added for 24 hr before RT at 2, 4 or 6 Gy. Values were expressed as a percent surviving (Mean±SEM) from six separate experiments for LNCaP-BST cells and three separate experiments for PC3-BST cells.
Table 5.
Effects of AS±RT on LNCaP and LNCaP-BST Cell Clonogenic Survival
| Percent Surviving | ||||
|---|---|---|---|---|
| Treatment | LNCaP | LNCaP-BST | ||
| Mean ± SEM | p* | Mean ± SEM | p* | |
| LC + 2 Gy | 27.2 ± 4.5 | ----- | 22.9 ± 4.2 | ----- |
| AS + 2 Gy | 16.5 ± 1.6 | 0.082 | 20.2 ± 5.0 | 1.00 |
| MM + 2 Gy | 27.2 ± 2.1 | 0.081 | 21.5 ± 3.0 | 1.00 |
| LC + 4 Gy | 4.9 ± 0.63 | ----- | 2.2 ± 1.0 | ----- |
| AS + 4 Gy | 2.1 ± 0.17 | 0.001 | 0.64 ± 0.1 | 0.307 |
| MM + 4 Gy | 4.9 ± 0.28 | 0.001 | 1.82 ± 0.48 | 0.635 |
| LC + 6 Gy | 0.70 ± 0.16 | ----- | 0.37 ± 0.19 | ----- |
| AS + 6 Gy | 0.17 ± 0.05 | 0.013 | 0.07 ± 0.02 | 0.304 |
| MM + 6 Gy | 0.67 ± 0.086 | 0.020 | 0.23 ± 0.1 | 1.00 |
Compared to group above, One way ANOVA, Bonferroni test (n=3 treatment groups per test). The data shown represent the average values (± SEM) from five independent LNCaP experiments and six independent LNCaP-BST experiments.
Table 6.
Effects of AS±RT on PC3 and PC3-BST Cell Clonogenic Survival
| Percent Surviving | ||||
|---|---|---|---|---|
| Treatment | PC3 | PC3-BST | ||
| Mean ± SEM | p* | Mean ± SEM | p* | |
| LC + 2 Gy | 55.0 ± 6.9 | ----- | 34.8 ± 3.3 | ----- |
| AS + 2 Gy | 30.6 ± 4.0 | 0.19 | 27.4 ± 3.0 | 0.621 |
| MM + 2 Gy | 50.9 ± 10.5 | 1.00 | 37.2 ± 4.7 | 0.335 |
| LC + 4 Gy | 17.6 ± 2.0 | ----- | 8.1 ± 0.4 | ----- |
| AS + 4 Gy | 6.7 ± 0.6 | 0.002 | 5.4 ± 0.7 | 0.112 |
| MM + 4 Gy | 14.4 ± 0.3 | 0.338 | 8.3 ± 1.0 | 0.082 |
| LC + 6 Gy | 5.8 ± 1.0 | ----- | 1.2 ± 0.3 | ----- |
| AS + 6 Gy | 0.9 ± 0.1 | 0.004 | 0.5 ± 0.04 | 0.095 |
| MM + 6 Gy | 3.9 ± 0.4 | 0.043 | 1.1 ± 0.06 | 0.155 |
Compared to group above, One way ANOVA, Bonferroni test (n=3 treatment groups per test). The data shown represent the average values (± SEM) from three independent PC3 experiments and three independent PC3-BST experiments.
DISCUSSION
Bcl-2 is implicated in the response to, and progression after, radiotherapy for prostate cancer. Clinical studies have shown that bcl-2 overexpression, and/or abnormal bax expression, is associated with an increased risk of biochemical failure after radiotherapy (12,13,23). Moreover, Bcl-2 is overexpressed in recurrent tumors after RT (24,25). Radiation may also affect Bcl-2 expression, which seems to be dependent in part on p53. Some studies have shown that RT decreases Bcl-2 protein expression in p53 wild-type cell lines, in conjunction with apoptotic cell death (26); p53 appears to down-regulate the expression of bcl-2 and transactivate bax (27). Moreover, Bcl-2 appears to inhibit the nuclear transport of p53 in response to genotoxic stress (28). In cell lines lacking wild-type p53 protein, bcl-2 expression may be up-regulated by RT (29). In a recent study (30), bcl-2 expression was elevated initially (1 hr) and then decreased after RT in LNCaP cells; there was no significant change of Bcl-2 levels in PC3 cells. We have not observed a consistent change in bcl-2 expression in response to RT in LNCaP (p53wild-type) or PC3 (p53null) cells (21) (Figure 1).
Bcl-2 overexpression has been associated with a reduction in the apoptotic response of prostate cancer cells to chemotherapy, androgen deprivation and RT (11,18,31–33). In one example, Coffey et al. (33) found that diethyl-maleate (DEM) restored sensitivity to radiation induced apoptosis in bcl-2 overexpressing LNCaP cells by inhibiting Bcl-2 protein expression. Although prior studies have indicated that bcl-2 expression affects response to RT, in only one prior study has the interaction of AS and RT been investigated (34).
The down-regulation of Bcl-2 expression via an antisense strategy has been shown to delay the development of insensitivity to androgen deprivation and sensitize cells to the effects of chemotherapeutic agents in prostate tumor models (14–20,35). We hypothesized that AS would sensitize prostate cancer cells to RT and that high Bcl-2 protein levels would reduce this sensitization. The data we describe support this hypothesis in part. When AS was added to RT, there was a significant enhancement in apoptosis by caspase 3+7 activity in parental LNCaP and PC3 cells, as well as in bcl-2 overexpressing LNCaP-BST and PC3-BST cells. The results based on Annexin V binding were less consistent. The combination of AS+RT was superior to AS alone and MM+RT for LNCaP, but not for PC3, LNCaP-BST or PC3-BST cells.
In the lines overexpressing Bcl-2, the measurement of cell death effects by Annexin V staining and clonogenic assay were blunted, but not by the caspase 3+7 assay. One explanation is that the quantity of endogenous Bcl-2 may not be a critical determinant of AS efficacy (36–38). However, it is also possible that the early apoptotic response measured represents a point in time which may be discordant with overall cell death (31). The clonogenic survival results in Figures 2 and 3 are representative of cumulative cell death and are consistent with the mechanism outlined, that AS sensitizes prostate cancer cells to RT and that bcl-2 overexpression reduces this effect. The present study is the first to demonstrate that antisense-Bcl-2 sensitizes prostate cancer cells, independent of p53 status.
More recently, Hara et al (34) found that the inhibition of Bcl-2 function and transcription by Tetracarcin A (TC-A) and antisense-Bcl-2 in bcl-2 overexpressing HeLa cells enhanced the response to radiation. Their results are notably different from ours. They observed essentially no effect on clonogenic survival by Tetracarcin A or antisense Bcl-2 on wild-type HeLa cells, while we found significant radiosensitivity of both wild-type LNCaP and PC3 cells. Hara et al (34) found significant radiosensitization by clonogenic assay only in bcl-2 overexpressing HeLa cells, while we found reduced clonogenic responses in bcl-2 overexpressing LNCaP-BST and PC3-BST cells. However, we did observe an increase in early apoptosis, mainly by caspases 3+7 activity, in LNCaP-BST and PC3-BST cells, which did not ultimately translate into a significant reduction in clonogenic survival. The differences between Hara et al (34) and our results may be related to downstream factors in the cell lines used.
CONCLUSIONS
Bcl-2 is a regulatory component in the cell death response of prostate cancer cells to RT. Antisense Bcl-2 resulted in a reduction in Bcl-2 protein levels and a significant reduction in clonogenic survival in p53wild-type LNCaP and p53null PC-3 cells; indicating that this effect is independent of p53. Our results have broad treatment implications since radiotherapy is an important option for men with prostate cancer and antisense-Bcl-2 is a significant radiosensitizer. Moreover, radiotherapy is often combined with androgen deprivation and, as Gleave and colleagues have demonstrated (15), AS prolongs response to androgen deprivation. Antisense-bcl-2 has the potential to substantially improve the outcome of men with intermediate-to-high risk prostate cancer treated with radiotherapy ± androgen deprivation.
Footnotes
This publication was supported in part by Grant R01CA101984-01 and Grant CA-006927 from the National Cancer Institute. The contents are solely the responsibility of the authors and do not necessarily represent the official views of the National Cancer Institute. Other support was obtained from Genta Corporation, Berkeley Heights, NJ and Varian, Palo Alto, CA
References
- 1.Pollack A, Zagars GK, Antolak JA, Kuban DA, Rosen II. Prostate biopsy status and PSA nadir level as early surrogates for treatment failure: analysis of a prostate cancer randomized radiation dose escalation trial. Int J Radiat Oncol Biol Phys. 2002;54(3):677–685. doi: 10.1016/s0360-3016(02)02977-2. [DOI] [PubMed] [Google Scholar]
- 2.Reed JC. Bcl-2 and the regulation of programmed cell death. J Cell Biol. 1994;124(1–2):1–6. doi: 10.1083/jcb.124.1.1. [DOI] [PMC free article] [PubMed] [Google Scholar]
- 3.Yang E, Korsmeyer S. Molecular thanatopsis: a discourse on the BCL2 family and cell death. Blood. 1996;88(2):386–401. [PubMed] [Google Scholar]
- 4.McDonnell TJ, Troncoso P, Brisbay SM, Logothetis C, Chung LW, Hsieh JT, Tu SM, Campbell ML. Expression of the protooncogene bcl-2 in the prostate and its association with emergence of androgen-independent prostate cancer. Cancer Res. 1992;52(24):6940–6944. [PubMed] [Google Scholar]
- 5.Furuya Y, Krajewski S, Epstein JI, Reed JC, Isaacs JT. Expression of bcl-2 and the progression of human and rodent prostatic cancers. Clin Cancer Res. 1996;2(2):389–398. [PubMed] [Google Scholar]
- 6.Apakama I, Robinson MC, Walter NM, Charlton RG, Royds JA, Fuller CE, Neal DE, Hamdy FC. bcl-2 overexpression combined with p53 protein accumulation correlates with hormone-refractory prostate cancer. Br J Cancer. 1996;74(8):1258–1262. doi: 10.1038/bjc.1996.526. [DOI] [PMC free article] [PubMed] [Google Scholar]
- 7.Stattin P, Damber JE, Karlberg L, Nordgren H, Bergh A. Bcl-2 immunoreactivity in prostate tumorigenesis in relation to prostatic intraepithelial neoplasia, grade, hormonal status, metastatic growth and survival. Urol Res. 1996;24(5):257–264. doi: 10.1007/BF00304774. [DOI] [PubMed] [Google Scholar]
- 8.Bubendorf L, Sauter G, Moch H, Jordan P, Blochlinger A, Gasser TC, Mihatsch MJ. Prognostic significance of Bcl-2 in clinically localized prostate cancer. Am J Pathol. 1996;148(5):1557–1565. [PMC free article] [PubMed] [Google Scholar]
- 9.Lipponen P, Vesalainen S. Expression of the apoptosis suppressing protein bcl-2 in prostatic adenocarcinoma is related to tumor malignancy. Prostate. 1997;32(1):9–15. doi: 10.1002/(sici)1097-0045(19970615)32:1<9::aid-pros2>3.0.co;2-i. [DOI] [PubMed] [Google Scholar]
- 10.Colombel M, Symmans F, Gil S, O’Toole KM, Chopin D, Benson M, Olsson CA, Korsmeyer S, Buttyan R. Detection of the apoptosis-suppressing oncoprotein bcl-2 in hormone-refractory human prostate cancers. Am J Pathol. 1993;143(2):390–400. [PMC free article] [PubMed] [Google Scholar]
- 11.Raffo AJ, Perlman H, Chen MW, Day ML, Streitman JS, Buttyan R. Overexpression of bcl-2 protects prostate cancer cells from apoptosis in vitro and confers resistance to androgen depletion in vivo. Cancer Res. 1995;55(19):4438–4445. [PubMed] [Google Scholar]
- 12.Scherr DS, Vaughan ED, Jr, Wei J, Chung M, Felsen D, Allbright R, Knudsen BS. BCL-2 and p53 expression in clinically localized prostate cancer predicts response to external beam radiotherapy. J Urol 1999. 162(1):12–16. doi: 10.1097/00005392-199907000-00003. discussion 16–17. [DOI] [PubMed] [Google Scholar]
- 13.Pollack A, Cowen D, Troncoso P, Zagars GK, Von Eschenbach AC, Meistrich ML, McDonnell T. Molecular markers of outcome after radiotherapy in patients with prostate carcinoma. Cancer. 2003;97(7):1630–1638. doi: 10.1002/cncr.11230. [DOI] [PubMed] [Google Scholar]
- 14.Miyake H, Tolcher A, Gleave ME. Antisense Bcl-2 oligodeoxynucleotides inhibit progression to androgen-independence after castration in the Shionogi tumor model. Cancer Res. 1999;59(16):4030–4034. [PubMed] [Google Scholar]
- 15.Gleave ME, Miayake H, Goldie J, Nelson C, Tolcher A. Targeting bcl-2 gene to delay androgen-independent progression and enhance chemosensitivity in prostate cancer using antisense bcl-2 oligodeoxynucleotides. Urol. 1999;54(6A Suppl):36–46. doi: 10.1016/s0090-4295(99)00453-7. [DOI] [PubMed] [Google Scholar]
- 16.Miyake H, Monia BP, Gleave ME. Inhibition of progression to androgen-independence by combined adjuvant treatment with antisense BCL-XL and antisense Bcl-2 oligonucleotides plus taxol after castration in the Shionogi tumor model. Int J Cancer. 2000;86(6):855–862. doi: 10.1002/(sici)1097-0215(20000615)86:6<855::aid-ijc15>3.0.co;2-8. [DOI] [PubMed] [Google Scholar]
- 17.Miayake H, Tolcher A, Gleave ME. Chemosensitization and delayed androgen-independent recurrence of prostate cancer with the use of antisense Bcl-2 oligodeoxynucleotides. J Natl Cancer Inst. 2000;92(1):34–41. doi: 10.1093/jnci/92.1.34. [DOI] [PubMed] [Google Scholar]
- 18.Leung S, Miyake H, Zellweger T, Tolcher A, Gleave ME. Synergistic chemosensitization and inhibition of progression to androgen independence by antisense Bcl-2 oligodeoxynucleotide and paclitaxel in the LNCaP prostate tumor model. Int J Cancer. 2001;91(6):846–850. doi: 10.1002/1097-0215(200002)9999:9999<::aid-ijc1131>3.0.co;2-y. [DOI] [PubMed] [Google Scholar]
- 19.Tolcher AW. Preliminary phase I results of G3139 (bcl-2 antisense oligonucleotide) therapy in combination with docetaxel in hormone-refractory prostate cancer. Semin Oncol. 2001;28(4 Suppl 15):67–70. doi: 10.1016/s0093-7754(01)90158-7. [DOI] [PubMed] [Google Scholar]
- 20.Kikuchi E, Nakashima J, Horiguchi Y, Oya M, Ohigashi T, Murai M. Enhancement of diethylstilbestrol induced cytotoxicity by bcl-2 antisense oligodeoxynucleotides and a glutathione depletor for prostate cancer. J Urol. 2003;169(2):730–734. doi: 10.1097/01.ju.0000037786.60544.9e. [DOI] [PubMed] [Google Scholar]
- 21.Mu Z, Hachem P, Agrawal S, Pollack A. Antisense MDM2 sensitizes prostate cancer cells to androgen deprivation, radiation, and the combination. Int J Radiat Oncol Biol Phys. 2004;58(2):336–343. doi: 10.1016/j.ijrobp.2003.09.029. [DOI] [PubMed] [Google Scholar]
- 22.Mu Z, Hachem P, Agrawal S, Pollack A. Antisense MDM2 oligonucleotides restore the apoptotic response of prostate cancer cells to androgen deprivation. Prostate. 2004;60(3):187–196. doi: 10.1002/pros.20044. [DOI] [PubMed] [Google Scholar]
- 23.Mackey TJ, Borkowski A, Amin P, Jacobs SC, Kyprianou N. bcl-2/bax ratio as a predictive marker for therapeutic response to radiotherapy in patients with prostate cancer. Urol. 1998;52(6):1085–1090. doi: 10.1016/s0090-4295(98)00360-4. [DOI] [PubMed] [Google Scholar]
- 24.Szostak MJ, Kaur P, Amin P, Jacobs SC, Kyprianou N. Apoptosis and bcl-2 expression in prostate cancer: significance in clinical outcome after brachytherapy. J Urol. 2001;165(6 Pt 1):2126–2130. doi: 10.1097/00005392-200106000-00082. [DOI] [PubMed] [Google Scholar]
- 25.Rosser CJ, Reyes AO, Vakar-Lopez F, Levy LB, Kuban DA, Hoover DC, Lee AK, Pisters LL. Bcl-2 is significantly overexpressed in localized radio-recurrent prostate carcinoma, compared with localized radio-naive prostate carcinoma. Int J Radiat Oncol Biol Phys. 2003;56(1):1–6. doi: 10.1016/s0360-3016(02)04468-1. [DOI] [PubMed] [Google Scholar]
- 26.Chen M, Quintans J, Fuks Z, Thompson C, Kufe D, Weichselbaum RR. Suppression of Bcl-2 messenger RNA production may mediate apoptosis after ionizing radiation, tumor necrosis factor alpha, and ceramide. Cancer Res. 1995;55( 5):991–994. [PubMed] [Google Scholar]
- 27.Zhan Q, Kontny U, Iglesias M, Alamo I, Jr, Yu K, Hollander MC, Woodworth CD, Fornace AJ., Jr Inhibitory effect of Bcl-2 on p53-mediated transactivation following genotoxic stress. Oncogene. 1999;18(2):297–304. doi: 10.1038/sj.onc.1202310. [DOI] [PubMed] [Google Scholar]
- 28.Beham A, Marin MC, Fernandez A, Herrmann J, Brisbay S, Tari AM, Lopez-Berestein G, Lozano G, Sarkiss M, McDonnell TJ. Bcl-2 inhibits p53 nuclear import following DNA damage. Oncogene. 1997;15(23):2767–2772. doi: 10.1038/sj.onc.1201464. [DOI] [PubMed] [Google Scholar]
- 29.Kariya S, Ogawa Y, Yoshida S, Yabuki M, Imajo Y, Utsumi K. X-irradiation enhances the expression of Bcl-2 in HL-60 cells: the resulting effects on apoptosis and radiosensitivity. Int J Mol Med. 1999;3(2):145–152. doi: 10.3892/ijmm.3.2.145. [DOI] [PubMed] [Google Scholar]
- 30.Zhang Z, Wang H, Prasad G, Li M, Yu D, Bonner JA, Agrawal S, Zhang R. Radiosensitization by Antisense Anti-MDM2 Mixed-Backbone Oligonucleotide in in Vitro and in Vivo Human Cancer Models. Clin Cancer Res. 2004;10(4):1263–1273. doi: 10.1158/1078-0432.ccr-0245-03. [DOI] [PubMed] [Google Scholar]
- 31.Kyprianou N, King ED, Bradbury D, Rhee JG. bcl-2 over-expression delays radiation-induced apoptosis without affecting the clonogenic survival of human prostate cancer cells. Int J Cancer. 1997;70(3):341–348. doi: 10.1002/(sici)1097-0215(19970127)70:3<341::aid-ijc16>3.0.co;2-i. [DOI] [PubMed] [Google Scholar]
- 32.Beham AW, Sarkiss M, Brisbay S, Tu SM, von Eschenbach AC, McDonnell TJ. Molecular correlates of bcl-2-enhanced growth following androgen-ablation in prostate carcinoma cells in vivo. Int J Mol Med. 1998;1(6):953–959. doi: 10.3892/ijmm.1.6.953. [DOI] [PubMed] [Google Scholar]
- 33.Coffey RN, Watson RW, Hegarty PK, Watson CL, Wolohan L, Brady HR, O’Keane C, Fitzpatrick JM. Priming prostate carcinoma cells for increased apoptosis is associated with up-regulation of the caspases. Cancer. 2001;92(9):2297–2308. doi: 10.1002/1097-0142(20011101)92:9<2297::aid-cncr1576>3.0.co;2-b. [DOI] [PubMed] [Google Scholar]
- 34.Hara T, Omura-Minamisawa M, Chao C, Nakagami Y, Ito M, Inoue T. Bcl-2 inhibitors potentiate the cytotoxic effects of radiation in Bcl-2 overexpressing radioresistant tumor cells. Int J Radiat Oncol Biol Phys. 2005;61(2):517–528. doi: 10.1016/j.ijrobp.2004.10.008. [DOI] [PubMed] [Google Scholar]
- 35.Miyake H, Hara I, Kamidono S, Gleave ME. Novel therapeutic strategy for advanced prostate cancer using antisense oligodeoxynucleotides targeting anti-apoptotic genes upregulated after androgen withdrawal to delay androgen-independent progression and enhance chemosensitivity. Int J Urol. 2001;8(7):337–349. doi: 10.1046/j.1442-2042.2001.00311.x. [DOI] [PubMed] [Google Scholar]
- 36.Raffo A, Lai JC, Stein CA, Miller P, Scaringe S, Khvorova A, Benimetskaya L. Antisense RNA down-regulation of bcl-2 expression in DU145 prostate cancer cells does not diminish the cytostatic effects of G3139 (Oblimersen) Clin Cancer Res. 2004;10(9):3195–3206. doi: 10.1158/1078-0432.ccr-03-0287. [DOI] [PubMed] [Google Scholar]
- 37.Chi KC, Wallis AE, Lee CH, De Menezes DL, Sartor J, Dragowska WH, Mayer LD. Effects of Bcl-2 modulation with G3139 antisense oligonucleotide on human breast cancer cells are independent of inherent Bcl-2 protein expression. Breast Cancer Res Treat. 2000;63(3):199–212. doi: 10.1023/a:1017371013487. [DOI] [PubMed] [Google Scholar]
- 38.Lopes de Menezes DE, Hudon N, McIntosh N, Mayer LD. Molecular and Pharmacokinetic Properties Associated with the Therapeutics of Bcl-2 Antisense Oligonucleotide G3139 Combined with Free and Liposomal Doxorubicin. Clin Cancer Res. 2000;6(7):2891–2902. [PubMed] [Google Scholar]