

Abstract
OBJECTIVES
Cytokines and growth factors play a major role in the dysregulated immune response in inflammatory bowel disease (IBD). We hypothesized that significant differences exist between the serum cytokine and growth factor profiles of pediatric IBD patients with active disease (AD) and those in remission, and that levels of some of these soluble mediators may be used to define regulators in IBD and determine disease activity.
METHODS
Eighty-eight, consecutive patients with confirmed Crohn’s disease (CD) and ulcerative colitis (UC) seen at the Duke Children’s Hospital were prospectively enrolled and a serum sample was obtained. Data were recorded at the time of serum collection to calculate disease activity indices. The relative expression of 78 cytokines, growth factors, and soluble receptors was determined using proprietary antibody-based protein microarrays amplified by rolling circle amplification. SPSS 8 (SPSS Inc., Chicago, IL) was used to compare protein profiles for CD and UC patients in clinical remission (CR) versus AD.
RESULTS
Sixty-five CD patients and 23 UC patients were enrolled. Forty-one CD patients had available samples and PCDAI results. Twenty-two patients were in remission PCDAI ≤ 12.5 (median 5), 19 patients had disease activity >15 (median 30). Univariate analysis revealed that PLGF, IL-7, IL-12p40, and TGF-β1 cytokine levels were significantly elevated for patients in CR versus AD (p < 0.01). Twelve UC serum samples had Seo/Truelove Witt AI for analysis. Five patients were in remission by TW AI and Seo AI ≤ 110 and 7 patients had active mild-to-severe disease by TW and Seo AI >110. Only one cytokine, IL12p40, showed significance between CR versus AD (p < 0.02).
CONCLUSIONS
Surprisingly, we found no differences in circulating levels of proinflammatory cytokines but found that pediatric IBD patients in remission compared to those with AD had higher levels of specific circulating cytokines, including the regulatory cytokines IL-12p40, and TGF-β1. It may be that these cytokines directly regulate intestinal inflammation in IBD or reflect the activity of T regulatory cells in negatively regulating the inflammatory response. Further studies will be needed to validate our results to define the molecular pathways involved in the intestinal immune response in man.
INTRODUCTION
Inflammatory bowel disease (IBD) is a chronic intestinal in-flammatory disease. The underlying mechanisms for the development and continuation of this disease are poorly understood. A multifactorial etiology for the pathogenesis of IBD has been suggested and for some patients there is a genetic predisposition that leads to an unregulated intestinal immune response to an environmental, dietary, or infectious agent. Cytokines generated by the cellular and humoral immune responses play a major role in the regulation of the intestinal immune system. Other intestinal molecular messengers involved in this process include growth factors, prostaglandins, leukotrienes, and oxygen-free radicals (1). Cytokines are released by immune cells and affect cellular activity, differentiation, and proliferation via autocrine, paracrine, and endocrine actions (1, 2). These proteins are able to induce inflammation but are also equally important in suppressing inflammation and mediating repair and healing (1, 2). It has been suggested that cytokines may mediate disordered inflammatory events in IBD (3). There is great interest in the role of cytokines released by activated immune cells in IBD. However, the identities of cytokines and growth factors that regulate Crohn’s disease (CD) and ulcerative colitis (UC) are still not clearly defined. Present understanding of the role cytokines play in IBD extends primarily from mouse models and more recently is based on adult human studies. There are only a few published pediatric studies addressing this issue (4, 5).
We hypothesized that significant differences exist between the serum cytokine and growth factor profiles of pediatric IBD patients with active disease (AD) and those in remission, and that levels of some of these soluble mediators may be used to define regulators in IBD and to determine disease activity.
MATERIALS AND METHODS
Patients
All patients with documented IBD (CD or UC) diagnosed and verified by clinical, radiological, endoscopic, and histological criteria followed in the Division of Pediatric Gastroenterology and Nutrition in the Department of Pediatrics at the Duke Children’s Hospital were eligible for this study. There were approximately 140 patients with IBD treated by the Division of Pediatric Gastroenterology and Nutrition. Consecutive patients from November 1, 1999 to October 31, 2001 were prospectively enrolled after obtaining informed consent/assent. A serum sample was obtained from the patient and data were collected regarding the patient’s clinical history, current physical examination and results of a complete blood count, erythrocyte sedimentation rate, and albumin. Where available, the patient’s disease activity index, Pediatric Crohn’s Disease Activity Index, or Seo ulcerative colitis Activity Index/TrueLove & Witt Activity Index were determined at the time of serum collection (6–8). If not all the data results were obtainable, the patients’ samples were excluded from the analysis. Reasons that excluded some of the patients’ samples from the analysis included difficulties in obtaining the necessary blood samples from pediatric patients, technical problems with collecting the CBC, ESR, and albumin samples such as specimens clotting, if not all the pertinent data were recorded despite the study design and forms used to try and capture all of this information or there was a sample processing issue. The study was approved by the Duke University Institutional Review Board.
Samples
Following informed consent, one 3–5-cc blood Clotting Tube was collected at the time of other routine laboratory studies performed for follow-up management of the patient’s IBD. The serum was isolated from the Clotting Tube and frozen at −80°C until processed. Forty-one CD patient samples (22 from patients in clinical remission (CR) and 19 from patients with active CD) and 20 UC patient samples (5 in CR, 7 with AD, and 8 with unknown disease activity) were used. The levels of 78 different cytokines and growth factors were determined in the serum samples using an antibody microarray and the serum cytokine profiles of IBD patients were analyzed. The 78 cytokines and growth factors are as follows: Angiogenin (ANG), Amphiregulin (AR), Brain-derived neurotrophic factor (BDNF), B-lymphocyte chemoattractant (BLC [CXCL13]), Ciliary neurotrophic factor (CNTF), Epidermal growth factor (EGF), Epithelial cell-derived neutrophil-activating peptide (ENA-78 [CXCL5]), Eotaxin (Eot [CCL11]), Eotaxin-2 (Eot-2 [CCL24]), Fas (TNFRSF6), Fas (CD95), Fibroblast growth factor-6 (FGF-6), Fibroblast growth factor-7 (FGF-7), Fibroblast growth factor-9 (FGF-9), fms-like tyrosine kinase-3 ligand (Flt-3 Lig), Granulocyte colony stimulating factor (G-CSF), Glial cell-line-derived neurotrophic factor (GDNF), Granulocyte macrophage colony stimulating factor (GM-CSF), Hemofiltrate CC chemokine 4 (HCC4 [CCL16]), I-309 (CCL1), Inter-feron alpha (IFN-a), Interferon gamma (IFN-g), Interleukin 1 alpha (IL-1a [IL-1F1]), Interleukin 1 beta (IL-1b [IL-1F2]), Interleukin 1 receptor antagonist (IL-1ra [IL-1F3]), Inter-leukin 1 soluble receptor I (IL-1 sR1), Interleukin 2 (IL-2), Interleukin 2 soluble receptor alpha (IL-2 sRa), Interleukin 3 (IL-3), Interleukin 4 (IL-4), Interleukin 5 (IL-5), Interleukin 6 (IL-6), Interleukin 6 soluble receptor (IL-6 sR), Interleukin 7 (IL-7), Interleukin 8 (IL-8 [CXCL8]), Interleukin 10 (IL-10), Interleukin 11 (IL-11), Interleukin 12 p40 (IL-12 [p40]), Interleukin 12 p70 (IL-12 [p70]), Interleukin 13 (IL-13), In-terleukin 15 (IL-15), Interleukin 16 (IL-16), Interleukin 17 (IL-17), Interleukin 18 (IL-18), Interferon gamma inducible protein 10 (IP-10 [CXCL10]), Leukemia inhibitory factor (LIF), Monocyte chemotactic protein 1 (MCP-1 [CCL2]), Monocyte chemotactic protein 2 (MCP-2 [CCL8]), Monocyte chemotactic protein 3 (MCP-3 [CCL7]), Macrophage colony stimulating factor (M-CSF), Macrophage-derived chemokine (MDC [CCL22]), Macrophage migration inhibitory factor (MIF), Monokine induced by interferon gamma (MIG [CXCL9]), Macrophage inflammatory protein 1 alpha (MIP-1a [CCL3]), Macrophage inflammatory protein 1 beta (MIP-1b [CCL4]), Macrophage inflamma-tory protein 1 delta (MIP-1d [CCL15]), Myeloid progenitor inhibitory factor 1 (MPIF-1 [CCL23]), Macrophage stimulating protein (MSP), Neutrophil Activating Peptide 2 (NAP-2 [CXCL7]), Neurotrophin 3 (NT-3), Neurotrophin 4 (NT-4), Oncostatin M (OSM), Pulmonary and activation-regulated chemokine (PARC [CCL18]), Placental growth factor (PLGF), Regulated upon activation, normal T expressed and presumably secreted (RANTES [CCL5]), Stem cell factor (SCF), Stromal cell-derived factor 1 alpha (SDF-1a [CXCL12]), Thymus- and activation-regulated chemokine (TARC [CCL17]), Transforming growth factor beta 1 (TGF-b1), Transforming growth factor beta 3 (TGF-b3), Tumor necrosis factor receptor I (TNF-RI), Tumor necrosis factor receptor II (TNF-RII), Tumor necrosis factor alpha (TNF-a [TNFSF2]), Tumor necrosis factor beta (TNF-b [TNFSF1]), TNF-related apoptosis-inducing ligand (TRAIL [TNFSF10]), Vascular endothelial growth factor (VEGF), Soluble CD23 (sCD23), Soluble glycopro-tein 130 (sgp130), Urokinase plasminogen activator receptor (uPAR)
Microarray Manufacture
Antibody microarrays were printed using a Packard Biosciences (Downers Grove, IL) BCA-II piezoelectric microarray dispenser on cyanosilane-coated glass slides divided by Teflon boundaries into sixteen 0.5-cm diameter circular sub-arrays (Fig. 1). Monoclonal antibodies for 78 cytokines (R&D Systems Inc., Minneapolis, MN; BD Biosciences Pharmingen, San Diego, CA; Biosource International, Camarillo, CA; Endogen/Pierce Biotechnology, Inc., Rockford, IL) were dispensed in quadruplicate at a concentration of 0.5 mg/ml. Printed slides were blocked as described (9) and stored at 4°C until use. Batches of slides were subjected to a quality control consisting of incubation with a fluorescently labeled antimouse antibody, followed by washing, scanning, and quantitation. Typically, the coefficient of variability (CV) of antibody deposition in printing was <5%.
Figure 1.
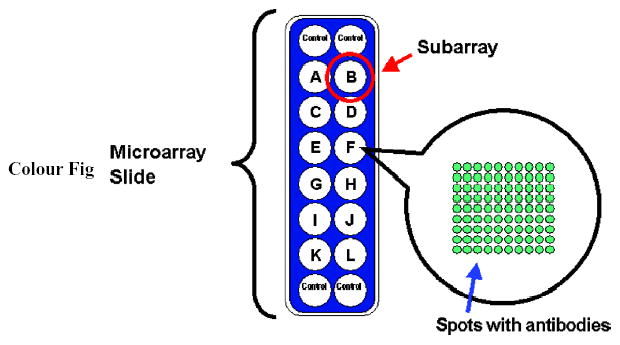
Schematic representation of a sample protein microarray slide with 16 subarrays. Subarrays refer to the 16 wells (A–L and 4 control subarrays), or circular analysis sites, on the slide. Array refers to the antibody content printed in a well. Spots with capture antibodies are deposited in each subarray. The number of spots is for illustration purpose only.
Rolling Circle Amplification (RCA) Immunoassay
The assay was performed by a liquid-handling robot (Biomek 2000, Beckman Instruments, Fullerton, CA), which was enclosed in an 80% humidified, HEPA-filtered, plexiglass chamber. A 15-μl sample was applied to each subarray, and im-munoassays with RCA signal amplification were performed as described (9). Slides were scanned (GenePix, Axon Instruments Inc., Foster City, CA) at 10-μm resolution with laser setting of 100 and PMT setting of 550. Mean pixel fluorescence was quantified using the fixed circle method in GenePix Pro 3.0 (Axon Instruments, Foster City, CA). The fluorescence intensity of quadruplicate microarray features was averaged for each feature and sample, and the resulting cytokine values were determined. For every slide, a set of blanks was run and the intensity values were used to correct for background signal.
Data Quality Control
Samples were excluded from statistical analysis if fluorescent intensities were generally weak (indicating sample degradation), if there were visible defects in the array (such as scratches), or if there was high background signal. Analyses were performed using complete set of data containing the levels of all 78 cytokines from 41 CD patient samples and 20 UC patient samples. Untransformed fluorescent intensities were used as data values in all of the analyses.
Statistical Analysis
In order to determine the cytokines that contribute the most to discrimination between classes, a stepwise method of linear discriminant analysis (LDA) from SPSS 8.0 (SPSS Inc., Chicago, IL) for Windows was used with the following settings: Wilks’ lambda (Λ) method was used to select cytokines that maximize the cluster separation and cytokine entrance into the model was controlled by its F-value. A large F-value indicates that the level of the particular cytokine is different between the two groups, and a small F-value (F < 1) indicates that there is no difference. In this method, the null hypothesis is rejected for small values of Λ. Thus, the aim was to minimize Λ. LDA was used to distinguish between two patient groups based on the levels of multiple cytokines simultaneously. The goal of LDA was to build a classification model and use it in cross-validation analysis. The absolute magnitude of the canonical function values (CFVs) represents the contribution or the weight of that cytokine in the model. A large CFV represents a large contribution of a given cytokine to classifications, and a small CFV represents a small contribution. To construct a list of cytokine predictors, the F-values were first calculated for each of the 78 cytokines. Cytokines with F-values <1 were rejected. Then the value of Λ was determined for the cytokine with the largest F-value (the cytokine that differs the most between the two groups). The cytokine with the next largest F-value was then added to the list and Λ recalculated. If the addition of the second cytokine lowered the value of Λ, it was kept in the list of cytokine predictors. The process of adding cytokines one at a time was repeated until the reduction of Λ no longer occurred. Cross-validation, a method for testing the robustness of a prediction model, was then carried out. To cross-validate a prediction model, one sample was removed and set aside, the remaining samples were used to build a prediction model based on the preselected cytokine predictors, and it was determined whether the new model is able to predict the one sample not used in building the new model correctly. This process was repeated for all samples one at a time, and a cumulative cross-validation rate was calculated. The final list of cytokine predictors was determined by manually entering and removing cytokines to maximize the cross-validation rate, using information obtained from the univariate analyses and cross-validations. The final cytokine classifier was then defined as the set of cytokine predictors that resulted in the highest cross-validation rate.
Univariate analysis of individual cytokine levels was performed by using the Kruskal-Wallis test (analysis of variance by rank). The level of significance was set at a ≤ 0.01.
RESULTS
Sixty-five CD patients and 23 UC patients were enrolled. Forty-one CD patients had available samples and PCDAI results to analyze. The demographic data for these CD patients are shown in Table 1. The mean CD patient age was 13.3 ± 3.7 yr (range 3–20 yr). Twenty-two CD patients were in remission (PCDAI ≤ 12.5, median = 5), 11 patients had mild disease activity (PCDAI 15–30, median = 20), and 8 patients had moderate-to-severe activity (PCDAI ≥ 31, median = 43.75), as shown in Table 2 (for analysis, the “mild” and the “moderate to severe” activity patients were grouped together in “active disease” group; n = 19, PCDAI median = 30). There were no significant differences found between the groups with AD and remission groups in age distribution at the time of study ( p = 0.4439), disease duration in months ( p = 0.1881), or in medications (6-MP, AZA, MTX, p = 0.3522; infliximab, p = 0.5883; 5-ASA, p = 0.6847; and prednisone, p = 0.752). Given the study design, there were not enough patients enrolled to provide any statistically meaningful information regarding potential racial differences. Tables 3 and 4 depict the demographics of the 35 excluded patients/analytes and show no statistical difference in comparison to the characteristics of those patients included in the study except for the difference in disease duration in the cohort of CD patients ( p = 0.02). The majority of these were excluded because there was (i) no activity indices able to be derived so those cannot be reported (n = 8 CD, 11 UC); (ii) despite enrollment a serum sample was never collected from the consenting patient (n = 5 CD, 3 UC), or (iii) there was a sample processing issue (n = 13 CD, 0 UC); so unfortunately, no speculation about how this difference may or may not affect the study’s results can be made.
Table 1.
Demographic Data of Patients Used
| Crohn’s Disease (n = 41) | Ulcerative Colitis (n = 12) | |
|---|---|---|
| Age (yr) | 13.3 ± 3.7 (range 3–20) | 13.6 ± 4 (range 2–18) |
| Male/female | 26/15 | 6/6 |
| Race | 32 White, 9 Black | 9 White, 2 Black, 1 Hispanic |
| Disease duration (months) | 17 ± 26 | 22 ± 26 |
| Disease type | ||
| Inflammatory | 33 | 11 |
| Stricturing | 5 | 1 |
| Penetrating/fistula | 3 | N/A |
| Disease location | ||
| Small bowel | 9 | N/A |
| TI/Colon | 25 | N/A |
| Colon | 7 | 10 pancolonic/2 left sided |
| Perianal | 5 | |
Table 2.
Disease Activity Index of Patients Used
| No. of Patients | Median AI Score | |
|---|---|---|
| PCDAI | ||
| Remission (=12.5) | 22 | 5 |
| Mild (15 – 30) | 11 | 20 |
| Moderate-to-severe (=31) | 8 | 43.75 |
| TW | ||
| Remission | 5 | N/A |
| Active | 7 | N/A |
| SEO | ||
| Remission (=110) | 5 | 94.6 |
| Active | 7 | 187.1 |
| Mild (111–<150) | n = 2 | |
| Moderate(150–<220) | n = 3 | |
| Severe (>220) | n = 2 | |
Table 3.
Demographic Data of Patients Excluded
| Crohn’s Disease (n = 24) | Ulcerative Colitis (n = 11) | |
|---|---|---|
| Age (yr) | 13.6 ± 4.4 (range 5–21) | 15.5 ± 3.5 (range 10–21) |
| Male/female | 13/11 | 6/6 |
| Race | 20 White, 4 Black | 8 White, 2 Black, 1 Hispanic |
| Disease duration (months) | 42 ± 46 | 34 ± 51 |
| Disease type | ||
| Inflammatory | 16 | 11 |
| Stricturing | 4 | 0 |
| Penetrating/fistula | 4 | N/A |
| Disease location | ||
| Small bowel | 2 | N/A |
| TI/Colon | 12 | N/A |
| Colon | 10 | 10 pancolonic/1 left sided |
| Perianal | 2 | |
Table 4.
Disease Activity Index of Patients Excluded
| No. of Patients (n = 24 CD), (n = 11 UC) | Median AI Score | |
|---|---|---|
| PCDAI | ||
| Remission (≤12.5) | 12 | 5 |
| Mild (15 – 30) | 2 | 17.5 |
| Moderate-to-severe (≥31) | 2 | 53.75 |
| TW* | ||
| Remission | N/A | N/A |
| Active | N/A | N/A |
| SEO* | ||
| Remission (≤110) | N/A | N/A |
| Active | N/A | N/A |
| Mild (111–<150) | N/A | |
| Moderate (150–<220) | N/A | |
| Severe (>220) | N/A | |
There were no activity indices able to be derived due to lack of data for these UC patients.
The Kruskal-Wallis test was initially used to compare CD patients in CR versus CD patients with AD. Four cytokines, PLGF, IL-7, IL-12p40, and TGF-β1, showed significant differences in their levels (Table 5). One of them, placenta growth factor (PLGF), was identified also by linear discriminant analysis to be significantly different between the two groups, showing one of the highest CFV (Table 6). Due to the importance of using replicates of the samples for microarray studies in the design of this study and because the four significant replicates from each sample were pooled by calculating the average intensity, Table 7 is provided here to represent the display of variability among these replicates.
Table 5.
Comparison of Cytokine Levels (Intensity Units) in Serum Samples from CD Patients (Clinical Remission) versus CD Patients (Active Disease), and Corresponding p-Values Based on Kruskal-Wallis Test
| CD Remission (n = 22)
|
CD Active (n = 19)
|
||||||
|---|---|---|---|---|---|---|---|
| Analyte | Median | 25th percentile | 75th percentile | Median | 25th percentile | 75th percentile | p-Values 1,140 |
| PLGF | 480 | 399 | 728 | 317 | 121 | 440 | 0.0034 |
| IL-7 | 1451 | 1009 | 2105 | 830 | 346 | 1239 | 0.0036 |
| IL-12P40 | 430 | 296 | 933 | 237 | 203 | 344 | 0.0048 |
| TGF-b1 | 668 | 303 | 1248 | 290 | 175 | 570 | 0.0081 |
Table 6.
Cytokine Predictors and Their Canonical Function Values for Different Classifiers
| Comparison | Classifier: Cytokine Predictor | Canonical Function Value (CFV) |
|---|---|---|
| CD patients (clinical remission) versus CD patients (active disease) | 4-cytokine classifier | |
| TRAIL | −1.44 | |
| TARC | −0.52 | |
| PLGF | 1.61 | |
| SCD23 | 0.72 | |
| 10-cytokine classifier | ||
| BDNF | 0.58 | |
| I309 | −0.56 | |
| IL17 | 0.68 | |
| MCP1 | 0.68 | |
| MPIF1 | −0.99 | |
| PLGF | 1.86 | |
| TARC | −1.03 | |
| TRAIL | −2.06 | |
| SCD23 | 1.30 | |
| UPAR | −0.41 |
TRAIL = TNF-related apoptosis-inducing ligand; TARC = Thymus- and activation-regulated chemokine; PLGF = Placental growth factor; SCD23 = Soluble CD23; BDNF = Brain-derived neurotrophic factor, I-309; IL-17 = Interleukin-17; MCP-1 = Monocyte chemotactic protein 1; MPIF-1 = Myeloid progenitor inhibitory factor 1; UPAR = Urokinase plasminogen activator receptor.
Table 7.
Coefficient of Variability Among a Sample of the Replicate Analytes
| Analyte | Coefficient of Variability (%) |
|---|---|
| BDNF | 10 |
| I309 | 20 |
| IL-17 | 12 |
| MCP-1 | 18 |
| MPIF-1 | 12 |
| PLGF | 14 |
| SCD23 | 11 |
| TARC | 13 |
| TRAIL | 14 |
| UPAR | 23 |
| IL-12P40 | 16 |
| IL07 | 16 |
| TGF-b1 | 13 |
Using LDA, multiple cytokines were selected as described in Materials and Methods section and used to build models for the CD active versus CD remission comparison using a different number of cytokines (Fig. 2). A list of the cytokines used in building the cytokine classifiers and their CFVs are shown in Table 6. A 10-cytokine classifier was built that correctly categorized 92.7% of original grouped cases and 85.4% of cross-validated grouped cases. The number of cytokines used in this classifier was within the range of maximum confidence level, as shown in Figure 3. The red line depicted in Figure 3 shows the ability of LDA to predict random samples as a function of number of predictors (cytokines) for 41 patients, a rough false positive rate. Random data prediction rate was 0% for all models with less than 13 predictors. Range of maximum confidence interval is from 1 to 13 to keep random data prediction rate at 0%. This 10-cytokine classifier was considerably more successful in correctly categorizing patients in remission than those with active CD (Table 8). Using LDA, the following 10 biomarkers that correlate with CD activity were identified: BDNF, I-309, IL-17, MCP-1, MPIF-1, PLGF, TARC, TRAIL, sCD23, UPAR.
Figure 2.
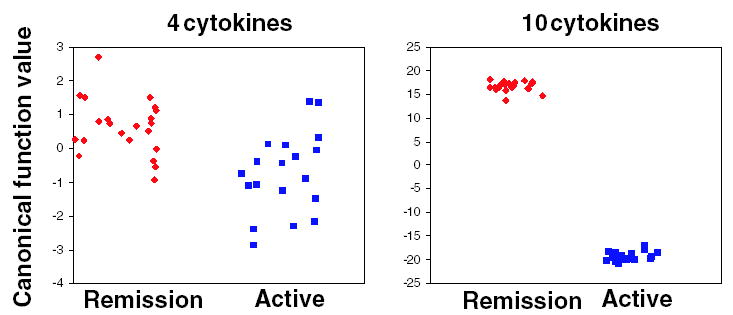
Group separation based on canonical function values obtained by linear discriminant analysis (LDA) for comparing CD patients in clinical remission versus CD patients with active disease. Each square represents one individual. Left panel, prediction model based on four cytokines (TRAIL,TARC,PLGF,SCD23). Right panel, prediction model based on 10 cytokines (BDNF, I-309, IL-17, MCP-1, MPIF-1, PLGF, TARC, TRAIL, SCD23, UPAR). Abbreviations identified in Materials and Methods section.
Figure 3.
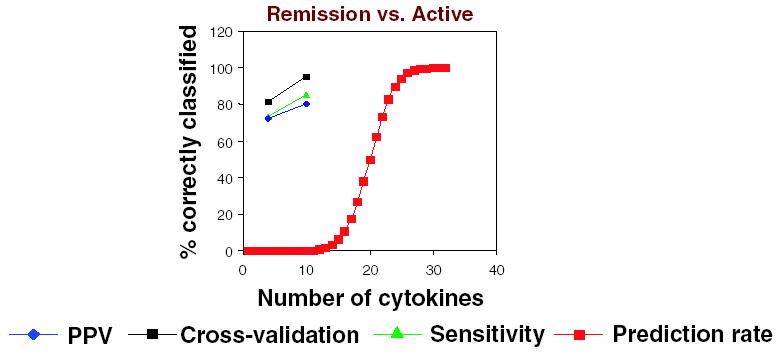
PPV, sensitivity, cross-validation rate, and prediction rate (saturation capacity) of LDA-based models of comparing CD patients in clinical remission versus CD patients with active disease. X-axis represents number of cytokines used as classifiers; Y-axis represents the percentage value of the corresponding parameter, PPV, cross-validation rate, sensitivity, or saturation capacity. The number of cytokine predictors used in building a prediction model influences the model’s correct prediction confidence level.
Table 8.
Classification Results of Linear Discriminant Analysis for Crohn’s Disease Active versus Remission*
| Original Cases
|
Cross-Validation
|
|||
|---|---|---|---|---|
| Remission | Active | Remission | Active | |
| 4-cytokine classifier | ||||
| Remission | 82 | 18 | 82 | 18 |
| Active | 32 | 68 | 37 | 63 |
| 10-cytokine classifier | ||||
| Remission | 100 | 0 | 95 | 5 |
| Active | 16 | 84 | 26 | 74 |
All numbers are in percentage.
Twelve UC serum samples with Truelove & Witt/Seo Activity Indices were available. Demographic data of these patients are also listed in Table 1, mean age was 13.6 ± 4.0 yr (range 2–18 yr). Five patients were in CR by TW and Seo AI ≤110 and 7 patients had mild-to-severe disease by TW and Seo AI >110 (Table 3). Only one cytokine, IL12p40, showed a significant difference between CR and AD (Table 9).
Table 9.
Cytokine Levels (Intensity Units) in Serum Samples from Ulcerative Colitis Patients in Clinical Remission versus Active Disease, and Corresponding p-Values Based on Kruskal-Wallis Test
| UC Remission (n = 5)
|
UC Active (n = 7)
|
||||||
|---|---|---|---|---|---|---|---|
| Analyte | Median | 25th percentile | 75th percentile | Median | 25th percentile | 75th percentile | p-Values |
| IL-12P40 | 1140 | 806 | 1570 | 293 | 51 | 715 | 0.0185 |
Many other proinflammatory cytokines known to be elevated in AD such as IL-2, IL-6, IL-10, TNF-a, etc., were also evaluated; however, the differences were not found to be significant in the statistical analysis comparing these various groups.
DISCUSSION
It has been postulated from adult IBD studies that TH1 cells mediate CD and TH2 cells are more involved in UC (1, 10–13). Regulatory T cells (so called Treg, or TH3 cells) are involved in “oral tolerance” and downregulating the immune response (14–17).
Initial studies demonstrate that specific cytokine and chemokine levels in serum, and mRNA, protein and protein receptor levels in the mucosa, may potentially prove to be unique markers for the two subgroups of IBD. In vivo mRNA and/or protein levels of IL-2 and IFN-γ (TH1) are increased in CD but not in UC (11, 12, 18–20). Similarly, increased tissue levels of IL-4 (TH2) and IL-10 mRNA have been found in UC and not in CD (21). Although serum levels of soluble IL-2 receptor and IL-6, and tissue IL-2 and IFN-γ, were increased in active CD, increased cytokine production has been documented even in “inactive” CD intestinal tissue (1, 11, 12, 22).
Current studies suggest that unique cytokine profiles occur during different clinical stages of CD (10) and different medical therapy (23, 24). For instance, increased IL-4 mRNA and decreased IFN-γ mRNA were found in early postoperative ileal lesions in CD, whereas chronic CD intestinal lesions were noted to have increased IL-2 and IFN-γ mRNA levels (10). Also, thymus-expressed chemokine (TECK) and its receptor CCR9+ are not only selectively expressed in small bowel but also their expression is significantly lower in inflamed small bowel compared to uninvolved small bowel (25). Interestingly, CCR9+ lymphocytes are found in higher abundance in patients with small bowel CD compared to patients with only colonic CD (25).
The relevance and value of serum cytokine levels in relationship to the tissue expression of these cytokines in relationship to disease have been discussed in prior reviews and through other individual published manuscripts (1, 2, 11, 12, 20, 22, 26, 27). Such studies have demonstrated correlations between increased tissue IL-2 receptors and increased serum IL-2, elevated TNF-alpha in tissue, and serum. Other studies have shown increased serum soluble IL-2 receptor and serum IL-6 levels associated with increased tissue IL-2 and IFN gamma as it relates to clinical disease activity (11, 12, 20, 22). Indeed, Louis et al. demonstrated that high serum levels of IL-6 in quiescent CD alone or with elevated serum levels of soluble TNF receptors p55 and p75 or soluble IL-2 receptor was predictive of a relapse, while Kucharzik et al. showed that serum IL-10 level was significantly associated with disease activity in both CD and UC (28, 29). However, not all cytokines expressed in the tissue of patients with IBD are detectable in serum, for example, IL-1 and IL-8. Most of the cytokine research and evaluation in IBD are being performed at the tissue level, where the disease is occurring and typically by polymerase chain reaction amplification of mRNA transcripts, but such studies as those above and ours demonstrate that serum analysis is also relevant. In fact, being able to identify and create a model of those cytokines that are detectable in serum and how they may correlate to disease activity would be of significant clinical importance in the management of IBD. Noninvasive measures to perhaps more accurately assess disease activity at the immunological/inflammatory level than that presently available by current rudimentary evaluation with nonspecific factors such as ESR, HCT, and albumin would not only be easier than their bowel resection counterparts or PCR studies on mucosal biopsies but would also permit a noninvasive means to assess the disease activity state.
Surprisingly, in the present study we did not find decreases in proinflammatory cytokines with decreasing severity of the disease. Instead, we found that specific cytokines, PLGF, IL-7, IL-12p40, and TGF-β1 in CD and IL-12p70 in UC, were increased during remission. The potential activities of all these cytokines can be surmised, except for PLGF.
We will speculate on the potential activities only on the analytes found to be statistically significant by univariate analysis using the Kruskal-Wallis test since analytes utilized by modeling algorithms are often not significantly different when evaluated individually. Regarding this issue, Tables 5 and 9 are the result of statistical analysis using the univariate Kruskal-Wallis test, while Table 6 is the result of statistical analysis using multivariate analysis, which evaluates the significance in the difference in means in “multidimensional space” formed by the analytes in Table 6. Analytes from Table 6 do have differences in their fluorescence intensities but these differences were not found to be statistically significant by the Kruskal-Wallis test when compared individually and therefore were not included in Tables 5 and 9. Both statistical approaches are applicable in this study and all of the analytes found to be significant could be potentially relevant. Consequently, it is possible and very likely that the analytes TRAIL, TARC, SCD23, I309, and MPIF1 as well as BDNF, IL-17, MCP-1, PLGF, and UPAR, as shown in the prediction model (Fig. 2) are related to disease pathogenesis, but their relationship is likely complex, and would be difficult to explain without extensive experimentation that is beyond the scope of this manuscript.
TGF-β1 (transforming growth factor) is an “antiinflammatory” growth factor that counteracts IL-1 and TNF-α modulates processes such as homing, cellular adhesion, chemotaxis, and regulates T-cell homeostasis (30–33). It promotes maturation of intestinal epithelial cells, collagen production, and healing in wounds and ulcers. It has inhibitory properties on cytotoxicity and its proliferative responses interfere with the IL-12 pathway by inhibiting IFN-γproduction, the early signal transduction events of the IL-12/IL-12 receptor complex, and the phosphorylation of the STAT4 transcription factor (34). TGF-β1 expression in both CD and UC has been shown to depend on the presence and location of the inflammation rather than on the type of IBD (35, 36). Most importantly, TGF-β1 is thought to convert T cells into regulatory (Treg) cells and to perpetuate the antiinflammatory effects of these cells (37). Thus, increased TGF-β1 during remission of CD is plausible.
IL-7 has a crucial role in the organization of mucosal lymphoid tissue, acting on both B and T cells, and in the regulation of a normal T-cell immune response (38–43). It also promotes homeostatic proliferation of memory CD8 cells (44) by inhibiting pre-T-cell differentiation specifically at the point of conversion of T-cell receptor αβ development, thereby, selectively promoting memory CD8 cell differentiation (45). Early studies suggested that IL-7 may act synergistically with IL-12 to stimulate TNF-α and a TH1 response but recent studies suggest it actually promotes a TH2 response with increased IL-10 and MCP-1, while decreasing TH1 cytokines, for example, IL-2, IFN-γ, and RANTES (46–48). Furthermore, IL-7 inhibits Treg suppression of TH1 cells while having no effect on the suppression of TH2 cells (37). The elevation of IL-7 in CD patients in remission is thus plausible.
IL-12 is a disulfite-linked heterodimer (IL-12p70) composed of a heavy chain, p40, and a light chain, p35, produced by phagocytic and antigen presenting cells. IL-12p40 is a cytokine with immunoregulatory, antitumor, and antimetastatic properties favoring a TH1 pattern and inhibiting a TH2 response (49–55). In the present study there was a significant elevation of IL-12p40, but not IL-12p70 in CD and UC patients in remission. Levels of p40 and the p70 heterodimer are not necessarily linked. The amount of the p40 subunit may in some cases be present far in excess of the heterodimer. IL-12p70 heterodimer is a key player in the TH1 inflammatory pathway but the p40 subunit alone has very different activities as compared to the IL-12p70 heterodimer. As a result, the IL-12p70 and IL-12p40 represent two different analytes and two distinct responses. A recent report studying sepsis patients suggests that an over expression of IL-12p40 regulatory subunit may be part of a pathway that controls inflammation (56). In support of this idea, it is known that IL-12p40 can form homodimers that antagonize the activity of the IL-12p70 heterodimer (57). The fact that the p40 subunit is known to antagonize the activity of the IL-12 heterodimer provides a potential mechanism for inhibition of the chronic IL-12-dependent inflammatory response and improvement of symptoms. This is consistent with the hypothesis that IL-12p40 participates in the pathway that suppresses disease activity.
Placenta-derived growth factor (PLGF) and vascular endothelial growth factor (VEGF) represent two closely related angiogenic growth factors active as homodimers or heterodimers (58). PLGF strongly potentiates both the proliferative and the permeabilization effects exerted by VEGF on the vascular endothelium (58). The serum levels of VEGF have been found to be increased and to correlate with disease activity in patients with IBD, indicating a role for this cytokine in modulating inflammation in these chronic inflammatory diseases. The mechanism of action may be through increasing the vascular permeability and/or wound healing via its proangiogenic effects (4). Interestingly, monocytes express the VEGF receptor Flt-1, which specifically binds the VEGF homolog PLGF also. Both VEGF and PLGF stimulate tissue factor production and chemotaxis in monocytes at equivalent doses. It has been suggested that Flt-1 is a functional receptor for VEGF and PLGF in monocytes and endothelial cells, and a mediator of monocyte recruitment and procoagulant activity (59). At this time, it is unclear why PLGF may be increased during the remissive phase of CD. It is possible that increased PLGF may promote wound healing by its proangiogenic effects.
Speculation as to the importance of these serum cytokines and growth factors in CD and UC remission states may relate to the antiinflammatory and wound-healing properties of these immune regulatory proteins. Increased PLGF may promote wound healing by its proangiogenic effects. Increased IL-7 is important in regulating the normal immune response in intestinal mucosa and decreasing the TH1 activity. TGF-β1 may also dampen T-cell immune reactivity and the associated inflammatory response by downregulating IL-1 and TNF-α and by interfering with the IL-12/TH1 response. TGF-β1 can also promote wound/ulcer healing and the maturation of replacement intestinal epithelial cells, and may assist in the body’s “tolerance” to a repetitively encountered antigen associated with the patient’s IBD. In fact, Neurath et al. have demonstrated in 2,4,6-trinitrobenzene sulfonic acid (TNBS) models of TH1 chronic colitis pretreated with haptenated colonic proteins as oral tolerance, that the effective suppression of this inducible colitis is directly associated with the production of TGF-β from mucosal T cells (60). Increased serum IL-12p40 in this setting may appear to be paradoxical but the antagonistic effects of IL-12p40 homodimer toward the IL-12p70 heterodimer could explain this finding and may represent a potential mechanism for the changes in disease activity. IL-12p40 may also reflect the primary TH1 response exhibited by patients with CD and may assist in cell trafficking. Finally, given the balance of inflammatory and antiinflammatory mediators at work in IBD, increased serum levels of TGF-β1 may reflect the body’s immune response to maintain CR.
Our study demonstrated a large standard deviation regarding the results of the analytes. Nevertheless, the p-values in this context are still relevant and very much valid as it incorporates the standard deviation of the groups. The standard deviations identified should be considered in context of the difference in means between the groups. Effect size is the difference in-group means divided by a standard deviation. For example, effect size of PLGF (Table 5) would be 0.92. This would then translate into the fact that 82% of cases in the CD active group will be below average compared to the CD remission group. Unfortunately, we cannot make large claims as to the relevance of our findings to clinical diagnostics. As this study is an initial one, our findings will need to be validated.
We have used univariate and linear determinant analyses to define potential biomarkers and algorithms to predict disease activity in IBD. While these algorithms are not yet validated, they do provide a basis from which to build possible classifiers for disease activity in IBD.
WHAT IS ACCEPTED AND WHAT THIS RESEARCH ADDS
Additional Pediatric cytokine/growth factor data in IBD for which there is minimal to scant published information.
Correlation of serum cytokine/growth factors with disease activity
Correlation of serum cytokine/growth factors with IBD disease type
Ability to use a noninvasive means to assess disease characteristics and activity with limited blood volume compared to standard large volume samples typically required for ELISA making such use practical in the pediatric population
Acknowledgments
Both authors, Howard A. Kader, M.D. and Velizar T. Tchernev, Ph.D., contributed equally in the construction of the manuscript.
References
- 1.Sartor RB. Cytokines in intestinal inflammation: Patho-physiological and clinical considerations. Gastroenterology. 1994;106:533–9. doi: 10.1016/0016-5085(94)90614-9. [DOI] [PubMed] [Google Scholar]
- 2.Radford-Smith G, Jewell DP. Cytokines and inflammatory bowel disease. Baillieres Clin Gastroenterol. 1996;10(1):151–64. doi: 10.1016/s0950-3528(96)90045-7. [DOI] [PubMed] [Google Scholar]
- 3.Isaacs KL, Sartor RB, Haskill JS. Cytokine mRNA profiles in inflammatory bowel disease mucosa detected by PCR amplification. Gastroenterology. 1992;103:1587–95. doi: 10.1016/0016-5085(92)91182-4. [DOI] [PubMed] [Google Scholar]
- 4.Bousvaros A, Leichtner A, Zurakowski D, et al. Elevated serum vascular endothelial growth factor in children and young adults with Crohn’s disease. Dig Dis Sci. 1999;44:424–30. doi: 10.1023/a:1026635308127. [DOI] [PubMed] [Google Scholar]
- 5.Berrebi D, Languepin J, Ferkdadji L, et al. Cytokines, chemokine receptors, and homing molecule distribution in the rectum and stomach of pediatric patients with ulcerative colitis. J Pediatr Gastroenterol Nutr. 2003;37(3):300–8. doi: 10.1097/00005176-200309000-00018. [DOI] [PubMed] [Google Scholar]
- 6.Seo M, Okada M, Yao T, et al. An index of disease activity in patients with ulcerative colitis. Am J Gastroenterol. 1992;87(8):971–6. [PubMed] [Google Scholar]
- 7.Seo M, Okada M, Yao T, et al. Evaluation of disease activity in patients with moderately active ulcerative colitis: Comparisons between a new activity index and Truelove and Witts’ Classification. Am J Gastroenterol. 1995;90(10):1759–63. [PubMed] [Google Scholar]
- 8.TrueLove SC, Witts LJ. Cortisone in ulcerative colitis: Final report on a therapeutic trial. Br Med J. 1955;2:1042–8. doi: 10.1136/bmj.2.4947.1041. [DOI] [PMC free article] [PubMed] [Google Scholar]
- 9.Schweitzer B, Robert S, Grimwade B, et al. Multiplexed protein profiling on microarrays by rolling-circle amplification. Nat Biotechnol. 2002;20:359–65. doi: 10.1038/nbt0402-359. [DOI] [PMC free article] [PubMed] [Google Scholar]
- 10.Desreumaux P, Brandt E, Gambiez L, et al. Distinct cytokine patterns in early and chronic ileal lesions of Crohn’s disease. Gastroenterology. 1997;113:118–26. doi: 10.1016/s0016-5085(97)70116-1. [DOI] [PubMed] [Google Scholar]
- 11.Mullin EG, Maycon ZR, Braun-Elwert L, et al. Inflammatory bowel disease mucosal biopsies have specialized lymphokine mRNA profiles. Inflamm Bowel Dis. 1996;99:956–63. [PubMed] [Google Scholar]
- 12.Breese E, Braegger CP, Corrigan CJ, et al. Interleukin-2 -and interferon-γ- secreting T cells in normal and diseased human intestinal mucosa. Immunology. 1993;78:127–31. [PMC free article] [PubMed] [Google Scholar]
- 13.Crabtree J, Heatley R, Juby L. Soluble interleukin 2 receptor in Crohn’s disease: Relation of serum concentration to disease activity. Gut. 1989;31:1033–6. doi: 10.1136/gut.31.9.1033. [DOI] [PMC free article] [PubMed] [Google Scholar]
- 14.Weiner HL. Induction and mechanism of action of transforming growth factor-beta-screening Th3 regulatory cells. Immunol Rev. 2001;182:207–14. doi: 10.1034/j.1600-065x.2001.1820117.x. [DOI] [PubMed] [Google Scholar]
- 15.McHugh RS, Shevach EM. The role of suppressor T cells in regulation of immune responses. J Allergy Clin Immunol. 2002;110(5):693–702. doi: 10.1067/mai.2002.129339. [DOI] [PubMed] [Google Scholar]
- 16.Shevach EM. CD4+CD25+suppressor T cells: More questions than answers. Nat Rev Immunol. 2002;2(6):389–400. doi: 10.1038/nri821. [DOI] [PubMed] [Google Scholar]
- 17.Shevach EM, McHugh RS, Piccirillo CA, et al. Control of T-cell activation by CD4+ CD25+ suppressor T cells. Immunol Rev. 2001;182:58–67. doi: 10.1034/j.1600-065x.2001.1820104.x. [DOI] [PubMed] [Google Scholar]
- 18.Niessner M, Volk BA. Altered Th1/Th2 cytokines profiles in the intestinal mucosa of patients with inflammatory bowel disease as assessed by quantitative reversed transcribed polymerase chain reaction (RT-PCR) Clin Exp Immunol. 1995;101:428–35. doi: 10.1111/j.1365-2249.1995.tb03130.x. [DOI] [PMC free article] [PubMed] [Google Scholar]
- 19.Mullin GE, Lazenby AJ, Harris ML, et al. Increased interleukin-2 messenger RNA in the intestinal mucosal lesions of Crohn’s disease but not ulcerative colitis. Gastroenterology. 1992;102:1620–7. doi: 10.1016/0016-5085(92)91722-g. [DOI] [PubMed] [Google Scholar]
- 20.Matsuura T, West GA, Youngman KR, et al. Immune activation genes in inflammatory bowel disease. Gastroenterology. 1992;102:1620–7. doi: 10.1016/0016-5085(93)90413-7. [DOI] [PubMed] [Google Scholar]
- 21.Mullin GE, Vezza FR, Sampat A, et al. Abnormal IL-10 mRNA production in the intestinal mucosal lesions of inflammatory bowel disease (abstract) Gastroenterology. 1993;104:A751. [Google Scholar]
- 22.Hyams JS, Fitzgerald JE, Treem WR, et al. Relationship of functional and antigenic interleukin 6 to disease activity in inflammatory bowel disease. Gastroenterology. 1993;104:1285–92. doi: 10.1016/0016-5085(93)90336-b. [DOI] [PubMed] [Google Scholar]
- 23.Crotty B, Hoang P, Dalton HR, et al. Salicylates used in inflammatory bowel disease and colchicine impair interferon-gamma induced HLA-DR expression. Gut. 1992;33:59–64. doi: 10.1136/gut.33.1.59. [DOI] [PMC free article] [PubMed] [Google Scholar]
- 24.Schwiebert LA, Beck LA, Stellato C, et al. Glucocorticos-teroid inhibition of cytokine production: Relevance to antiallergic actions. J Allergy Clin Immunol. 1996;96:1069–75. doi: 10.1016/s0091-6749(96)80214-4. [DOI] [PubMed] [Google Scholar]
- 25.Papadikis KA, Prehn J, Moreno SF, et al. CCR9-positive lymphocytes and thymus-expressed chemokine distinguish small bowel from colonic Crohn’s disease. Gastroenterology. 2001;121:246–54. doi: 10.1053/gast.2001.27154. [DOI] [PubMed] [Google Scholar]
- 26.Fiocchi C, Fukushima K, Strong SA, et al. Pitfalls in cytokine analysis in inflammatory bowel disease. Aliment Pharmacol Ther. 1996;10(Suppl 2):63–9. doi: 10.1046/j.1365-2036.1996.22164022.x. [DOI] [PubMed] [Google Scholar]
- 27.Review, Scand J Gastroenterol. 1992;27:897–906. doi: 10.3109/00365529209000160. [DOI] [PubMed] [Google Scholar]
- 28.Louis E, Belaiche J, van Kemseke C, et al. A high serum concentration of interleukin-6 is predictive of relapse in quiescent Crohn’s disease. Eur J Gastroenterol Hepatol. 1997;9(10):939–44. doi: 10.1097/00042737-199710000-00004. [DOI] [PubMed] [Google Scholar]
- 29.Kucharzik T, Stoll R, Lugering N, et al. Circulating anti-inflammatory cytokine IL-10 in patients with inflammatory bowel disease (IBD) Clin Exp Immunol. 1995;100:452–6. doi: 10.1111/j.1365-2249.1995.tb03721.x. [DOI] [PMC free article] [PubMed] [Google Scholar]
- 30.Vitkovic L, Maeda S, Sternberg E. Anti-inflammatory cytokines: Expression and action in the brain. Neuroim-munomodulation. 2001;9(6):295–312. doi: 10.1159/000059387. [DOI] [PubMed] [Google Scholar]
- 31.Gorelik L, Flavell RA. Transforming Growth Factor-beta in T-cell Biology. Nat Rev. 2002;2(1):46–53. doi: 10.1038/nri704. [DOI] [PubMed] [Google Scholar]
- 32.Luethviksson BR, Gunnlaugsdottir B. Transforming growth factor-beta as a regulator of site-specific T-cell inflammatory response. Scand J Immunol. 2003;58(2):129–38. doi: 10.1046/j.1365-3083.2003.01297.x. [DOI] [PubMed] [Google Scholar]
- 33.Bartolome RA, Sanz-Rodriguez F, Robledo MM, et al. Rapid up-regulation of alpha4 integrin-mediated leukocyte adhesion by transforming growth factor-beta1. Mol Biol Cell. 2003;14(1):54–66. doi: 10.1091/mbc.E02-05-0275. [DOI] [PMC free article] [PubMed] [Google Scholar]
- 34.Pardoux C, Ma X, Gobert S, et al. Downregulation of interleukin-12 (IL-12) responsiveness in human T cells by transforming growth factor-beta: Relationship with IL-12 signaling. Blood. 1999;93(5):1448–55. [PubMed] [Google Scholar]
- 35.Lawrance IC, Maxwell L, Doe W. Inflammation location, but not type, determines the increase in TGF-beta1 and IGF-1 expression and collagen deposition in IBD intestine. Inflamm Bowel Dis. 2001;7(1):16–26. doi: 10.1097/00054725-200102000-00003. [DOI] [PubMed] [Google Scholar]
- 36.Xian CJ, Xu X, Mardell CE, et al. Site-specific changes in transforming growth factor-alpha and beta1 expression in colonic mucosa of adolescents with inflammatory bowel disease. Scand J Gastroenterol. 1999;34(6):591–600. doi: 10.1080/003655299750026056. [DOI] [PubMed] [Google Scholar]
- 37.Otten LA, Tacchini-Cottier F, Lohoff M, et al. Deregulated MHC class II transactivator expression leads to a strong Th2 bias in CD4+ T lymphocytes. J Immunol. 2003;170(3):1150–7. doi: 10.4049/jimmunol.170.3.1150. [DOI] [PubMed] [Google Scholar]
- 38.Komschlies KL, Grzegorzewski KJ, Wiltrout RH. Diverse immunological and hematological effects of interleukin-7: Implications for clinical application. J Leukoc Biol. 1995;58(6):623–33. doi: 10.1002/jlb.58.6.623. [DOI] [PubMed] [Google Scholar]
- 39.Wantanabe M, Yamazaki M, Kanai T. Mucosal T cells as a target for treatment in IBD. J Gastroenterol. 2003;(Suppl 15):48–50. [PubMed] [Google Scholar]
- 40.Fry TJ, Mackall CL. Master regulator of peripheral T-cell homeostasis? Trends Immunol. 2001;22(10):564–71. doi: 10.1016/s1471-4906(01)02028-2. [DOI] [PubMed] [Google Scholar]
- 41.Appasamy PM. Biological and clinical implications of interleukin-7 and lymphopoiesis. Cytokines Cell Mol Ther. 1999;5(1):25–39. [PubMed] [Google Scholar]
- 42.Haks MC, Oosterwegel MA, Blom B, et al. Cell-fate decisions in early T-cell development: Regulation by cytokine receptors and the pre-TCR. Semin Immunol. 1999;11(1):23–37. doi: 10.1006/smim.1998.0153. [DOI] [PubMed] [Google Scholar]
- 43.Fry TJ, Moniuszko M, Creekmore S, et al. IL-7 therapy dramatically alters peripheral T-cell homeostasis in normal and SIV-infected nonhuman primates. Blood. 2003;101(6):2294–9. doi: 10.1182/blood-2002-07-2297. [DOI] [PubMed] [Google Scholar]
- 44.Tan JT, Ernst B, Kieper WC, et al. Interleukin-15 and IL-7 jointly regulate homeostatic proliferation of memory phenotype CD8+ cells but are not required for memory phenotype CD4+ Cells. J Exp Med. 2002;195(12):1523–32. doi: 10.1084/jem.20020066. [DOI] [PMC free article] [PubMed] [Google Scholar]
- 45.Varas A, Vicente A, Jimenez E, et al. Interleukin-7 treatment promotes the differentiation pathway of T-cell-receptor-alpha beta cells selectively to the CD8+ cell lineage. Immunology. 1997;92(4):457–64. doi: 10.1046/j.1365-2567.1997.00387.x. [DOI] [PMC free article] [PubMed] [Google Scholar]
- 46.Mehrotra PT, Grant AJ, Siegel JP. Synergistic effects of IL-7 and IL-12 on human T cell activation. J Immunol. 1995;154(10):5093–102. [PubMed] [Google Scholar]
- 47.van Roon JA, Glaudemans KA, Bijlsma JW, et al. Interleukin 7 stimulates tumour necrosis factor alpha and Th1 cytokine production in joints of patients with rheumatoid arthritis. Ann Rheum Dis. 2003;62(2):113–9. doi: 10.1136/ard.62.2.113. [DOI] [PMC free article] [PubMed] [Google Scholar]
- 48.Sin JL, Kim J, Pachuk C, et al. Interleukin 7 can enhance antigen-specific cytotoxic T lymphocyte and/or Th2 type immune responses in vivo. Clin Diagn Lab Immunol. 2000;7(5):751–8. doi: 10.1128/cdli.7.5.751-758.2000. [DOI] [PMC free article] [PubMed] [Google Scholar]
- 49.Wynn TA, Jankovic D, Hieny S, et al. IL-12 exacerbates rather than suppresses T helper 2-dependent pathology in the absence of endogenous IFN-gamma. J Immunol. 1995;154(8):3999–4009. [PubMed] [Google Scholar]
- 50.Trinchieri G. Proinflammatory and immunoregulatory functions of interleukin-12. Int Rev Immunol. 1998;16(3–4):365–96. doi: 10.3109/08830189809043002. [DOI] [PubMed] [Google Scholar]
- 51.Peeva E, Fishman AD, Goddard G, et al. Rheumatoid arthritis exacerbation caused by exogenous interleukin-12. Arthritis Rheum. 2000;43(2):461–3. doi: 10.1002/1529-0131(200002)43:2<461::AID-ANR29>3.0.CO;2-7. [DOI] [PubMed] [Google Scholar]
- 52.Trinchieri G. Immunobiology of interleukin-12. Immunol Res. 1998;17(1–2):269–78. doi: 10.1007/BF02786451. [DOI] [PubMed] [Google Scholar]
- 53.Adorini L. Interleukin-12, a key cytokine in Th1-mediated autoimmune diseases. Cell Mol Life Sci. 1999;55(12):1610–25. doi: 10.1007/s000180050400. [DOI] [PMC free article] [PubMed] [Google Scholar]
- 54.Wang KS, Frank DA, Ritz J. Interleukin-12 enhances the response of natural killer cells to interleukin-12 through up-regulation of the interleukin-12 receptor and STAT4. Blood. 2000;95(10):3183–90. [PubMed] [Google Scholar]
- 55.Trinchieri G. Interleukin-12 and the regulation of innate resistance and adaptive immunity. Nat Rev. 2003;3(2):133–46. doi: 10.1038/nri1001. [DOI] [PubMed] [Google Scholar]
- 56.Ethuin F, Delarche C, Gougerot-Pocidalo MA, et al. Regulation of interleukin 12 p40 and p70 production by blood and alveolar phagocytes during severe sepsis. Lab Invest. 2003 Sep;83(9):1353–60. doi: 10.1097/01.lab.0000087589.37269.fc. [DOI] [PubMed] [Google Scholar]
- 57.Goodridge HS, Harnett W, Liew FY, et al. Differential regulation of interleukin-12 p40 and p35 induction via Erk mitogen-activated protein kinase-dependent and -independent mechanisms and the implications for bioactive IL-12 and IL-23 responses. Immunology. 2003 Jul;109(3):415–25. doi: 10.1046/j.1365-2567.2003.01689.x. [DOI] [PMC free article] [PubMed] [Google Scholar]
- 58.Viglietto G, Maglione D, Rambaldi M, et al. Upregulation of vascular endothelial growth factor (VEGF) and down-regulation of placenta growth factor (PlGF) associated with malignancy in human thyroid tumors and cell lines. Oncogene. 1995;11:1569–79. [PubMed] [Google Scholar]
- 59.Clauss M, Weich H, Breier G, et al. The vascular endothelial growth factor receptor Flt-1 mediates biological activities. Implications for a functional role of placenta growth factor in monocyte activation and chemotaxis. J Biol Chem. 1996;271:17629–34. doi: 10.1074/jbc.271.30.17629. [DOI] [PubMed] [Google Scholar]
- 60.Neurath MF, Fuss I, Kelsall BL, et al. Experimental granulomatous colitis in mice is abrogated by induction of TGF-beta mediated oral tolerance. J Exp Med. 1996;183(6):2605–16. doi: 10.1084/jem.183.6.2605. [DOI] [PMC free article] [PubMed] [Google Scholar]