

Abstract
Purpose
This laboratory has previously published on phosphorodiamidate morpholino (MORF) pretargeting of tumor in which an anti-tumor antibody conjugated with MORF (a DNA analogue) is first administered, followed at a later time by the radiolabeled complementary MORF (cMORF) as the effector. In the present study, the pharmacokinetics of the antibody and effector were measured under different conditions in mice to establish their quantitative relationships with tumor accumulations by pretargeting.
Methods
A cytosine-free 18 mer cMORF was conjugated with MAG3 for 99mTc labeling while the anti-CEA antibody MN14 was conjugated with DTPA for 111In labeling and with MORF to impart binding affinity for radiolabeled cMORF. Mice bearing LS174T thigh tumors were used to study: (1) the pharmacokinetics of MN14-MORF by administering 111In-MN14 at doses between 10 and 100 μg with sacrifice at 2 days and at 30 μg with sacrifice between 1 and 3 days; (2) the biodistribution of 99mTc-cMORF following one to four injections (containing 0.15 μg each and separated by 1 h) to animals having received 30 μg of antibody–MORF 2 days earlier and with sacrifice at 3 h after the final injection; and (3) the influence on the biodistribution of 99mTc-cMORF of a 2 to 4 day interval between the administration of 30 μg of antibody–MORF and 0.30 μg of 99mTc-cMORF.
Results
(1) The biodistribution of antibody in percent accumulation (%ID or %ID/g) was largely independent of antibody dose but the absolute accumulation of antibody in tumor increased linearly with dose, showing no evdence of tumor saturation of CEA sites by MN14. Over 1–3 days post antibody administration, blood levels of radiolabeled antibody decreased as expected; however, tumor levels remained constant, thus showing an absence of antibody clearance in tumor over this period. (2) With fixed anti-body–MORF dose and increasing number of injections of 99mTc-cMORF, cumulative percent blood levels steadily decreased in agreement with the values calculated based on the antibody–MORF in blood. In contrast, cumulative percent tumor levels stayed fairly constant over the first two injections. Thus the antibody–MORF in tumor became saturated with cMORF more slowly than that in blood owing to delivery differences. (3) As expected, percent blood levels decreased with increasing interval between injections of antibody–MORF and 99mTc-cMORF. The percent tumor accumulation, however, remained constant over the 3 day interval, thus demonstrating only slow loss of MORF expression in situ. The 99mTc-cMORF accumulation in tumor after saturation was mathematically determined based on the antibody–MORF concentration in tumor while the blood levels of 99mTc-cMORF were determined based on the concentration of antibody-MORF in blood.
Conclusion
Contrary to conclusions arrived at in our earlier study, the results of this study show that tumor CEA sites were not saturated even at the highest antibody dose investigated, that accessibility of MORF sites in tumor by 99mTc-cMORF was unhindered and that the maximum percent tumor accumulation of 99mTc-cMORF depended only on the tumor delivery efficiency of 99mTc-cMORF.
Keywords: Pretargeting, MORF, Tumor detection
Introduction
Tumor pretargeting has the potential to improve radionuclide delivery for imaging and therapy over conventional tumor targeting [1–4]. Pretargeting usually begins with the administration of a modified antibody that targets tumor and, in addition, can recognize and bind with high affinity a radiolabeled small molecule (effector) designed to clear rapidly from all tissues other than tumor. The recognition systems that are under investigation include bispecific antibody/hapten [5–9], (strept) avidin/biotin [10–15], and oligomers/complementary oligomers [16–19].
Optimization of each pretargeting system is made difficult because of the multiple adjustable variables. For a given tumor model, starting from the injection of the modified antibody, at least four variables need to be adjusted: the dose of antibody, the time interval between the injections of the antibody and the effector (i.e., the pretargeting interval), the dose of effector, and the sacrifice time or imaging time (i.e., the detection time). In particular, two important factors that obviously define a pretargeting system are the pharmacokinetics of both the non-radioactive antibody and the radioactive effector.
We have been investigating a family of phosphorodiamidate morpholino oligomers (MORFs) for pretargeting applications [16–19]. In this strategy, a MORF is conjugated to a non-internalizing antitumor antibody such as the anti-carcinoembryonic antigen (CEA) antibody MN14 and the conjugate administered to tumor-bearing mice, followed at a later time by the injection of the radiolabeled complementary MORF (cMORF). After we demonstrated proof of concept for this pretargeting approach [16], the time interval between the two injections and the dose of antibody–MORF were examined [17], while the dose of the radiolabeled cMORF was considered on another occasion [18]. In these early studies, the cMORF base sequence contained cytosine bases that were ultimately identified as responsible for high kidney radioactivity levels [20]. Thereafter all subsequent studies, including this one, used an alternative MORF/cMORF pair in which the radiolabeled cMORF was cytosine-free. The results of these previous investigations led us to conclude that the CEA levels in tumor were saturated with the antibody and that 50% of the MORF located in tumor was accessible to the radiolabeled cMORF effector. The more complex pharmacokinetic study described herein, with its focus on tumor, has shown both conclusions to be incorrect.
Materials and methods
Two 3′ amine derivatized phosphorodiamidate mopholino oligomers were purchased from Gene Tools (Philomath, OR) with the 10-atom linker H2N-CH2-CH(CH2CH2)2N-COCH2CH2-CO-. Each MORF was analyzed by size-exclusion high-performance liquid chromatography (HPLC) and matrix-assisted laser desorption ionisation time-of-flight mass spectrometry (MALDI-TOF) to ensure quality. The base sequences and molecular weights were 5′-TCTTCTACTT CACAACTA-linker-amine, MW 6,198 Da (MORF) and 5′-TAG TTGTGAAGTAGAAGA-linker-amine, MW 6,456 Da (cMORF). The high-affinity murine anti-CEA antibody MN14 (IgG 1 subtype, MW 160 kDa) was a gift from Immunomedics (Morris Plains, NJ). The 1-ethyl-3(3-dimethylaminopropyl) carbodiimide hydrochloride (EDC) was purchased (Pierce Company, Rockford, IL). The DTPA cyclic anhydride was from Sigma (St Louis, MO). The S-acetyl NHS-MAG3 was synthesized in house [21] and the structure confirmed by elemental analysis, proton nuclear magnetic resonance, and mass spectroscopy. The P4 resin (Bio-Gel P4 Gel, medium) was purchased (Bio-Rad Laboratories, Hercules, CA), as was the Sephadex G100 resin (Pharmacia Biotech, Uppsala, Sweden). The 99mTc-pertechnetate was eluted from a 99Mo–99mTc generator (Perkin Elmer Life Science Inc, Boston, MA). All other chemicals were reagent grade and were used without purification.
Size-exclusion HPLC
Size-exclusion HPLC analysis was performed on a Superose-12 HR10/30 column with an optimal separation range between 1×10³ and 3×10⁵ Da (Amersham Pharmacia Biotech, Piscataway, NJ) using 0.10 M pH 7.2 phosphate buffer as eluant at a flow rate of 0.6 ml/min. The HPLC was equipped with both an in-line radioactivity detector and a Waters 2487 dual wavelength absorbance detector (Milford, MA). Recovery of radioactivity was routinely measured.
111In-MN14
The MN14-DTPA was prepared as described elsewhere [22]. Briefly, 300 μl (10 mg/ml) of MN14 in phosphate buffer solution was added to 300 μl of 0.5 M pH 8.0 NaHCO3 buffer, followed by addition of 40 μl (2.0 mg/ml) DTPA cyclic anhydride suspended in dimethylformamide. The molar ratio of DTPA to MN14 was therefore 12:1. After incubation for more than 1 h, the average groups per molecule (gpm) of DTPA on MN14 was determined as 2.3 by labeling the reaction mixture with 111In followed by HPLC analysis and assuming the same accessibility of 111In to both conjugated and free DTPA. The MN14-DTPA was purified on a 0.7×20 cm Sephadex G-100 column with 0.05 M pH 7.2 phosphate buffer. The concentration of MN14-DTPAwas quantitated by HPLC. Labeling was routinely achieved by simply mixing 6 μl of 0.5 M pH 6.0 NaOAc buffer with 12 μl of 111InCl3 in 50 mM HCl and adding this to 200 μl of purified MN14-DTPA. The labeling efficiency was greater than 95%.
99mTc-cMORF
The cMORF was first conjugated with S-acetyl NHS-MAG3 via the 3′ derivatized amine as previously described [23]. Briefly, a solution of 1 mg of cMORF in 200 μl of 0.20 M pH 8.0 HEPES buffer was added to a vial containing 1.7–2.0 mg of S-acetyl NHS-MAG3. The vial was vortexed immediately and incubated for 1 h at room temperature. The cMORF was then purified on a 0.7×20 cm P4 column with 0.25 M pH 5.2 NH4OAc buffer as eluant. The peak fractions were pooled and were then adjusted from pH 5.2 to pH 7.6 with a pH 9.2 buffer (0.5 M Na2HCO3, 0.25 M NH4OAc, 0.175 M NH3). After heating for 20 min, the solution was again purified over P4 using the pH 5.2 NH4OAc buffer as eluant [23]. The peak fractions were pooled as before and the concentration quantitated by UV absorbance at 265 nm.
High specific radioactivity of the labeled cMORF was achieved by introducing about 13.6 mCi (100 μl) of 99mTc-pertechnetate generator eluate into a combined solution of 50 μl (14.0 μg) MAG3-conjugated cMORF in the pH 5.2 NH4OAc buffer, 15 μl of 50 μg/μl Na2tartrate·2 H2O in the pH 9.2 buffer, and 3 μl of 4 μg/μl SnCl2·2 H2O in ascorbate-HCl solution (1 μg/μl sodium ascorbate in 10 mM HCl). The final pH was 7.8. After vortexing and then heating for 20 min in boiling water, the labeled cMORF was purified over the P4 column with 50 mM pH 7.2 phosphate buffer as eluant. The peak fractions (about 8 mCi) were pooled. Specific radioactivity, estimated by assuming 100% recovery of cMORF off the P4 column, was about 790 μCi/μg (i.e., 5.1×10⁶ μCi/μmol). Radiochemical purity of more than 98% was determined by HPLC. In cases where the 99mTc-cMORF preparation needed dilution for injection, 0.05% human serum albumin in 0.05 M phosphate buffer was used to avoid adsorption.
The conjugation of MN14 with MORF was performed as previously described by reacting the amine-derivatized MORF with the native antibody using EDC followed by purification on Sephadex G-100 with 0.05 M pH 7.2 phosphate buffer [16–18]. The average groups per molecule (gpm) was 0.17 and was determined as previously described, i.e., radiolabeled cMORF was added at a known excess to the purified MN14-MORF preparation and the gpm was calculated from the peak areas of antibody bound 99mTc-cMORF and free 99mTc-cMORF in the radioactivity HPLC profiles [18].
Animal studies
All animal studies were performed with the approval of the UMMS Institutional Animal Care and Use Committee. For tumor induction, 106 LS174T colon cancer cells were injected into the left thigh of each Swiss NIH nude mouse (Taconic Farms, Germantown, NY). Animals each received either 111In-labeled MN14 or MN14-MORF via tail vein usually on the 12th day when tumors were about 1 g. In the cases of imaging with pretargeting, after the mice had been sacrificed by heart puncture under halothane anesthesia, urine was removed to avoid the interference of bladder radioactivity [16]. Imaging was performed on a large field of view APEX 409 M Elscint gamma camera (Hackensack, NJ) fitted with a parallel-hole collimator.
Biodistribution were determined at predetermined times after tail vein administration of 111In-MN14 or 99mTc-cMORF. After sacrifice, blood and other organs were removed, weighed, and counted in an NaI(Tl) well counter (Cobra II automatic gamma counter, Packard Instrument Company, CT) along with a standard of the injectate. Blood and muscle were assumed to constitute 7% and 40% of body weight respectively. The tumor-bearing thigh was also excised for counting but after the skin and as much as possible of the muscle and bone had been removed. The radioactivity was attributed to the tumor since the radioactivity in bone and muscle was negligible (see below). Thereafter the tumor was dissected away so that the remaining bone and muscle could be weighed, and this weight was subtracted to provide the net tumor weight used in the calculation of tumor accumulation. Radioactivity remaining in the carcass was measured in a dose calibrator. Summation of radioactivity in all organs sampled and in the remaining carcass was taken as the whole-body radioactivity.
Five groups of four mice each received IV either 11, 25, 50, 75, or 100 μg 111In-MN14 (8 μCi) and were sacrificed at 48 h. The 111In-MN14 was used to follow the in vivo behavior of MN14-MORF by assuming the same pharmacokinetics. In a separate study, five groups of four mice each received 30 μg (12 μCi) of 111In-MN14 and were sacrificed at 24, 36, 48, 60, or 72 h. Blood samples were also obtained from tail tip periodically to help establish the blood clearance curve. The curve was fitted with an exponential-decay non-linear regression model (SigmaPlot, Statistical Solutions. Saugus, MA).
Blood clearance of 99mTc-cMORF
A dose of 0.5 μg (200 μCi) of 99mTc-cMORF was injected IV into each of two mice. Blood samples were then periodically obtained from the tail tip to establish the blood clearance curve of 99mTc-cMORF. The 99mTc blood curves were fitted as in the case of 111In-MN14.
Multiple injections of 99mTc-cMORF
Four groups of four tumor-bearing mice each received 30 μg of MN14-MORF and, 48 h later, received IV either one, two, three, or four injections of radiolabeled cMORF spaced 1 h apart, each of 0.15 μg (40 μCi). The 1 h interval was selected based on the blood clearance curve and our earlier experience that more than 90% of the labeled cMORF clears from the whole body in this time [18, 19].
Variable pretargeting intervals
Three groups of four mice each received IV 30 μg of MN14-MORF antibody at different times post tumor implantation: the first group on the 12th day, the second group on the 13th day, and the last group on the 14th day. All three groups received 0.30 μg of 99mTc-cMORF on the 16th day so that the interval between injections of antibody and labeled cMORF was 4, 3, and 2 days respectively. All mice were sacrificed 3 h post injection of radioactivity, urine was removed, and the animals were imaged before dissection for biodistribution.
Results
Pharmacokinetics of antibody–MORF
Biodistribution at 2 days following administration of 111In-MN14 at five different doses is shown in Table 1 in %ID/g or %ID/organ. When presented in this fashion, the accumulations appear generally constant and independent of antibody dose. Therefore, when presented in absolute terms as μg per gram or per organ, accumulations will increase linearly with dose, as shown in Fig. 1 using tumor and blood as examples. The linear increase in absolute tumor accumulation within the range of 10–100 μg of 111In-MN14 indicated that the tumor was not saturated with antibody even at the highest dose.
Table 1.
Biodistribution of 111 In-MN14 at 48 h post administration at five different doses
| 11.3 μg
|
25.0 μg
|
50.0 μg
|
75.0 μg
|
100.0 μg
|
||||||
|---|---|---|---|---|---|---|---|---|---|---|
| Organ | Mean | SD | Mean | SD | Mean | SD | Mean | SD | Mean | SD |
| (A) %ID/g | ||||||||||
| Liver | 13.84 | 2.13 | 13.04 | 1.19 | 11.32 | 0.87 | 12.77 | 0.82 | 12.28 | 1.34 |
| Heart | 1.23 | 0.10 | 1.37 | 0.12 | 1.14 | 0.08 | 1.19 | 0.03 | 1.19 | 0.11 |
| Kidney | 8.93 | 3.73 | 11.76 | 0.54 | 9.17 | 0.83 | 11.24 | 0.31 | 8.53 | 0.80 |
| Lung | 1.53 | 0.15 | 1.58 | 0.15 | 1.45 | 0.04 | 1.48 | 0.18 | 1.48 | 0.08 |
| Spleen | 5.15 | 0.88 | 5.56 | 0.63 | 4.60 | 0.23 | 4.19 | 0.42 | 4.32 | 0.54 |
| Muscle | 0.47 | 0.03 | 0.51 | 0.06 | 0.40 | 0.03 | 0.45 | 0.04 | 0.43 | 0.04 |
| Tumor | 9.36 | 1.63 | 10.10 | 0.77 | 8.29 | 0.57 | 7.05 | 0.98 | 8.54 | 1.17 |
| Blood | 1.70 | 0.31 | 1.65 | 0.08 | 1.61 | 0.13 | 1.83 | 0.14 | 2.00 | 0.28 |
| (B) %ID/organ | ||||||||||
| Stomach | 0.40 | 0.20 | 0.61 | 0.27 | 0.35 | 0.05 | 0.35 | 0.11 | 0.34 | 0.04 |
| Sm. int. | 1.34 | 0.20 | 1.34 | 0.07 | 1.41 | 0.16 | 1.23 | 0.08 | 1.38 | 0.15 |
| Lg. int. | 0.61 | 0.07 | 0.73 | 0.28 | 0.63 | 0.09 | 0.63 | 0.22 | 0.73 | 0.10 |
| Whole body | 61.3 | 2.3 | 61.1 | 1.9 | 59.0 | 1.3 | 57.6 | 0.9 | 57.8 | 1.5 |
Mean of %ID/g (A) or %ID/ organ (B) with standard deviation (SD); n=4
Sm. int. small intestine, Lg. int. large intestine
Fig. 1.

Absolute accumulation per gram in tumor and blood of 111In-MN14 at 48 h following IV administration. Bars indicate one standard deviation
Because no important differences in the biodistribution of 111In-MN14 in %ID were observed up to 100 μg, a dose of 30 μg was selected for all subsequent studies. Table 2 presents biodistributions in %ID/g or %ID/organ in animals administered this dose of antibody and sacrificed at different times from 1 to 3 days later. Once again, no important changes in radioactivity levels are apparent with time of sacrifice, with the exception of blood, which showed an almost linear decrease, and heart and lungs, which also showed a decrease, but a less rapid one. Figure 2 presents the %ID/g in tumor and blood with time. Therefore, while the blood levels of radiolabeled antibody decreased as expected, the constant tumor radioactivity levels show that the antibody did not clear substantially from tumor over this period.
Table 2.
Biodistribution of 30 μg 111 In MN14 at five different times
| 24 h
|
36 h
|
48 h
|
60 h
|
72 h
|
||||||
|---|---|---|---|---|---|---|---|---|---|---|
| Organ | Mean | SD | Mean | SD | Mean | SD | Mean | SD | Mean | SD |
| (A) %ID/g | ||||||||||
| Liver | 12.24 | 2.25 | 14.44 | 1.08 | 16.21 | 1.44 | 11.39 | 1.10 | 14.35 | 0.75 |
| Heart | 1.32 | 0.07 | 1.08 | 0.32 | 0.99 | 0.16 | 0.68 | 0.15 | 0.74 | 0.16 |
| Kidney | 11.53 | 2.16 | 12.36 | 1.64 | 11.72 | 0.39 | 11.55 | 1.16 | 11.51 | 0.81 |
| Lung | 2.02 | 0.27 | 1.90 | 0.31 | 1.79 | 0.33 | 1.31 | 0.13 | 1.26 | 0.38 |
| Spleen | 5.00 | 0.84 | 5.08 | 0.33 | 6.90 | 0.72 | 3.83 | 0.25 | 4.50 | 0.55 |
| Muscle | 0.56 | 0.08 | 0.45 | 0.10 | 0.46 | 0.08 | 0.35 | 0.06 | 0.45 | 0.05 |
| Tumor | 7.68 | 1.79 | 8.87 | 0.63 | 8.59 | 3.51 | 8.69 | 0.97 | 8.22 | 1.42 |
| Blood | 3.54 | 0.25 | 2.67 | 0.49 | 2.24 | 0.29 | 1.11 | 0.29 | 0.60 | 0.19 |
| (B) %ID/organ | ||||||||||
| Stomach | 0.36 | 0.04 | 0.32 | 0.10 | 0.39 | 0.08 | 0.29 | 0.01 | 0.29 | 0.02 |
| Sm. int. | 1.59 | 0.22 | 1.60 | 0.27 | 1.77 | 0.07 | 1.28 | 0.14 | 1.48 | 0.06 |
| Lg. int. | 0.68 | 0.07 | 0.76 | 0.08 | 0.87 | 0.09 | 0.62 | 0.07 | 0.75 | 0.12 |
| Whole body | 70.2 | 3.5 | 66.9 | 2.8 | 63.1 | 2.4 | 58.7 | 1.0 | 56.6 | 1.1 |
Mean of %ID/g (A) or %ID/ organ (B) with standard deviation (SD); n=4
Sm. int. small intestine, Lg. int. large intestine
Fig. 2.
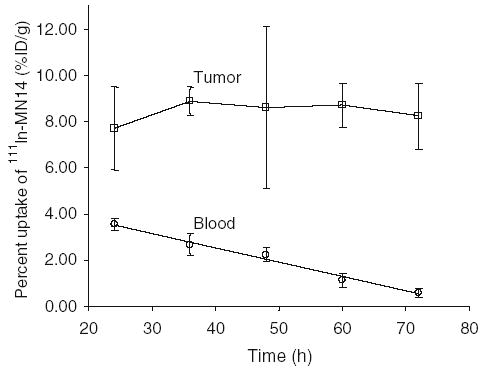
Percent accumulation per gram in tumor and blood at 1 to 3 days post administration of 30 μg 111In-MN14. Bars indicate one standard deviation
Figure 3 presents the blood clearance curve of 111In-MN14 in %ID/g from the results in Table 2, as well as the results of periodic blood sampling from multiple animals. The solid line is the result of fitting to equation: %ID/g of 111In – MN14 in blood = 8.345 exp [−2.062T]+8.091 exp [−0.171T] + 7.092 exp [−0.027T]; where T is time in h. As is evident, after 24 h the third term dominates such that the blood clearance curve in the figure becomes almost linear.
Fig. 3.

Blood clearance curve of 111In-MN14 in %ID/g. The solid line represents the regression fit
Blood clearance of 99mTc-cMORF
The blood clearance curve of 99mTc-cMORF is shown in Fig. 4. The solid line is the result of fitting to: %ID/g of 99mTc – cMORF in blood = 5.604 exp [−0.094T] + 3.40 7 exp [−0.026T]; where T is time in min. The clearance is rapid, such that only about 1 %ID/g remains in circulation after 1 h post injection.
Fig. 4.

Blood clearance curve of 99mTc-cMORF in %ID/g. The solid line represents the regression fit
Multiple injections of 99mTc-cMORF
Table 3 presents biodistribution in %ID/g or %ID/organ in animals receiving 30 μg MN14 followed 48 h later by one to four administrations of 99mTc-cMORF. All animals were sacrificed 3 h after the last injection. The cumulative accumulation results from the table for tumor and blood are reproduced in Fig. 5a in %ID/g of 99mTc-cMORF. When presented in this fashion, blood level decreases slowly with increasing number of injections of 99mTc-cMORF, a result consistent with our earlier observations following a single injection [18], and tumor accumulation follows a similar decreasing pattern. However, when the same data are presented as absolute accumulation (i.e., ng of cMORF per gram tissue), as in Fig. 5b, it becomes obvious that two injections double the absolute tumor accumulation. Thus following the first injection, sufficient MORF on antibody in tumor remains available to retain 99mTc-cMORF from the second injection. Furthermore, that the third injection results in a small absolute increase and the fourth injection results in an even smaller increase indicates that the antibody–MORF in tumor is now being saturated by 99mTc-cMORF. The behavior of blood in Fig. 5b is quite different in showing no increase in absolute accumulation with increasing injections. Thus blood levels of antibody–MORF are saturated by the first administration of radiolabeled cMORF. Thus before saturation of antibody–MORF in tumor, the percent tumor accumulation is constant with the number of injections but the absolute accumulation increases, while after saturation of the antibody–MORF, the absolute accumulation is a constant at its maximum value but the percent tumor accumulation decreases.
Table 3.
Biodistribution of 99m Tc-cMORF in tumor-bearing mice receiving 30 μg MN14-MORF followed 48 h later by one to four injections of 0.15 μg of 99m Tc-cMORF separated by 1 h, with sacrifice at 3 h after the last injection
| 1 injection
|
2 injections
|
3 injections
|
4 injections
|
|||||
|---|---|---|---|---|---|---|---|---|
| Organ | Mean | SD | Mean | SD | Mean | SD | Mean | SD |
| (A) %ID/g | ||||||||
| Liver | 0.86 | 0.21 | 0.71 | 0.08 | 0.50 | 0.13 | 0.48 | 0.02 |
| Heart | 0.42 | 0.14 | 0.40 | 0.10 | 0.26 | 0.08 | 0.25 | 0.06 |
| Kidney | 4.57 | 1.56 | 4.18 | 0.69 | 3.19 | 0.28 | 2.59 | 0.41 |
| Lung | 0.68 | 0.19 | 0.66 | 0.13 | 0.37 | 0.07 | 0.38 | 0.02 |
| Spleen | 0.39 | 0.08 | 0.34 | 0.08 | 0.22 | 0.02 | 0.22 | 0.02 |
| Muscle | 0.22 | 0.03 | 0.25 | 0.12 | 0.12 | 0.03 | 0.13 | 0.03 |
| Tumor | 4.39 | 0.74 | 4.42 | 0.52 | 3.80 | 0.36 | 2.95 | 0.31 |
| Fibula bone | 0.36 | 0.04 | 0.32 | 0.07 | 0.23 | 0.03 | 0.24 | 0.03 |
| Blood | 1.73 | 0.30 | 1.50 | 0.25 | 0.87 | 0.17 | 0.75 | 0.05 |
| (B) %ID/organ | ||||||||
| Stomach | 0.13 | 0.02 | 0.23 | 0.17 | 0.07 | 0.01 | 0.09 | 0.02 |
| Sm. int. | 0.42 | 0.08 | 0.46 | 0.16 | 0.28 | 0.08 | 0.23 | 0.05 |
| Lg. int. | 2.23 | 0.66 | 2.17 | 0.12 | 1.54 | 0.39 | 2.08 | 0.55 |
Mean of %ID/g (A) or %ID/organ (B) with standard deviation (SD); n=4
Sm. int. small intestine, Lg. int. large intestine
Fig. 5.

Cumulative percent accumulation (a) and absolute accumulation (b) in tumor and blood following multiple administrations, separated by 1 h, of 0.15 μg 99mTc-cMORF 48 h after administration of 30 μg MN14-MORF. Bars indicate one standard deviation. The dashed line in b represents the predicted absolute tumor accumulation of 99mTc-cMORF based on the 2.7 injections required for saturation (see text)
A tumor accumulation of antibody–MORF of 8.7 % ID/g at 48 h following an administration of 30 μg of antibody–MORF conjugated with 0.17 MORFs per molecule represents 17.3 ng of MORF per gram of tumor and if completely accessible, will be capable of binding 17.9 ng of cMORF per gram of tumor 8.7 %ID/g × 30μg ÷ MWantibody × gpm × MWcMORF = 17.9ng/g). From Fig. 5b, it may be assumed that the antibody–MORF in each gram of tumor becomes saturated with cMORF after 2.7 injections of 99mTc-cMORF. Table 3 shows that tumor accumulation of 99mTc-cMORF before this point is fairly constant, at about 4.4 %ID/g. This represents an absolute accumulation of 17.8 ng of cMORF per gram 0.15 μg × 4.4 %ID/g × 2.7 = 17.8ng g . Thus the agreement between the predicted maximum tumor accumulation of 99mTc-cMORF (17.9 ng/g) based on antibody levels and the experimentally observed value (17.8 ng/g) is gratifying and suggests that tumor MORF must be completely accessible to cMORF. Beyond this point, the antibody–MORF in tumor will be saturated by 99mTc-cMORF. The dashed line in Fig. 5b represents the predicted absolute tumor accumulation of 99mTc-cMORF based on the 2.7 injections required for saturation.
That saturation of the antibody–MORF in tumor did not occur even after the second injection of 99mTc-cMORF, when the dose of cMORF injected (300 ng) greatly exceeded the required dose of cMORF in tumor (17.8 ng/g), must be due to limitations in delivery to the tumor resulting from low and/or slow tumor perfusion and rapid blood clearance. Therefore, the 4.4 %ID/g value for tumor accumulation reflects the tumor delivery efficiency of 99mTc-cMORF. The delivery efficiency is a function of both the tumor model and the labeled effector.
Concerning blood, based on a 48 h 111In-MN14 blood level of 1.9 %ID/g taken from Fig. 3, blood saturation will require 4.0 ng of cMORF per gram of blood 1.9 %ID/g g × 30 μg ÷ MWantibody × gpm × MWcMORF = 4.0ng/g). This theoretical value is also in reasonable agreement with the absolute blood accumulations of cMORF of 2.6, 4.5, 3.9, and 4.5 ng/g (taken from Table 4 and converted), and these values confirm that antibody in circulation at this time was most probably saturated with radiolabeled cMORF.
Table 4.
Biodistribution of 99m Tc-cMORF in animals receiving 30 μg MN14-MORF 2, 3, or 4 days earlier, with sacrifice 3 h post injection of 0.30 μg of labeled cMORF
| 2-day interval
|
3-day interval
|
4-day interval
|
||||
|---|---|---|---|---|---|---|
| Organ | Mean | SD | Mean | SD | Mean | SD |
| (A) %ID/g | ||||||
| Liver | 0.60 | 0.05 | 0.54 | 0.03 | 0.37 | 0.02 |
| Heart | 0.30 | 0.07 | 0.22 | 0.03 | 0.14 | 0.02 |
| Kidney | 4.96 | 1.39 | 5.28 | 0.35 | 4.87 | 0.86 |
| Lung | 0.74 | 0.16 | 0.41 | 0.07 | 0.37 | 0.09 |
| Spleen | 0.33 | 0.06 | 0.29 | 0.05 | 0.22 | 0.04 |
| Muscle | 0.19 | 0.02 | 0.13 | 0.02 | 0.09 | 0.01 |
| Thyroid | 0.00 | 0.00 | 0.00 | 0.00 | 0.00 | 0.00 |
| Tumor | 3.09 | 0.27 | 3.27 | 0.47 | 2.12 | 0.46 |
| Blood | 1.27 | 0.17 | 0.93 | 0.08 | 0.58 | 0.13 |
| (B) %ID/organ | ||||||
| Stomach | 0.27 | 0.05 | 0.30 | 0.07 | 0.27 | 0.03 |
| Sm. int. | 0.40 | 0.12 | 0.49 | 0.12 | 0.32 | 0.04 |
| Lg. int. | 0.41 | 0.15 | 0.44 | 0.04 | 0.36 | 0.04 |
| Whole body | 18.9 | 1.4 | 14.7 | 0.4 | 13.0 | 2.1 |
Mean of %ID/g (A) or %ID/organ (B) with standard deviation (SD); n=4
Sm. int. small intestine, Lg. int. large intestine
Variable pretargeting intervals
While the pretargeting interval was varied primarily to examine the influence of this variable, the results also provided an opportunity to compare with predictions. Table 4 presents the biodistribution of 99mTc-cMORF with different pretargeting intervals and Table 5 presents the comparison between the experimental and calculated blood levels. As shown in the latter table, the calculated blood levels are in excellent agreement (within ±2 SD, probability level of 96%) with the observed values.
Table 5.
Comparison between experimental and theoretical blood levels (%ID/g) in pretargeting with 30 μg MN14-MORF and 0.30 μg labeled cMORF
| Blood level of labeled cMORF
|
|||
|---|---|---|---|
| Pretargeting interval | Blood level of MN14-MORFa | Theoreticalb | Experimental |
| 2 days | 1.94 | 1.38 | 1.27±0.17 |
| 3 days | 1.02 | 0.77 | 0.93±0.08 |
| 4 days | 0.53 | 0.44 | 0.58±0.13 |
Calculated from the antibody blood clearance curve
The theoretical blood level of labeled cMORF (%ID/g)=the blood level of antibody-MORF (%ID/g)×dose of antibody-MORF ÷ MWantibody×gmp×MWcMORF ÷ dose of labeled cMORF+background blood level of free labeled cMORF=the blood level of antibody-MORF (%ID/g)×30 μg÷160,000×0.17×6331÷0.30 μg+0.08. The 0.08 is from reference [18]
In tumor, the experimental values of 3.09±0.17, 3.27± 0.47, and 2.12±0.46 for intervals of 2, 3, and 4 days respectively are lower than the 4.4 %ID/g observed in the multiple injection study; this is most likely because of tumor size, which was larger at an average of 1.5 g compared to an average of 0.9 g when the multiple injection study was conducted. Tumor size is known to strongly influence tumor accumulations [24].
Whole-body anterior images of tumor-bearing mice obtained at the three different injection intervals are shown in Fig. 6. No obvious differences are apparent in images obtained at 2 and 3 day intervals; this was as expected, since the most prominent sites in the image are kidney and tumor, which change only slightly over this period. Moreover the difference in percent blood levels is too small to be evident. However, the lower tumor accumulation in the 4 day image is readily apparent.
Fig. 6.

Whole body images obtained simultaneously in three mice, each receiving 30 μg of MN14-MORF and, 2, 3, and 4 days later, 0.30 μg 99mTc-cMORF. Animals were imaged 3 h thereafter
Discussion
Whether conventional or pretargeting imaging is under consideration, optimization of the variables involved is necessary, which in turn requires that the influences of each variable be understood. Because of its complexity, optimization in the case of pretargeting approaches requires investigation of the pretargeting interval, doses of both the antibody and the effector, and detection time. Since one objective of tumor pretargeting is to optimize the accumulation of radioactivity in tumor, investigating these variables as they apply to tumor assumes a particular importance. In general, the pharmacokinetics of the antitumor antibody will determine the pretargeting interval since the most reasonable time for effector injection may be a point after the antibody accumulation in the tumor reaches a maximum. If, as in the case of MN14-MORF, the antibody is retained in tumor and is not internalized, the timing of the effector administration may be delayed until lower antibody concentrations in blood are reached, thereby achieving a lower, more favorable percent blood level. After the effector administration, the optimum detection time depends upon the clearance rate of the effector. Regarding doses, the effector should be administered at a dose just sufficient to saturate the antibody–MORF binding sites in the tumor. Too low an effector dose below this saturation point will provide less than optimum absolute tumor accumulation and therefore a more unfavorable tumor/ blood ratio. An effector dose in excess of that necessary to saturate the MORFs in tumor will still provide the maximum absolute tumor radioactivity level but will also provide lower percent tumor accumulation as the excess effector is cleared.
In a previous study from this laboratory, conclusions were reached on the basis of limited results that have now been shown to be incorrect [17]. In that investigation, the 99mTc-cMORF percent tumor accumulation was found to plateau with increasing dose of antibody–MORF after injection of about 20 μg, leading to the incorrect conclusion that this dose of antibody–MORF saturated the tumor CEA sites. However, we have now shown that the CEA tumor sites are not saturated by antibody–MORF following injections of at least 100 μg. It is now clear that the plateau in 99mTc-cMORF percent tumor accumulation when administered at any fixed dose is the result of delivery efficiency. The accumulation of antibody–MORF in tumor increases with increasing dose, but once the tumor concentration exceeds that needed by the fixed 99mTc-cMORF delivered into tumor, neither the percent nor the absolute tumor accumulation of 99mTc-cMORF can increase further.
By similar reasoning, we concluded previously that the accessibility of antibody–MORF in tumor to 99mTc-cMORF was only 50% [17]. This value is now known to be an underestimate since the targeting of antibody–MORF in tumor with 99mTc-cMORF is limited by delivery efficiency rather than by inaccessible MORF. Accessibility may now be estimated more accurately from the results presented in Fig. 5b showing that after 2.7 injections of 99mTc-MORF (the dose required to saturate the antibody–MORF in tumor) the experimental value for the 99mTc-MORF accumulation (solid line) is more than 90% of the theoretical maximum (dashed line) based on the number of antibody–MORFs present. Thus more than 90% of MORF in tumor can be targeted by labeled cMORF, indicating that the accessibility of MN14-MORF exceeds 90%.
A further interesting conclusion resulting from the recognition that tumor accumulation is limited by delivery efficiency is that while it may be considered intuitively obvious that increasing the average MORF (gpm) from the 0.17 used herein would improve percent tumor accumulation, increasing the gpm (or increasing the dose of MN14-MORF beyond 30 μg) can increase the absolute but not the percent tumor accumulation of 99mTc-cMORF. As long as the dose of labeled cMORF is less than that needed to saturate the MORFs in the tumor, a constant fraction of cMORF delivered to tumor will be retained and that fraction will depend on the tumor delivery efficiency, a parameter not influenced by MORF expression. Therefore the gpm value is immaterial with respect to percent tumor accumulation of 99mTc-cMORF.
The above discussion regarding tumor accumulation may be presented more definitively below:
The absolute tumor accumulation of 99mTc-cMORF can be expressed theoretically by the following equation:
where F is the cardiac output, f is the tumor blood input fraction, C is the concentration of free 99mTc-cMORF in blood, and E is the tumor trapping efficiency of labeled cMORF. The product F×f is the blood flow into the tumor and should be approximately constant for a given tumor model. As discussed above, before saturation of the antibody–MORF by 99mTc-cMORF in the tumor, the percent tumor accumulation of 99mTc-cMORF is a constant (i.e., 4.4 %ID/g, Fig. 5a). This implies that the trapping efficiency E is also a constant. However, beyond the saturation point where the antibody–MORF in the tumor is saturated by cMORF, the trapping efficiency of 99mTc-cMORF should be zero. Therefore, before tumor saturation of antibody–MORF by 99mTc-cMORF, the absolute tumor accumulation can be expressed as:
or
The term (%ID/g) blood is essentially the clearance curve of 99mTc-cMORF as shown in Fig. 4, so that the integration (i.e., the area under the curve) is a constant dependent only on the clearance properties of cMORF. Given that cardiac output F, tumor blood flow fraction f, and the integration term are all constants, tumor percent accumulation should also be a constant below the saturation point of MORF-MN14 in tumor by labeled cMORF since in this case E is also constant. Beyond this saturation point, E is zero, so that the tumor percent accumulation will then decrease.
Conclusion
The main goal of this investigation was to expand upon earlier studies directed towards understanding the relationship between pretargeting variables and tumor accumulation using as a model the anti-CEA antibody MN14 and a pair of MORF oligomers. We have determined that the CEA antigen sites in tumor were not saturated with the anti-CEA MN14-MORF antibody at any dose used and that at least 90% of the MORF in tumor could be targeted with 99mTc-cMORF administered intravenously. The results illustrate the influence of tumor delivery efficiency of the effector and MORF expression of the antibody in tumor in determining the tumor accumulation of radioactivity.
Acknowledgments
The authors are grateful to Dr. Gary L. Griffiths of Immunomedics (Morris Plains, NJ) for providing the MN14. We also thank Loretta Lee of the UMMS Tissue Culture Center for maintaining the LS174T tumor cells. Financial support for this investigation was provided in part by the National Institutes of Health (CA79507, CA94994, and CA107360).
References
- 1.Goldenberg DM. Advancing role of radiolabeled antibodies in the therapy of cancer. Cancer Immunol Immunother. 2003;52:281–96. doi: 10.1007/s00262-002-0348-5. [DOI] [PMC free article] [PubMed] [Google Scholar]
- 2.Boerman OC, van Schaijk FG, Oyen WJ, Corstens FH. Pre-targeted radioimmunotherapy of cancer: progress step by step. J Nucl Med. 2003;44:400–11. [PubMed] [Google Scholar]
- 3.Goldenberg DM, Chang CH, Sharkey RM, Rossi EA, Karacay H, McBride W, et al. Radioimmunotherapy: is avidin-biotin pretargeting the preferred choice among pretargeting methods? Eur J Nucl Med Mol Imaging. 2003;30:777–80. doi: 10.1007/s00259-002-1089-6. [DOI] [PubMed] [Google Scholar]
- 4.Paganelli G, Chinol M. Radioimmunotherapy: is avidin-biotin pretargeting the preferred choice among pretargeting methods? Eur J Nucl Med Mol Imaging. 2003;30:773–6. doi: 10.1007/s00259-002-1090-0. [DOI] [PubMed] [Google Scholar]
- 5.Kraeber-Bodere F, Faivre-Chauvet A, Ferrer L, Vuillez JP, Brard PY, Rousseau C, et al. Pharmacokinetics and dosimetry studies for optimization of anti-carcinoembryonic antigenxanti-hapten bispecific antibody-mediated pretargeting of iodine-131-labeled hapten in a phase I radioimmunotherapy trial. Clin Cancer Res. 2003;9:3973S–81S. [PubMed] [Google Scholar]
- 6.Sharkey RM, Karacay H, Richel H, McBride WJ, Rossi EA, Chang K, et al. Optimizing bispecific antibody pretargeting for use in radioimmunotherapy. Clin Cancer Res. 2003;9:3897S–913S. [PubMed] [Google Scholar]
- 7.Rossi EA, Sharkey RM, McBride W, Karacay H, Zeng L, Hansen HJ, et al. Development of new multivalent-bispecific agents for pretargeting tumor localization and therapy. Clin Cancer Res. 2003;9:3886S–96S. [PubMed] [Google Scholar]
- 8.van Schaijk FG, Oosterwijk E, Soede AC, Oyen WJ, McBride WJ, Griffiths GL, et al. Pretargeting with labeled bivalent peptides allowing the use of four radionuclides: 111In, 131I, 99mTc, and 188Re. Clin Cancer Res. 2003;9:3880S–5S. [PubMed] [Google Scholar]
- 9.Sharkey RM, McBride WJ, Karacay H, Chang K, Griffiths GL, Hansen HJ, et al. A universal pretargeting system for cancer detection and therapy using bispecific antibody. Cancer Res. 2003;63:354–63. [PubMed] [Google Scholar]
- 10.Lindegren S, Karlsson B, Jacobsson L, Andersson H, Hultborn R, Skarnemark G. 211At-labeled and biotinylated effector molecules for pretargeted radioimmunotherapy using poly-L and poly-D-lysine as multicarriers. Clin Cancer Res. 2003;9:3873S–9S. [PubMed] [Google Scholar]
- 11.Lewis MR, Wang M, Axworthy DB, Theodore LJ, Mallet RW, Fritzberg AR, et al. In vivo evaluation of pretargeted 64Cu for tumor imaging and therapy. J Nucl Med. 2003;44:1284–92. [PubMed] [Google Scholar]
- 12.Pavlinkova G, Batra SK, Colcher D, Booth BJ, Baranowska-Kortylewicz J. Constructs of biotin mimetic peptide with CC49 single-chain Fv designed for tumor pretargeting. Peptides. 2003;24:353–62. doi: 10.1016/s0196-9781(03)00049-4. [DOI] [PubMed] [Google Scholar]
- 13.Hytonen VP, Laitinen OH, Grapputo A, Kettunen A, Savolainen J, Kalkkinen N, et al. Characterization of poultry egg-white avidins and their potential as a tool in pretargeting cancer treatment. Biochem J. 2003;372:219–25. doi: 10.1042/BJ20021531. [DOI] [PMC free article] [PubMed] [Google Scholar]
- 14.Pagel JM, Hedin N, Subbiah K, Meyer D, Mallet R, Axworthy D, et al. Comparison of anti-CD20 and anti-CD45 antibodies for conventional and pretargeted radioimmunotherapy of B-cell lymphomas. Blood. 2003;101:2340–8. doi: 10.1182/blood-2002-03-0874. [DOI] [PubMed] [Google Scholar]
- 15.Subbiah K, Hamlin DK, Pagel JM, Wilbur DS, Meyer DL, Axworthy DB, et al. Comparison of immunoscintigraphy, efficacy, and toxicity of conventional and pretargeted radioimmunotherapy in CD20-expressing human lymphoma xenografts. J Nucl Med. 2003;44:437–45. [PubMed] [Google Scholar]
- 16.Liu G, Mang′era K, Liu N, Gupta S, Rusckowski M, Hnatowich DJ. Tumor pretargeting in mice using 99mTc-labeled morpholino, a DNA analog. J Nucl Med. 2002;43:384–91. [PubMed] [Google Scholar]
- 17.Liu G, Liu C, Zhang S, He J, Liu N, Gupta S, et al. Investigations of 99mTc morpholino pretargeting in mice. Nucl Med Commun. 2003;24:697–705. doi: 10.1097/00006231-200306000-00013. [DOI] [PubMed] [Google Scholar]
- 18.Liu G, He J, Dou S, Gupta S, Vanderheyden JL, Rusckowski M, et al. Pretargeting in tumored mice with radiolabeled morpholino oligomer showing low kidney uptake. Eur J Nucl Med Mol Imaging. 2004;31:417–24. doi: 10.1007/s00259-003-1393-9. [DOI] [PubMed] [Google Scholar]
- 19.Liu G, Zhang S, He J, Liu N, Gupta S, Rusckowski M, et al. The influence of chain length and base sequence on the pharmacokinetic behavior of 99mTc-morpholinos in mice. Q J Nucl Med. 2002;46:233–43. [PubMed] [Google Scholar]
- 20.Liu G, He J, Zhang S, Liu C, Rusckowski M, Hnatowich DJ. Cytosine residues influence kidney accumulations of 99mTc-labeled morpholino oligomers. Antisense Nucleic Acid Drug Dev. 2002;12:393–8. doi: 10.1089/108729002321082465. [DOI] [PubMed] [Google Scholar]
- 21.Winnard P, Jr, Chang F, Rusckowski M, Mardirossian G, Hnatowich DJ. Preparation and use of NHS-MAG3 for technetium-99m labeling of DNA. Nucl Med Biol. 1997;24:425–32. doi: 10.1016/s0969-8051(97)00027-9. [DOI] [PubMed] [Google Scholar]
- 22.Hnatowich DJ, Layne WW, Childs RL, Lanteigne D, Davis MA, Griffin TW, et al. Radioactive labeling of antibody: a simple and efficient method. Science. 1983;220:613–5. doi: 10.1126/science.6836304. [DOI] [PubMed] [Google Scholar]
- 23.Liu G, Zhang S, He J, Zhu Z, Rusckowski M, Hnatowich DJ. Improving the labeling of S-acetyl NHS-MAG3 conjugated morpholino oligomers. Bioconjug Chem. 2002;13:893–7. doi: 10.1021/bc0255384. [DOI] [PubMed] [Google Scholar]
- 24.Goldenberg DM. Current status of cancer imaging with radiolabeled antibodies. J Cancer Res Clin Oncol. 1987;113:203–8. doi: 10.1007/BF00396374. [DOI] [PMC free article] [PubMed] [Google Scholar]