

Abstract
In order to fold non-native proteins, chaperonin GroEL undergoes numerous conformational changes and GroES binding in the ATP-dependent reaction cycle. We constructed the real-time three-dimensional-observation system at high resolution using a newly developed fast-scanning atomic force microscope. Using this system, we visualized the GroES binding to and dissociation from individual GroEL with a lifetime of 6 s (k=0.17 s−1). We also caught ATP/ADP-induced open–closed conformational changes of individual GroEL in the absence of qGroES and substrate proteins. Namely, the ATP/ADP-bound GroEL can change its conformation ‘from closed to open' without additional ATP hydrolysis. Furthermore, the lifetime of open conformation in the presence of ADP (∼1.0 s) was apparently lower than those of ATP and ATP-analogs (2–3 s), meaning that ADP-bound open-form is structurally less stable than ATP-bound open-form. These results indicate that GroEL has at least two distinct open-conformations in the presence of nucleotide; ATP-bound prehydrolysis open-form and ADP-bound open-form, and the ATP hydrolysis in open-form destabilizes its open-conformation and induces the ‘from open to closed' conformational change of GroEL.
Keywords: atomic force microscopy, chaperonin, two-dimensional protein crystal
Introduction
The atomic force microscopy (AFM) (Binnig et al, 1986; Hansma et al, 1988) is increasingly being used for studying biomolecules at the single molecule level. In particular, the AFM has been used to measure both structural and mechanical properties of individual DNA and proteins in physiologically relevant buffers (Oberhauser et al, 1999; Allison et al, 2002; Fotiadis et al, 2002; Sekiguchi et al, 2003; Yang et al, 2003). However, such investigations have been restricted by the inherent slow scan speed of AFM necessary for the nano-scale resolution. The scanning rates of commercially available AFMs are usually several seconds to minutes per frame, and therefore insufficient to monitor many physiological processes in cells that occur at much faster rates. Recently, this limitation has been challenged by using fast-scanning AFM (Viani et al, 2000; Ando et al, 2001), which can capture images in the subseconds order. In this work, we used a newly developed fast-scanning AFM to observe the behavior of individual GroEL at the single molecule level, and demonstrated the ability of fast-scanning AFM to analyze the millisecond-order reaction at nanometer resolution.
Many newly synthesized proteins and denatured proteins in cells must undergo a series of folding processes to achieve their proper three-dimensional (3D) structures to become functionally active (Hightower, 1991; Bukau and Horwich, 1998; Hartl and Hayer-Hartl, 2002). The efficient folding of most proteins requires the assistance from molecular chaperones that prevent protein misfolding and aggregation in the crowded environment in the cells. One of the best-characterized chaperone systems is the Escherichia coli chaperonin GroEL–GroES system (Bukau and Horwich, 1998; Ranson et al, 1998; Grallert and Buchner, 2001). The detailed 3D structures of GroEL, GroES and the GroEL/ADP/GroES complex were resolved by X-ray crystallography (Braig et al, 1994; Hunt et al, 1996; Mande et al, 1996; Xu et al, 1997; Chaudhry et al, 2003) and electron microscopy (Chen et al, 1994; Schmidt et al, 1994; Ranson et al, 2006) (Figure 1). GroEL consists of two homo-heptameric rings that are stacked back-to-back, whereas GroES is a single homo-heptameric ring. The chaperonin reaction cycle begins with the binding of a polypeptide (unfolded protein) and GroES to one side of GroEL, which results in a formation of the GroEL/polypeptide/GroES complex in the presence of nucleotides. Once the GroEL/polypeptide/GroES complex is formed, the polypeptide chain is refolded toward its functional conformation in a large central cavity in the GroEL ring (in cis-conformation). Then, the GroEL/GroES complex decays with a lifetime of 8–15 s by the dissociation of GroES, followed by a release of the trapped protein from the cavity (Burston et al, 1995; Weissman et al, 1996; Rye et al, 1997, 1999). This final step, GroES dissociation, was triggered by the binding of ATP to the opposite ring (in trans-conformation) (Burston et al, 1995; Hayer-Hartl et al, 1995; Rye et al, 1997).
Figure 1.
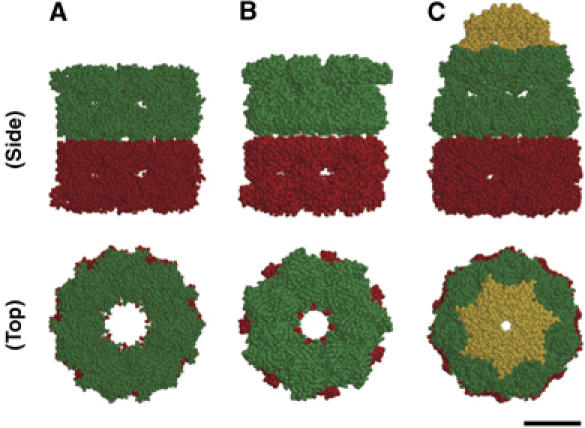
3D structure of GroEL, GroEL–ATP complex and GroEL–GroES–ADP complex. (A) The crystal structure of GroEL (Braig et al, 1994); pdb 1GRL. (B) The cryo-EM map of GroEL(D398A)–ATP complex (Ranson et al, 2001); pdb 2C7E. (C) The crystal structure of GroEL–GroES–ADP complex (Xu et al, 1997); pdb 1AON. The side views (Upper) and the top views (Lower) of Van der Waals space-filled models highlighting the individual ring structures of GroEL (lower GroEL ring, red; upper GroEL ring, green) and GroES (yellow), are shown. Scale bar represents 5.0 nm. Figures were generated using RasMol (http://www.umass.edu/microbio/rasmol/).
It is clear that ATP and GroES bindings play essential roles in chaperonin functions, but the details and the mechanisms of the ATP-dependent reaction cycle of GroEL–GroES system are still unclear although a number of reaction models, such as a two-timer model (Taguchi et al, 2001; Ueno et al, 2004) and a single-timer model (Rye et al, 1999), have been proposed. Especially, the structural consequences of ATP/ADP binding to GroEL remain poorly understood. To understand their structure and functional arrangement in 3Ds in physiological conditions, AFM observation has been useful (Radmacher et al, 1994; Thomson et al, 1996; Viani et al, 2000; Schiener et al, 2005). In this study, we used the prototype fast-scanning AFM, which is >100 times faster than conventional AFM, and constructed a real-time, single-molecule observation system to analyze molecular 3D-structures and dynamics (kinetics) at the same time. This technique allows us to visualize and analyze the association and dissociation reaction of individual GroEL–GroES complex in the presence of ATP, and the ATP/ADP dependent conformational changes of GroEL without GroES at the single molecule level in real time.
Results
Imaging GroEL in solution
In order to detect the reactions and conformational changes of individual GroEL at the single molecule level in real time, the key techniques were the preparation of a flat and stable 2D GroEL crystal layer and the 3D observation by our fast-scanning AFM. GroEL was directly immobilized on a mica surface through electrostatics force without any modification of the GroEL molecule such as replacement of amino-acid sequence, fluorescent labeling or chemical treatments. This immobilization force was relatively loose, so that it would allow movements and flexible conformational changes of GroEL molecules on the mica surface.
Fast-scanning AFM demonstrated that GroEL was highly packed and aligned (an end-up orientation), forming a layer structure on the mica surface (two-dimensional (2D) protein crystal) in our experimental condition (Figure 2A). In this figure, the central channel of GroEL ring could be resolved. The diameters of the GroEL ring and the central channel measured from these images were 15.4±1.9 and 4.7±1.1 nm, respectively, in good agreement with previous AFM (Mou et al, 1996), EM (Chen et al, 1994) and X-ray crystallography (Braig et al, 1994) data (Figure 1A, top view), which show that the outer and inner diameters of GroEL are about 14.0 and 4.5 nm, respectively. Figure 2B shows the mechanically bisected GroEL layer. The height difference between the normal GroEL and the half GroEL was about 7.0 nm, precisely the same as a single heptameric ring of GroEL in trans based on X-ray crystallography (Braig et al, 1994). The surface of GroEL layer that is composed by GroEL 14-mers was basically flat in the absence of nucleotide. To quantify and compare the surface roughness in each image, we measured the root mean square (RMS) value of each image. In this case, RMS value was 0.60±0.02 nm (mean±s.d.).
Figure 2.
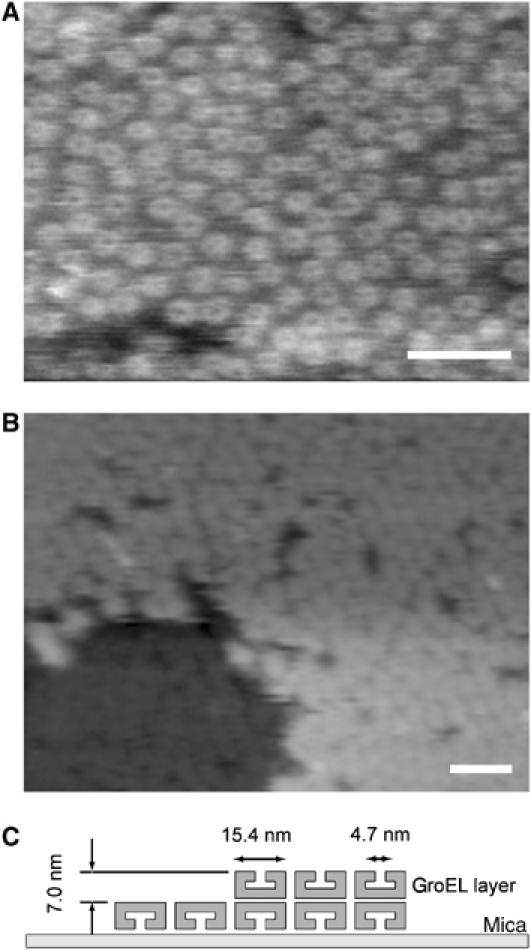
Topographic high-resolution image of GroEL by the fast-scanning AFM. The GroEL molecules were lightly absorbed on a mica surface in buffer solution. (A) This is an image of a series of fast-scanning AFM images. In this image, the central channels of the GroEL molecules are visible. The image (240 × 180 nm2, 192 × 144 pixels) was taken with a scan rate of 2 frames/s. Scale bar represents 50 nm. (B) In the lower left area of the image, the upper-heptameric ring of GroEL was removed, which had been scanned with higher tapping force (see Materials and methods for details). The height difference between the normal GroEL and the half GroEL is about 7.0 nm, in good agreement with the height of a single ring of GroEL (Braig et al, 1994). Scan size 400 × 300 nm2, 192 × 144 pixels. Scale bar represents 50 nm. The Z-scale is 20 nm. (C) Illustration of sample geometry.
Our fast scanning AFM observation also demonstrated that when the density of the GroEL molecules on a mica surface is low and does not form a complete 2D protein layer, GroEL could randomly diffuse on the mica surface with the averaged 2D diffusion coefficient of 2.2±1.5 nm2/s (mean±s.d.). Namely, GroEL molecules frequently get out of and come in the scanning position (line) during the 1D (2D) observation by AFM (Thomson et al, 1996; Viani et al, 2000). This means that the previously demonstrated 1D or 2D observation techniques, which have much higher time resolution than the 3D-observation technique, are not suitable for a long-term (a few seconds) observation. Therefore, in this study, we utilized both 2D observation for short-time (<1 s) observations and 3D observation for long-term observations (several seconds).
ATP/ADP mediated open–closed transition of GroEL
To investigate the structural influence of nucleotides, a series of AFM images in Figure 3 (see Supplementary Movie 1) are taken in a buffer solution containing 50 μM ADP without GroES. In this experiment, the ATP contamination in ADP solution was removed by hexokinase (Motojima and Yoshida, 2003) to less than 0.1 nM in 50 μM ADP solution. Under these conditions, we observed some taller features (white spots in the figure) on GroEL layer (RMS value is 0.78±0.03 nm in the presence of 50 μM ADP). The most straightforward interpretation of our results is that the height fluctuation corresponds to the conformational change of GroEL during nucleotide binding to GroEL. These taller GroELs were 0.9±0.2 nm taller than the surrounding GroELs (Figure 4A). This elongation value is very similar to the height difference between the cis-ring and trans-ring conformations of GroEL estimated from 3D-model of the GroEL/ADP/GroES complex (Xu et al, 1997), and agrees well with cryo-EM studies (Roseman et al, 1996; Ranson et al, 2001). This height difference was also observed in the presence of ATP and nonhydrolysable ATP analogs (ATPγS, AMP-PNP and ADP+AlFx), but not observed in the absence of nucleotide (data not shown). Therefore, we concluded that, in the presence of nucleotides, GroEL molecules had at least two different conformations, one is open (elevated) conformation and another is closed (compact) conformation.
Figure 3.
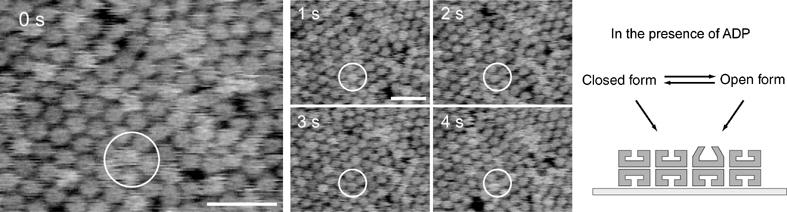
Single-molecule imaging of chaperonin GroEL dynamics in the presence of ADP. Time-lapse sequential AFM images of GroEL in a buffer solution on mica surface were taken in the presence of 50 μM ADP alone with 192 × 144 pixels at a rate of 1 frame per second. Scale bars represent 50 nm. The Z-scale is 7.5 nm. In the AFM images, taller structure can be seen as the bright (white) features. As identified in the open white circle at 0 s, a 1 nm taller structure of GroEL (open conformation) than surrounding GroEL layer (closed conformation) had turned into closed conformation. Open–closed conformational changes of GroEL were repeatedly observed. To remove the effect of ATP contamination in ADP solution, we used hexokinase and reduced ATP concentration less than 0.1 nM in 50 μM ADP solution.
Figure 4.
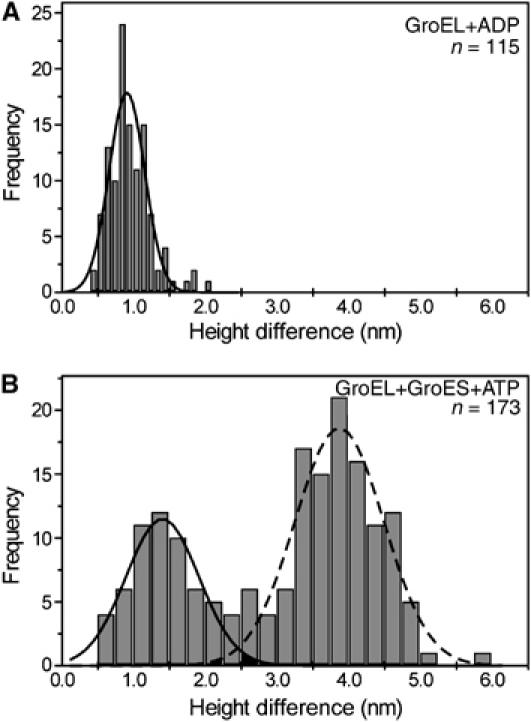
Histograms of the height differences between the top of the taller structure of GroEL and top of the surrounding GroEL layer. Statistical section analyses of GroEL were performed using the data in the presence of (A) 100 μM ADP and (B) 2 μM ATP and 25 nM GroES. The lines are Gaussian fits of the height difference date for open-conformations of GroEL (solid line) and GroEL–GroES complex (broken line).
In order to monitor the conformational changes of GroEL with higher time resolution, we used 2D-observation method (Viani et al, 2000), in which a single line was repeatedly scanned at a rate of 250–1000 Hz. This approach clearly demonstrated that both of the ‘closed to open' and the ‘open to closed' conformational changes were observed as 1 nm height difference, and completed within at least 10 ms in most GroEL molecules (more than 95%) (Figure 5). After this rapid ‘closed to open' conformational change, GroEL kept an open conformation for a few seconds. These properties of the open–closed conformational changes were also observed in the presence of ADP, ATP and ATP analogs.
Figure 5.
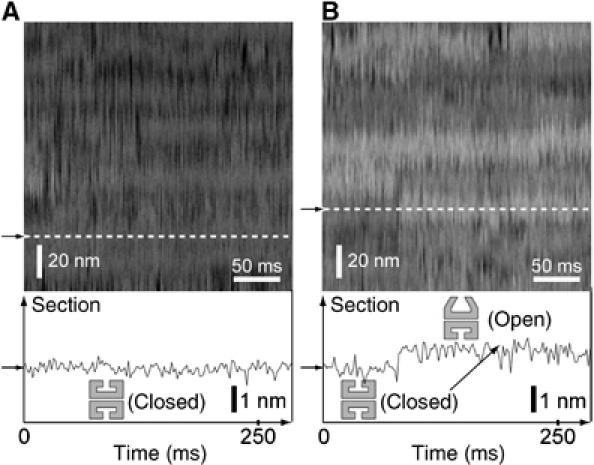
Single-line-scan AFM imaging of chaperonin GroEL dynamics. Single-line-scan (2D observation) AFM images of GroEL in the buffer A on mica surface were taken in the absence (A) and presence of 50 μM ADP (B). (Scanning rate of 500 Hz, scan scale (Y-axis direction) of 162 nm and Z scale of 10.0 nm) In these AFM images, individual GroEL molecules can be seen as tube features (Viani et al, 2000). Lower panels indicate the X-axis cross-sections positioned at the white dotted lines indicated by the arrows in the AFM images, which represent typical height fluctuations under the conditions. One nanometer taller structures (open-conformations) of GroEL and height fluctuations can be seen as the bright (white) and long tube features in the presence of ADP (B), but not in the absence of nucleotide (A). These open–closed conformational changes of GroEL were repeatedly observed. Both the ‘closed to open' and the ‘open to closed' conformational changes in this image were completed within 5–10 ms. After this rapid ‘closed to open' conformational change, GroEL kept an open conformation for a long time.
We then examined the nucleotide concentration dependency of the GroEL conformational change (Figure 6). The ratio of the GroEL molecules in the ‘open' conformation was counted in the presence of various concentrations (0–1000 μM) of nucleotides, and the data were fitted with the Hill equation. The Hill constants (nH) and K1/2 values are summarized in Figure 6A (inset). The K1/2 values of ATP and ATPγS are very similar (6–8 μM), whereas that of ADP is much higher (∼80 μM). At high concentrations of nucleotide, no more than 75% of GroEL had the open-form in our experiments (Figure 6A). Although we used purified proteins, a trace amount of the contamination of endogenous substrate protein could be contained and inhibit the conformational changes of some of GroEL molecules (up to 25%) in our experimental condition. Such decrement in the percentage of the open-form GroEL by contamination of substrate proteins has been previously demonstrated by biochemical experiments (Jackson et al, 1993).
Figure 6.
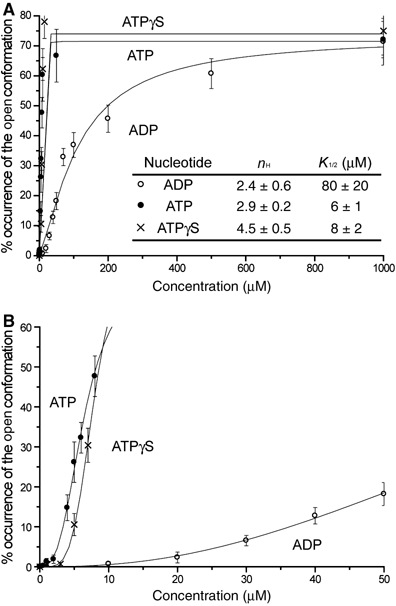
Occurrence frequency of the open-conformation of GroEL with increasing ATP/ADP/ATPγS concentration. Plot (A) shows the per cent occurrence of the open-form GroEL with increasing concentrations in the range of 0–1000 μM of ATP, ADP or ATPγS. (B) The same data in the range of 0–50 μM of ATP, ADP or ATPγS. The solid line in each case shows the optimal fitting curve of the data to the Hill equation. The parameters K1/2 and Hill constant (nH) are summarized in the inset table in (A).
The lifetimes of the open conformation (open time) and closed conformation (closed time) were measured in the time-lapse 3D AFM images. The histograms of both open- and closed time in the presence of ADP, ATP or ATP analogs showed single exponential decays (Figure 7), indicating that the ‘open to closed' and ‘closed to open' conformational changes of GroEL in the presence of nucleotides were stochastic processes, which did not require ATP hydrolysis. The histograms were fitted to a single-exponential model to obtain the rate constant of the nucleotide-induced conformational change; F(t)=C1 k1 exp(−k1t), where F(t) is the number of open form (or closed form) that had an open (or closed) time t, C1 is the number of the total events and k1 is the rate constant (kopen → closed and kclosed → open). The obtained rate constants at various concentrations of nucleotides are summarized in Table I. At the low concentration of nucleotide, the rate constant of the open to closed conformational change did not depend on the nucleotide concentration, whereas that of the closed to open conformational change varied depending on the concentrations of ADP, ATP or ATPγS. This result indicates that the % occurrence of the open-form GroEL is strongly dominated by the rate constant of the ‘closed to open' conformational change. Therefore, the result in Figure 6 indicates that the ‘from closed to open' conformational change is a cooperative process for consumption of nucleotides.
Figure 7.
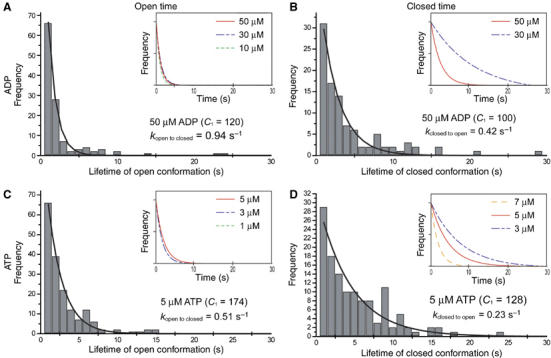
Statistical analysis of conformational changes of GroEL in the presence of nucleotides. Histograms in (A) and (C) show the typical distributions of the lifetime of open-conformation of GroEL in the presence of 50 μM ADP and 5 μM ATP, respectively. Histograms in (B) and (D) show the typical distributions of the lifetime of closed-conformation of GroEL in the presence of 50 μM ADP and 5 μM ATP, respectively. Some GroELs that do not undergo conformational changes at all over the period of observation were excluded from the analyses. The histograms were fitted with a single–exponential function as the following equation: F(t)=C1k1 exp(−k1t), where F(t) is the number of open-form (or closed-form) GroEL that had an on (or off) time t, C1 is the number of the total events and k1 is the rate constant. The rate constants (k1) were obtained by the nonlinear least-squares curve fitting method. The same analyses were performed in the presence of different concentrations of nucleotides. The obtained fitted curves were summarized in the inset figures. The obtained rate constants in each nucleotide condition are averaged and summarized in Table I.
Table 1.
Rate constants of ‘open to closed' and ‘closed to open' conformational changes of GroEL with increasing nucleotide concentration
| Nucleotide | Concentration (μM) | kopen → closed (s−1, mean±s.d.) | kclosed → open (s−1, mean±s.d.) | Open conformation (%, mean±s.d.) |
|---|---|---|---|---|
| ADP | 10 | 1.05±0.20 | <0.1 | 1±1 |
| 30 | 1.11±0.25 | 0.10±0.03 | 7±1 | |
| 50 | 0.96±0.08 | 0.42±0.02 | 18±3 | |
| ATP | 1 | 0.71±0.21 | <0.1 | 1±1 |
| 3 | 0.68±0.06 | 0.12±0.05 | 14±1 | |
| 5 | 0.52±0.06 | 0.37±0.23 | 31±6 | |
| 7 | — | 0.63±0.16 | 40±9 | |
| ATPγS | 3 | 0.45±0.12 | <0.1 | 1±0 |
| 5 | 0.41±0.06 | <0.1 | 11±3 | |
| 7 | 0.30±0.05 | 0.26±0.08 | 30±4 | |
| ADP+AlFx | 50 | 0.52±0.02 | 0.35±0.04 | 19±4 |
| AMP-PNP | 400 | 0.34±0.02 | 0.12±0.02 | 32±4 |
| The values of the rate constants are the mean±s.d. of 3–5 independent experiments. | ||||
Dynamics of the GroEL–GroES interactions with ADP/ATP
An addition of GroES to the imaging solution without nucleotide did not cause any apparent changes in the surface feature of the GroEL layer (RMS value is 0.58±0.03 nm), which is consistent with the previous experiments (Chandrasekhar et al, 1986). On the other hand, in the presence of 2 μM ATP and 500 nM GroES, much taller features than the open conformation of GroEL were occasionally observed (RMS value of 1.10±0.08 nm) (Figure 8A). The histogram of the height difference from the surface of the GroEL layer (Figure 4B) has two peaks near 3.9±0.6 and 1.3±0.5 nm. The mean value of the taller one (3.9±0.6 nm) well corresponds with the height difference between the GroEL/ADP/GroES complex (Xu et al, 1997) and GroEL (Braig et al, 1994), and the shorter one (1.3±0.5 nm) corresponds to the height difference between the open- and the closed conformations. In the series of AFM images shown in Figure 8A (see Supplementary Movie 2), GroES molecules repeatedly associated with and dissociated from GroEL. Immediately after the dissociation of GroES, GroEL was found to be in either open (10% of the total) or closed (90% of the total) conformation, suggesting that GroEL switches back to the closed conformation immediately (within 1 s) after the dissociation from GroES (Figure 9).
Figure 8.
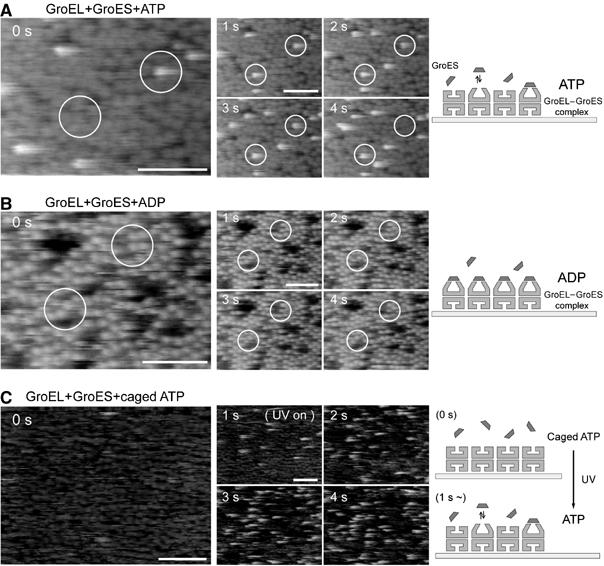
Single-molecule imaging of chaperonin GroEL–GroES dynamics in the presence of nucleotides. Time-lapse sequence AFM images of GroEL on mica surface in a buffer solution were taken in the presence of (A) 2 μM ATP and 500 nM GroES, (B) 20 μM ADP and 25 nM GroES or (C) 10 μM Caged ATP and 25 nM GroES with 192 × 144 pixels at a rate of 1 frames pre second. Scale bars represent 100 nm. The Z-scale is 10 nm. (A) GroES molecules were repeatedly found to bind to and dissociate from GroEL. ATP concentration was kept low (unsaturated condition) in order to observe and analyze single molecule events. In the AFM images at 0 s, for example, a 4 nm taller structure (GroEL–GroES complex) can be seen in the right open white circle. (B) In the presence of ADP, extremely stable association of GroES with GroEL (GroEL–ADP–GroES complex) was achieved. Same results were observed with the wide range of concentration (25–500 nM). This result indicates that tip-sample interaction in our experiments is basically week enough to keep the GroEL–ADP–GroES complex stable. (C) After UV illumination at time 1 s, GroES quickly began to associate to and dissociate from individual GroEL with the generation of ATP.
Figure 9.
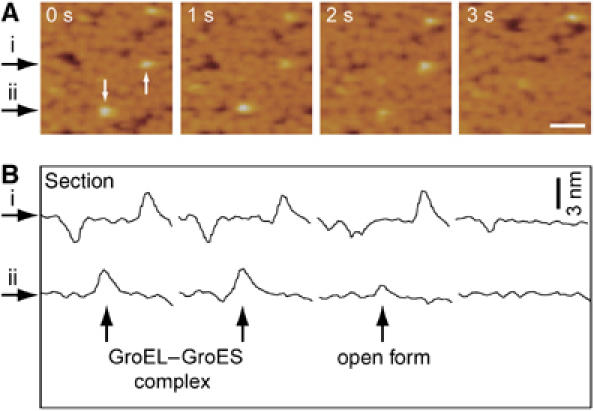
Single-molecule imaging of GroES dissociation from GroEL in the presence of ATP. (A) Time-lapse sequence AFM images of GroEL on mica surface in a buffer solution were taken in the presence of 2 μM ATP and 500 nM GroES at a rate of 1 frames per second. Scale bars represent 50 nm. Time 0 was set at the top of the first scan. Initially, some GroEL–GroES complex can be seen as white spots (white arrows, at time 0). Then, the GroES molecules were dissociated from GroEL during the observation (1–2 s for the lower complex and 2–3 s for the upper complex). In the case of the lower one, after GroES dissociation, open conformation was observed. (B) Time-lapse sequence cross-sections positioned by the black arrows (i, ii).
The duration time of GroES-unbound form of GroEL in the presence of a certain concentration of GroES (25 nM) and ATP (100 μM) (‘off time') was measured (Figure 10A). The histogram of the ‘off-time' was well fitted to a single exponential curve, indicating that the GroES binding was also a stochastic process. The association rate constant of GroES to GroEL (kon) (2.3 × 10⁷ M−1 s−1) was calculated by curve fitting, which is half of the value measured by the previous bulk-phase experiments (4.6 × 10⁷ M−1 s−1) (Rye et al, 1999; Taguchi et al, 2001; Taniguchi et al, 2004). This is reasonable because one side of GroEL ring is inaccessible to GroES in our experimental condition. Thus, the semiimmobilized GroEL sample does not lose the activity for GroES binding and the effect of probe scanning to the GroES binding reaction is low enough to be ignored.
Figure 10.
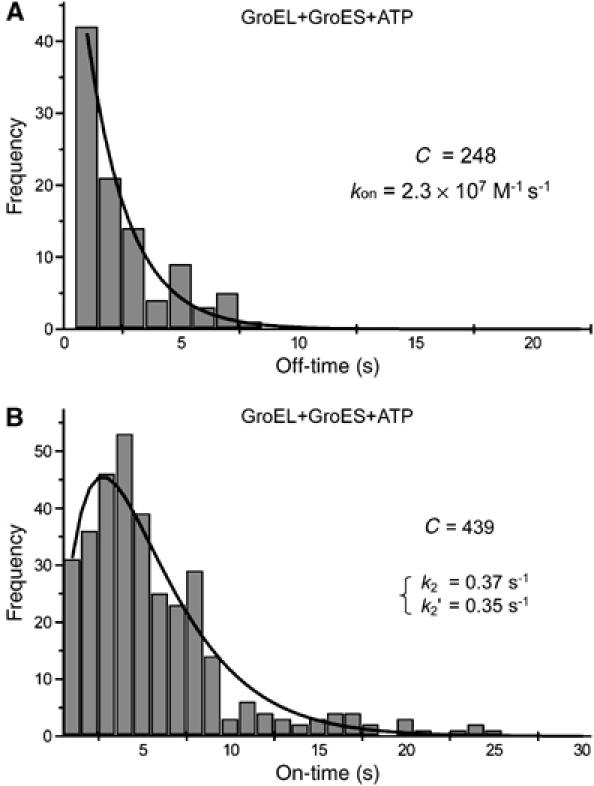
Statistical analyses of GroES binding and dissociation events of GroEL in the presence of ATP. Histogram in (A) shows the distribution of the duration time between the GroES dissociation from and the next GroES binding to individual GroEL molecule in the presence of 25 nM GroES and 100 μM ATP. Some GroELs that do not undergo conformational changes at all over the period of observation in the presence of ATP was excluded from the analyses. The histogram was fitted with a single-exponential function as the following equation: H(t)=C3k3 exp(−k3t), where H(t) is the number of GroEL that had an off time t, C3 is the number of the total events and k3 is the rate constant. The rate constant (k3) was obtained by the nonlinear least-squares curve fitting method. Then, the association rate constant for GroES binding (kon) was calculated. Histogram in (B) shows the distribution of the lifetime of GroEL–GroES complex. Individual GroES molecules that attached to and dissociated from GroEL molecules repeatedly were used for the analyses over the observation time of ∼10 min. The solid line was obtained by the least-square fitting to the equation: C1k2k2′[exp(−k2t)−exp(−k2′t)]/(k2−k2′) derived from the two-step reaction of scheme (1).
The duration time of GroES-bound GroEL (‘on time') in the presence of 500 nM GroES and 2 μM ATP was measured and are summarized in Figure 10B. This histogram has a maximum peak at 4 s (the average lifetime is 6 s) and does not show a single exponential decay, indicating that the dissociation reaction of GroES from GroEL is probably not governed by a single rate-determining step, rather obeys two sequential transitions (two timer model), as previously proposed by Taguchi et al (2001) and Ueno et al (2004).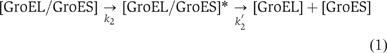
The histogram data were well fitted to the equation deduced from scheme (1): G(t)=C2k2k2′[exp(−k2t)−exp(−k2′t)]/(k2′−k2), where G(t) is the number of GroEL/GroES complex that had a lifetime t, k2=0.37 s−1, k2′=0.35 s−1 and C2=295 (the number of the total events). We also analyzed the ATP concentration dependency on GroES-retained time (Table II). The time constants of the lifetimes of two independent states were 3 and 2–3 s, respectively, and the sum was 5–6 s, which well agrees with the previous value (7–15 s) estimated in bulk-phase kinetics (Burston et al, 1995; Weissman et al, 1996; Rye et al, 1997, 1999; Taguchi et al, 2001).
Table 2.
Rate constants of GroES dissociation with increasing ATP concentration
| ATP concentration (μM) | k2 (s−1) | k2′ (s−1) |
|---|---|---|
| 2 | 0.37 | 0.35 |
| 20 | 0.42 | 0.48 |
| 100 | 0.39 | 0.47 |
Caged ATP was employed in order to directly detect the ATP-induced GroEL association with GroES. The fast-scanning imaging of GroEL layer was performed in the solution containing 10 μM caged ATP and GroES. At a certain time point during the imaging, ultraviolet (UV) light was irradiated to the specimen and the observation was continued. The shutter of the UV light remained open for about 5 s, which was enough to generate 2 μM or more ATP from 10 μM caged ATP. After the irradiation, GroES quickly began to associate to and dissociate from GroEL with the ‘on time' of 6–7 s (Figure 8C) (see Supplementary Movie 3).
In the presence of 20 μM ADP, the extremely stable association of GroEL with GroES (GroEL/ADP/GroES complex) was observed (Figure 8B). In the presence of ADP, the lifetime of GroEL/ADP/GroES complex was so long that we hardly observe the GroES dissociation from GroEL within the time of observation (the average lifetime is more than 1 min), as predicted by the previous biochemical experiments (Todd et al, 1994; Hayer-Hartl et al, 1995; Motojima and Yoshida, 2003).
Discussion
A significant feature of our real-time 3D-observation technique using newly developed fast-scanning AFM is its capability of directly analyzing conformational changes of a molecule and inter-molecules interactions at the single molecule level in the real-time scale. Both the ‘real-time' and the ‘nm-scale' single molecule observations of structurally unstable biomolecules cannot be achieved by other techniques, although cryo-EM (Chen et al, 1994; Schmidt et al, 1994; Roseman et al, 1996; Ranson et al, 2001, 2006) can take the ‘static' images at a nm-scale and fluorescent experiments, such as FRET experiments (Motojima et al, 2004) and stopped-flow experiments (Poso et al, 2004; Taniguchi et al, 2004), can detect the ‘statistical' structural information in real-time. Thus, our experimental method potentially gives us a new insight into the molecular dynamics of biomolecular reactions involving structural changes. In this study, we demonstrated (i) an ATP/ADP-dependent open–closed transition of GroEL without GroES, and (ii) an ATP-dependent association–dissociation events of the GroEL/GroES complexes.
Nucleotide-induced conformational change of GroEL
The histogram of height differences between the taller structure (open-form GroEL) and the surrounding GroEL (closed-form GroEL) in the presence of ATP or ADP (but in the absence of GroES or substrate polypeptides) showed a sharp peak at about 1 nm (Figure 4A), indicating that there is no structural intermediate. The one-line scanning experiment revealed that the open–closed transition of GroEL in the absence of GroES or substrate polypeptides is a very fast process (within 10 ms; Figure 5B), which is consistent with the results and predictions from the previous fluorescent experiments (Poso et al, 2004; Taniguchi et al, 2004). Therefore, these two structural states of GroEL, open-form and closed-form GroEL, are clearly distinguishable.
When we kept monitoring a given single GroEL molecule in the presence of nucleotide, we observed repeated conformational changes between open and closed states (see Supplementary Movie 1). As summarized in Table I, the open time does not depend on the nucleotide concentration. On the other hand, the ‘closed time' was always dependent on the nucleotides concentration, indicating that the ‘closed to open' conformational change requires nucleotide binding. From these results, we can conclude that the ‘closed conformation' is a nucleotide unbound form and the ‘open conformation' is a nucleotide bound form, and the open–closed transition of GroEL is induced by the binding and unbinding of nucleotides to GroEL (on/off process). In this point, a structural fluctuation of the nucleotide-bound GroEL is unlikely; that is, once nucleotide binds to the closed-form of GroEL, it could not be structurally mobile and fluctuate between open and closed conformations without releasing the nucleotides. This is further supported by the observation that, in a very low nucleotide concentration (only a few per cent of GroEL molecules have open conformation), open–closed transition did not ‘continuously' occur on the same GroEL molecule (see Supplementary Movie 1), but rather occurred randomly on separate molecules in the GroEL layer.
It is also notable that both ‘open to closed' and ‘closed to open' conformational changes occur in the presence of ADP or nonhydrolysable ATP analogs (Figures 3 and 6). Especially, with regard to the nucleotide concentration dependency of the kclosed → open value, those for ATP and ATPγS are quite similar (Table I). This means that the nucleotide-bound GroEL changes its conformation ‘from closed to open, and vice versa' without ATP hydrolysis. On the other hand, the kopen → closed value in the presence of ADP (∼1.0 s−1) was apparently larger than those of other nucleotides (0.3–0.5 s−1) (Table I), meaning that the ADP-bound open form is structurally less stable than other nucleotide-bound forms. These results imply that there might be two distinct open conformations in the presence of nucleotide: ATP-bound prehydrolysis open-form and ADP-bound open-form, which could not be distinguished in the AFM images.
Based on our observations and other previous reports, the reaction steps of nucleotide-induced conformational change of GroEL can be depicted as in Figure 11. It has been known that the hydrolysis of ATP was strongly coupled with the structural change of GroEL (Murai et al, 1996; Shiseki et al, 2001). Our result in which the kopen → closed value in the presence of ATP was between those in the presence of ADP and ATP analogs (Table I) also implies that ATP hydrolysis can occur in open-form GroEL. Thus, in the ATP-induced conformational change, ATP binds to the closed state of GroEL and induces conformational change to the open state. Then the hydrolysis of ATP occurs and the open GroEL undergoes another conformational change to the ADP-bound open state, which is less stable than the ATP-bound open state and swiftly releases ADP and returns back to the close conformation (Figure 11).
Figure 11.
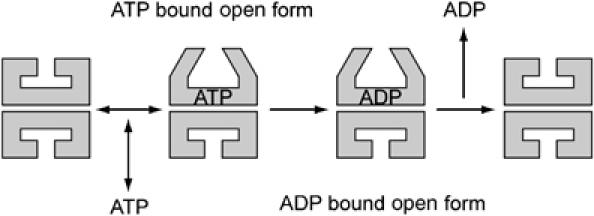
Proposed reaction model of the ATP-dependent open–closed transition of GroEL. ATP binds to the closed conformation of GroEL with higher affinity than ADP and immediately induces conformational change to open state (GroES accepting form). Then the hydrolysis of ATP occurs and the open GroEL undergoes another conformational change to ADP-bound open state, which is less stable than ATP-bound open state. Finally, the open to closed conformational change of GroEL occurs by releasing the nucleotides from GroEL subunits.
ATP-dependent association–dissociation of the GroEL–GroES complexes
The open-conformation of GroEL without GroES (Figure 3) and the cis-conformation of GroEL in the GroEL/ADP/GroES complex (Xu et al, 1997) have similar structures (1 nm taller structures). If we consider these two GroEL structures as the same or similar ones, it is very interesting that the ‘open to closed' conformational change of GroEL without GroES (0.63 s−1/2 μM ATP and 0.94 s−1/50 μM ADP) is apparently faster than the dissociation of GroES from GroEL (0.17 s−1/2 μM ATP and 0.00 s−1/50 μM ADP) in the presence of the same concentration of ATP and ADP. Namely, the GroES binding elongates the lifetime of cis (or open)-conformation of GroEL. Furthermore, their time distributions in the presence of ATP/ADP are very different. These results indicate that the open–closed transition of GroEL is not the rate-determining steps in the ATP dependent reaction cycle of the GroEL–GroES system and GroEL has other mechanisms to control the stable association with and the dissociation of GroES. With regard to the longer lifetime of GroEL/GroES complex, it can be assumed that the GroES binding strongly restricts the ‘open to closed' conformational change of GroEL. On the other hand, concerning the molecular mechanism of GroES dissociation from GroEL, one possibility has been already shown that the further ATP-binding to or ATP-hydrolysis in the counter ring structure of GroEL (Rye et al, 1997, 1999) might be the key reaction of GroES dissociation.
The unique aspect of our experimental system resides in the specimen; one side of the GroEL ring is inaccessible to GroES because of the GroEL adsorption with an end-up orientation without introducing any mutations. This enabled us to analyze the GroEL–GroES interaction at only one side of the GroEL complex without the influence by the GroES-binding to the other side. Nevertheless, our results of nucleotide concentration dependency of GroEL conformational change (Figure 6) are still similar to the results previously measured by the bulk-phase experiments (Jackson et al, 1993; Poso et al, 2004). The measured lifetime of GroEL/GroES complexes in the presence of ATP also agreed very well with those obtained in the completely different single molecule experimental systems, for example, total internal reflection fluorescent (TIRF) microscopy (Taguchi et al, 2001; Ueno et al, 2004). This similarity of the lifetimes of GroEL/GroES complexes measured by our method and TIRF method suggests that it is not necessary for both rings of GroEL to be accessible to GroES for the chaperonin function, although GroES may be able to bind to both ends of GroEL to form a symmetric complex and the symmetric complex may have some biological function under physiological condition (Sparrer et al, 1997; Grallert and Buchner, 2001).
Materials and methods
Fast-scanning AFM
Our fast-scanning AFM system was developed based on Ando et al (2001) system with some modifications as follow. We used newly developed piezo scanners, the resonance frequencies of which are XY 20 kHz and Z 150 kHz. The small cantilevers, made from silicon nitride using standard micromachining techniques (Kitazawa et al, 2003), were 10 μm long, 2 μm wide and 0.1 μm thick. Their resonance frequencies in water were about 600 kHz, and the spring constants in water measured by the thermal vibration method (Hutter and Bechhoefer, 1993) were about 0.1–0.2 N/m. Each cantilever had an electron beam deposited probe made by Nano tools GmbH (Munchen, Germany). In order to use these small cantilevers, we combined the AFM and an inverted optical microscope (IX-71, Olympus, Tokyo, Japan), which was used for the detection of the motion of mounted cantilevers as angular changes in the reflected light beam focused on the back of cantilever through the microscope optics (Ando et al, 2001). These developments allowed us to take an image within 80 ms with tapping mode in buffer solution at room temperature. The scales of the piezo scanner were calibrated against a grid of known dimensions. The error margins of the outputs of our (Z, X–Y) piezo scanners were typically within 3%. Time scale typically varied by ± several % because our AFM system uses PC clock to regulate the timing.
Furthermore, our AFM system contained an UV illumination system. The UV light provided by the mercury lamp (HBO103W/2, USHIO) was used to photolyze caged ATP after once passed through the (U-MWU2) filter. The mechanical shutter shut and opened the UV light, and the UV light was focused on the top of the probe. The diameter of the UV spot size was around 1 mm2 including the AFM scanning area.
Materials
All chemicals used in these experiments were reagent grade. Caged ATP was obtained from Calbiochem (Darmstadt, Germany). ATPγS, AMP-PNP and hexokinase were obtained from Roche (Penzberg, Germany). E. coli GroEL and GroES were purified as described in the previous report (Motojima et al, 2000). The purified GroEL and GroES were stored at −80°C. Purified GroEL and GroES hardly contained contaminated proteins and showed very low Trp fluorescence, equivalent to less than 0.2 Trp per GroEL tetradecamer. GroEL and GroES concentration was determined by Bradford protein assay (Bio-Rad) calibrated by quantitative amino-acid analysis. Before using, the stock GroEL and GroES solution were diluted (50 μg/ml for GroEL in 50 mM HEPES–KOH, 100 mM KCl, 5 mM MgCl2 and 1 mM DTT, pH 7.5; 250 μg/ml for GroES in 50 mM HEPES–KOH, 100 mM KCl, 5 mM MgCl2 and 1 mM DTT, pH 7.5).
Specimen preparation and fast-scanning AFM observation
For the preparation of AFM samples, a 3.0 μl droplet of GroEL solution was directly applied onto a freshly cleaved mica surface (1.0 mm2). After an incubation for 30 min at room temperature, the sample was gently washed several times with buffer A (25 mM HEPES–KOH, 100 mM KCl, 5 mM MgCl2, 10 mM DTT and 25 mM glucose, pH 7.5) to remove un-adsorbed GroEL and kept in the same buffer solution until used. Fast-scanning AFM imaging in tapping mode was performed in the same buffer solution with or without ATP, ADP, caged ATP, ATP analogs (ATPγS, AMP-PNP and ADP+AlFx) and GroES (final concentration of GroES was 25 or 500 nM). In the case of using ADP+AlFx, fast-scanning AFM imaging was performed in the buffer A containing various concentrations of ADP, 30 mM NaF and 5 mM Al(NO3)3. The ATP contamination in commercially available ADP, AMP-PNP or ATPγS was fully hydrolyzed by adding hexokinase for 5 min (final concentration is 0.4 U/ml) to the buffer solution. ATP concentration in solution was measured with the firefly luciferin-luciferase method with a C-100N luminometer (KIKKOMAN, Tokyo, Japan).
All AFM images were obtained at room temperature with a scanning speed of typically 1–4 frames per second for 3D-observation and 250 Hz (lines per second) for 2D-observation. The cantilever was driven at the frequency of 590–610 kHz and with the drive amplitudes of 0.5–2.0 V. The free cantilever amplitude in liquid was set to 1.2–2.0 nm as determined from the force curve. For fast-scanning AFM observation, the force applied by the cantilever to sample was minimized by setting to the highest possible amplitude set-point voltage, which was typically above 80% of free oscillation just close to sample surface. For mechanically bisecting GroEL molecules, amplitude set-point was set to under 60% of the free oscillation.
In the case of using caged ATP, buffer and sample surface in the AFM liquid cell was directly illuminated with UV light for 5 s during fast-scanning AFM observation. Approximately 50% of caged ATP released ATP under our experimental condition.
Analysis of fast-scanning AFM data
To quantify the molecular motion, we calculated the 2D diffusion coefficient of a molecule (D2D). D2D was calculated using the following equation: where 〈Δr2D2〉 is the 2D mean-square displacement of a molecule during the time interval Δt. The values of D2D determined from individual 50 GroEL molecules were then averaged.
To quantify and compare the surface roughness in each image, we measured the RMS value of Z-displacements in each image. For this analysis, we prepared highly occupied GroEL layer, meaning the same protein density (127±4 molecules/162 × 216 nm2), and measured the surface roughness of the top of the extremely flat GroEL layer. The RMS values of Z-scale determined from individual 40 images were then averaged.
Movie (images) analysis was performed with the ImageSMX (http://www.liv.ac.uk/~sdb/ImageSXM/).
Supplementary Material
Supplementary Movie 1
Supplementary Movie 2
Supplementary Movie 3
Acknowledgments
We thank Dr F Motojima and Dr M Yoshida for supplying the purified GroEL and GroES used in our experiments; Dr H Taguchi and Dr T Mizobata for comments on the manuscripts; Dr H Sugiyama for the use of a fluorometer. We also thank members of OLYMPUS Corporation and of our laboratory for helpful discussion and much technical advice. This work was supported by the Special Co-ordination Funds, the COE Research Grant and the Basic Research Grant (B) from the Ministry of Education, Culture, Sports, Science and Technology of Japan and the Measurement and intellectual infrastructure improvement project for small and medium enterprise from the Ministry of Economy, Trade and Industry of Japan.
References
- Allison DP, Hinterdorfer P, Han W (2002) Biomolecular force measurements and the atomic force microscope. Curr Opin Biotechnol 13: 47–51 [DOI] [PubMed] [Google Scholar]
- Ando T, Kodera N, Takai E, Maruyama D, Saito K, Toda A (2001) A high-speed atomic force microscope for studying biological macromolecules. Proc Natl Acad Sci USA 98: 12468–12472 [DOI] [PMC free article] [PubMed] [Google Scholar]
- Binnig G, Quate CF, Gerber C (1986) Atomic force microscope. Phys Rev Lett 56: 930–933 [DOI] [PubMed] [Google Scholar]
- Braig K, Otwinowski Z, Hegde R, Boisvert DC, Joachimiak A, Horwich AL, Sigler PB (1994) The crystal structure of the bacterial chaperonin GroEL at 2.8 A. Nature 371: 578–586 [DOI] [PubMed] [Google Scholar]
- Bukau B, Horwich AL (1998) The Hsp70 and Hsp60 chaperone machines. Cell 92: 351–366 [DOI] [PubMed] [Google Scholar]
- Burston SG, Ranson NA, Clarke AR (1995) The origins and consequences of asymmetry in the chaperonin reaction cycle. J Mol Biol 249: 138–152 [DOI] [PubMed] [Google Scholar]
- Chandrasekhar GN, Tilly K, Woolford C, Hendrix R, Georgopoulos C (1986) Purification and properties of the GroES morphogenetic protein of Escherichia coli. J Biol Chem 261: 12414–12419 [PubMed] [Google Scholar]
- Chaudhry C, Farr GW, Todd MJ, Rye HS, Brunger AT, Adams PD, Horwich AL, Sigler PB (2003) Role of the gamma-phosphate of ATP in triggering protein folding by GroEL–GroES: function, structure and energetics. EMBO J 22: 4877–4887 [DOI] [PMC free article] [PubMed] [Google Scholar]
- Chen S, Roseman AM, Hunter AS, Wood SP, Burston SG, Ranson NA, Clarke AR, Saibil HR (1994) Location of a folding protein and shape changes in GroEL–GroES complexes imaged by cryo-electron microscopy. Nature 371: 261–264 [DOI] [PubMed] [Google Scholar]
- Fotiadis D, Scheuring S, Muller SA, Engel A, Muller DJ (2002) Imaging and manipulation of biological structures with the AFM. Micron 33: 385–397 [DOI] [PubMed] [Google Scholar]
- Grallert H, Buchner J (2001) Review: a structural view of the GroE chaperone cycle. J Struct Biol 135: 95–103 [DOI] [PubMed] [Google Scholar]
- Hansma PK, Elings VB, Marti O, Bracker CE (1988) Scanning tunneling microscopy and atomic force microscopy – application to biology and technology. Science 242: 209–216 [DOI] [PubMed] [Google Scholar]
- Hartl FU, Hayer-Hartl M (2002) Molecular chaperones in the cytosol: from nascent chain to folded protein. Science 295: 1852–1858 [DOI] [PubMed] [Google Scholar]
- Hayer-Hartl MK, Martin J, Hartl FU (1995) Asymmetrical interaction of GroEL and GroES in the ATPase cycle of assisted protein folding. Science 269: 836–841 [DOI] [PubMed] [Google Scholar]
- Hightower LE (1991) Heat shock, stress proteins, chaperones, and proteotoxicity. Cell 66: 191–197 [DOI] [PubMed] [Google Scholar]
- Hunt JF, Weaver AJ, Landry SJ, Gierasch L, Deisenhofer J (1996) The crystal structure of the GroES co-chaperonin at 2.8 A resolution. Nature 379: 37–45 [DOI] [PubMed] [Google Scholar]
- Hutter JL, Bechhoefer J (1993) Calibration of atomic-force microscope tips. Rev Sci Instr 64: 1868–1873 [Google Scholar]
- Jackson GS, Staniforth RA, Halsall DJ, Atkinson T, Holbrook JJ, Clarke AR, Burston SG (1993) Binding and hydrolysis of nucleotides in the chaperonin catalytic cycle – implications for the mechanism of assisted protein folding. Biochemistry 32: 2554–2563 [DOI] [PubMed] [Google Scholar]
- Kitazawa M, Shiotani K, Toda A (2003) Batch fabrication of sharpened silicon nitride tips. Jpn J Appl Phys 1 42: 4844–4847 [Google Scholar]
- Mande SC, Mehra V, Bloom BR, Hol WG (1996) Structure of the heat shock protein chaperonin-10 of Mycobacterium leprae. Science 271: 203–207 [DOI] [PubMed] [Google Scholar]
- Motojima F, Chaudhry C, Fenton WA, Farr GW, Horwich AL (2004) Substrate polypeptide presents a load on the apical domains of the chaperonin GroEL. Proc Natl Acad Sci USA 101: 15005–15012 [DOI] [PMC free article] [PubMed] [Google Scholar]
- Motojima F, Makio T, Aoki K, Makino Y, Kuwajima K, Yoshida M (2000) Hydrophilic residues at the apical domain of GroEL contribute to GroES binding but attenuate polypeptide binding. Biochem Biophys Res Commun 267: 842–849 [DOI] [PubMed] [Google Scholar]
- Motojima F, Yoshida M (2003) Discrimination of ATP, ADP, and AMPPNP by chaperonin GroEL: hexokinase treatment revealed the exclusive role of ATP. J Biol Chem 278: 26648–26654 [DOI] [PubMed] [Google Scholar]
- Mou J, Sheng S, Ho R, Shao Z (1996) Chaperonins GroEL and GroES: views from atomic force microscopy. Biophys J 71: 2213–2221 [DOI] [PMC free article] [PubMed] [Google Scholar]
- Murai N, Makino Y, Yoshida M (1996) GroEL locked in a closed conformation by an interdomain cross-link can bind ATP and polypeptide but cannot process further reaction steps. J Biol Chem 271: 28229–28234 [DOI] [PubMed] [Google Scholar]
- Oberhauser AF, Marszalek PE, Carrion-Vazquez M, Fernandez JM (1999) Single protein misfolding events captured by atomic force microscopy. Nat Struct Biol 6: 1025–1028 [DOI] [PubMed] [Google Scholar]
- Poso D, Clarke AR, Burston SG (2004) Identification of a major inter-ring coupling step in the GroEL reaction cycle. J Biol Chem 279: 38111–38117 [DOI] [PubMed] [Google Scholar]
- Radmacher M, Fritz M, Hansma HG, Hansma PK (1994) Direct observation of enzyme activity with the atomic force microscope. Science 265: 1577–1579 [DOI] [PubMed] [Google Scholar]
- Ranson NA, Clare DK, Farr GW, Houldershaw D, Horwich AL, Saibil HR (2006) Allosteric signaling of ATP hydrolysis in GroEL–GroES complexes. Nat Struct Mol Biol 13: 147–152 [DOI] [PMC free article] [PubMed] [Google Scholar]
- Ranson NA, Farr GW, Roseman AM, Gowen B, Fenton WA, Horwich AL, Saibil HR (2001) ATP-bound states of GroEL captured by cryo-electron microscopy. Cell 107: 869–879 [DOI] [PubMed] [Google Scholar]
- Ranson NA, White HE, Saibil HR (1998) Chaperonins. Biochem J 333 (Part 2): 233–242 [DOI] [PMC free article] [PubMed] [Google Scholar]
- Roseman AM, Chen S, White H, Braig K, Saibil HR (1996) The chaperonin ATPase cycle: mechanism of allosteric switching and movements of substrate-binding domains in GroEL. Cell 87: 241–251 [DOI] [PubMed] [Google Scholar]
- Rye HS, Burston SG, Fenton WA, Beechem JM, Xu Z, Sigler PB, Horwich AL (1997) Distinct actions of cis and trans ATP within the double ring of the chaperonin GroEL. Nature 388: 792–798 [DOI] [PubMed] [Google Scholar]
- Rye HS, Roseman AM, Chen S, Furtak K, Fenton WA, Saibil HR, Horwich AL (1999) GroEL–GroES cycling: ATP and nonnative polypeptide direct alternation of folding-active rings. Cell 97: 325–338 [DOI] [PubMed] [Google Scholar]
- Schiener J, Witt S, Hayer-Hartl M, Guckenberger R (2005) How to orient the functional GroEL-SR1 mutant for atomic force microscopy investigations. Biochem Biophys Res Commun 328: 477–483 [DOI] [PubMed] [Google Scholar]
- Schmidt M, Rutkat K, Rachel R, Pfeifer G, Jaenicke R, Viitanen P, Lorimer G, Buchner J (1994) Symmetric complexes of GroE chaperonins as part of the functional cycle. Science 265: 656–659 [DOI] [PubMed] [Google Scholar]
- Sekiguchi H, Arakawa H, Taguchi H, Ito T, Kokawa R, Ikai A (2003) Specific interaction between GroEL and denatured protein measured by compression-free force spectroscopy. Biophys J 85: 484–490 [DOI] [PMC free article] [PubMed] [Google Scholar]
- Shiseki K, Murai N, Motojima F, Hisabori T, Yoshida M, Taguchi H (2001) Synchronized domain-opening motion of GroEL is essential for communication between the two rings. J Biol Chem 276: 11335–11338 [DOI] [PubMed] [Google Scholar]
- Sparrer H, Rutkat K, Buchner J (1997) Catalysis of protein folding by symmetric chaperone complexes. Proc Natl Acad Sci USA 94: 1096–1100 [DOI] [PMC free article] [PubMed] [Google Scholar]
- Taguchi H, Ueno T, Tadakuma H, Yoshida M, Funatsu T (2001) Single-molecule observation of protein–protein interactions in the chaperonin system. Nat Biotechnol 19: 861–865 [DOI] [PubMed] [Google Scholar]
- Taniguchi M, Yoshimi T, Hongo K, Mizobata T, Kawata Y (2004) Stopped-flow fluorescence analysis of the conformational changes in the GroEL apical domain: relationships between movements in the apical domain and the quaternary structure of GroEL. J Biol Chem 279: 16368–16376 [DOI] [PubMed] [Google Scholar]
- Thomson NH, Fritz M, Radmacher M, Cleveland JP, Schmidt CF, Hansma PK (1996) Protein tracking and detection of protein motion using atomic force microscopy. Biophys J 70: 2421–2431 [DOI] [PMC free article] [PubMed] [Google Scholar]
- Todd MJ, Viitanen PV, Lorimer GH (1994) Dynamics of the chaperonin atpase cycle – implications for facilitated protein-folding. Science 265: 659–666 [DOI] [PubMed] [Google Scholar]
- Ueno T, Taguchi H, Tadakuma H, Yoshida M, Funatsu T (2004) GroEL mediates protein folding with a two successive timer mechanism. Mol Cell 14: 423–434 [DOI] [PubMed] [Google Scholar]
- Viani MB, Pietrasanta LI, Thompson JB, Chand A, Gebeshuber IC, Kindt JH, Richter M, Hansma HG, Hansma PK (2000) Probing protein–protein interactions in real time. Nat Struct Biol 7: 644–647 [DOI] [PubMed] [Google Scholar]
- Weissman JS, Rye HS, Fenton WA, Beechem JM, Horwich AL (1996) Characterization of the active intermediate of a GroEL–GroES-mediated protein folding reaction. Cell 84: 481–490 [DOI] [PubMed] [Google Scholar]
- Xu Z, Horwich AL, Sigler PB (1997) The crystal structure of the asymmetric GroEL–GroES–(ADP)7 chaperonin complex. Nature 388: 741–750 [DOI] [PubMed] [Google Scholar]
- Yang Y, Wang H, Erie DA (2003) Quantitative characterization of biomolecular assemblies and interactions using atomic force microscopy. Methods 29: 175–187 [DOI] [PubMed] [Google Scholar]
Associated Data
This section collects any data citations, data availability statements, or supplementary materials included in this article.
Supplementary Materials
Supplementary Movie 1
Supplementary Movie 2
Supplementary Movie 3