

Abstract
There is a clear need for technology that enables accurate, high-resolution, three-dimensional (3D) measurement of intricate dose distributions associated with modern radiation treatments. A potential candidate has emerged in the form of water-equivalent “3D gel dosimetry” utilizing optical-computed- tomography (optical-CT). In a previous paper we presented basic physical characterization of an in-house prototype optical-CT scanning system. The present paper builds on that work by investigating sources of optical artifacts and geometric distortion in optical-CT scanning. Improvements in scanner design are described. Correction strategies were developed to compensate for reflection and refraction, imperfections in the water-bath, signal drift, and other effects. Refraction and reflection were identified as the principal factors causing inaccurate reconstruction of absolute attenuation coefficients. A correction specific to a given flask was developed utilizing prescans of the flask when filled with water-bath fluid, thereby isolating the refractive and reflective components for that flask. Residual artifacts were corrected by fitting a theoretical model to the well-behaved portion of these prescans and extrapolating to regions of lost data, enabling reconstruction of absolute optical-CT attenuation coefficients to within 4% of corresponding spectrophotometer values. Needle phantoms are introduced to quantify geometric distortion under a range of conditions. Radial distortion of reconstructed needle positions was reduced to <0.3 mm (0.27% of the field of view) through adjustment of the water-bath refractive index. Geometric distortion in polymer gel due to radiation-induced refractive index changes was found to be negligible under the conditions examined. The influence of scattered light on reconstructed attenuation coefficients was investigated by repeat optical-CT scans while varying the aperture of a scatter-rejecting collimator. Significant depression of reconstructed attenuation coefficients was observed, particularly under conditions of poor scatter rejection collimation. The general conclusion is that the first-generation optical-CT technique can be made insensitive to geometrical distortion, but can be susceptible to scatter effects. For accurate reconstruction of absolute attenuation coefficients, correction strategies are essential.
Keywords: gel dosimetry, optical CT, polymer gel, 3D dosimetry
I. INTRODUCTION
The technique of optical-computed-tomography (optical-CT) has been applied by several groups to the reading of three-dimensional (3D) dose distributions recorded in gel dosimeters.1-8 Although promising results have been presented, several types of artifacts have been identified that originate from the physics of light transport through the gel dosimeter and scanning system. The principal sources are refraction, reflection, and scatter, but quantification of these effects is limited. Gore et al.1 and Doran et al.5 use optical simulation to assess laser refraction in simple gel-dosimetry configurations, but a quantitative assessment of geometric distortion in optical-CT images has not been published. Kelly et al.3 present strategies to compensate for signal losses due to reflection, refraction, and water-bath imperfections. In this paper we evaluate existing strategies for correcting or minimizing artifacts in optical-CT scanning and, when appropriate, develop improved or alternative methods.
II. METHODS
The methods are structured into three parts [Secs. II A, II B, and II C, respectively]. The first introduces each artifact source and illustrates their effects. Existing correction strategies are evaluated and new correction strategies are developed. When the effects of a potential artifact source are not known, as is the case with scatter, characterization experiments are described. The second and third parts follow the observation that an artifact can cause a particular feature to appear in the reconstructed image with incorrect position (geometrical distortion) or incorrect attenuation (accuracy of reconstruction), or both. The second part therefore describes experiments to quantify and minimize geometric distortion. The third part details experiments to evaluate the impact of artifact suppression on the accuracy of reconstructed attenuation coefficients.
Optical-CT data presented here were acquired with an in-house optical-CT scanning system.4,7 Data reconstruction and analysis were performed using an in-house Optical-CT Graphical User Interface (OCT-GUI) developed in matlab (The Mathworks, Inc., Natick, MA). The OCT-GUI uses the matlab function, iradon, for image reconstruction. The iradon function computes the inverse radon transform using a filtered backprojection algorithm with user-specified filter and interpolation. All reconstructions presented in this paper were performed using the Hamming filter and linear interpolations.
A. Artifacts and correction strategies
1. Instrumental effects
To date, all first-generation optical-CT scanners1,3,4,7,8 incorporate a large-area photodiode detector statically mounted at one end of an optical bench. Transmitted laser light is deflected onto it by a traveling mirror. This arrangement simplifies aspects of motion control and also minimizes the amount of reflected and scattered laser light that reaches the detector. This setup was found to have the disadvantage that artificial asymmetries could be introduced into the projection data because of the varying optical path length between the flask and the field photodiode as the laser steps across the flask [Figs. 1(a) and 1(b)]. The asymmetries were exacerbated by the presence of interference filters, which reduce sensitivity to ambient lighting,8 but are sensitive to angle of incidence. An alternative configuration was therefore investigated where the photodiode was moved onto the linear translation stage, such that a constant optical path length was maintained from gel flask to diode, and the interference filters were removed.
Fig. 1.
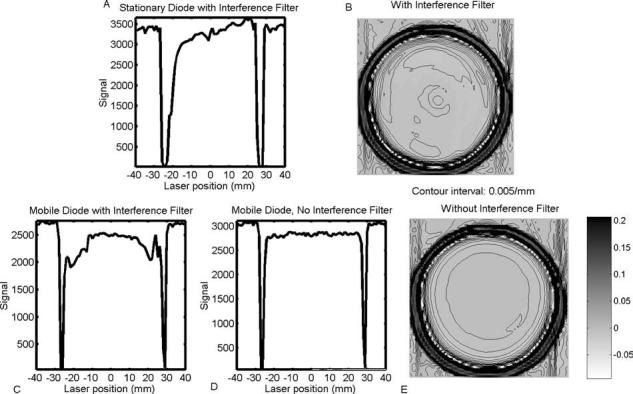
Projection data and corresponding optical-CT reconstructions of a cylindrical flask containing uniformly attenuating fluid. The geometry is symmetric, but, depending on the setup of the scanner, projections and reconstructions may exhibit asymmetries and artificial structure. (a) The photodiode with interference filter is mounted statically on the optical bench. Asymmetries in the projection and corresponding reconstruction (b) are a result of the varying optical path length between the flask and photodiode. The effects are exacerbated by the presence of the interference filter, which is sensitive to the angle of incident light. (c) Projection asymmetries are reduced by mounting the photodiode onto the translation stage. (d) The highest quality projections were acquired with the mobile photodiode (i.e., mounted on the translating arm) and when the interference filter was removed. In this case the reconstructed image of the uniform fluid (e) was significantly more uniform and symmetric.
Instrument drift in optical-CT has largely been associated with variations in the output of the laser and has traditionally been corrected with a “reference diode” strategy.1,3,4,7,8 Here, the laser is split into two beams: one used for scanning, and the other directed onto a reference photodiode to monitor laser fluctuations. An illustration of instrument drift for a 635 nm laser diode (Edmund Optics, Barrington, NJ), in which both photodiodes (with interference filters) were monitored over a prolonged in-air acquisition, is shown in Fig. 2(a). Periodic oscillations in the signal are observed, correlating with temperature variation arising from the 2 h laboratory air-conditioning cycle. Although the temperature varies by only 2 °C the effect on the signal was up to 20%. It can also be seen that the oscillations in the two diode signals are out of phase. The cause of the phase shift and excessive output fluctuations was traced to the sensitivity of key optical components to perturbations in the wavelength and incident angle of the laser light. When these components (interference filters and beam splitters) are utilized with a diode laser source, which may exhibit thermally induced wavelength changes, a drift correction based on a reference diode can be inaccurate. An alternative drift correction was therefore developed based on repetitive tracking of a baseline condition assumed to be constant in the absence of drift. The baseline condition was selected as the end portions of each projection where the laser has stepped beyond the edges of the flask and passes only through the water-bath. Instrument drift should manifest as an apparent change in attenuation along these paths. The time interval for each projection was always less than 10 s, over which time the output of the laser is assumed constant. This method of determining the drift is referred to as “water-bath tracking.”
Fig. 2.

(a) Instrument drift acquired over a 16 h period under steady-state conditions when both the laser and photodiodes (with interference filters) were stationary. The approximate 2 h period corresponds to the air-conditioning cycle in the laboratory. The reference and field photodiode signals are out of phase because of thermal effects on the laser diode and wavelength and angular sensitivity of the beamsplitter and filters. (b) Comparative drift plots for three different scanner setups. (c) Drift-corrected normalized signal values from a 15 min scan of the water-bath as determined by the reference diode (before scanner changes) and water-bath tracking techniques. A perfect correction would yield a horizontal line of unity with random variation only. The error in the water-bath tracking technique is smaller and less systematic than that of the reference diode.
Spikes in projection data that do not change position as the dosimeter rotates can be attributed to imperfections on the walls of the water-bath: scratches, smudges, microbubbles, etc. Their effect on reconstructed images of a uniform Lucite water-bath is illustrated in Fig. 3(a). Ring artifacts with a peak-to-peak amplitude of ∼3 ×10⁻³ mm−1 are observed in a reconstruction of a nominally uniform medium. To reduce these artifacts, the projection data were normalized by an average of multiple scans of the water-bath only, taken before and after actual scanning of the flask. This method is similar to that described in Kelly et al.,3 who use only prescans. The inclusion of both pre- and postscan data enabled verification of the stability of the artifacts and also provided a further check of the instrument drift. In addition, a new water-bath made with antireflection-coated glass, similar to that used by Islam et al.,8 was tested.
Fig. 3.
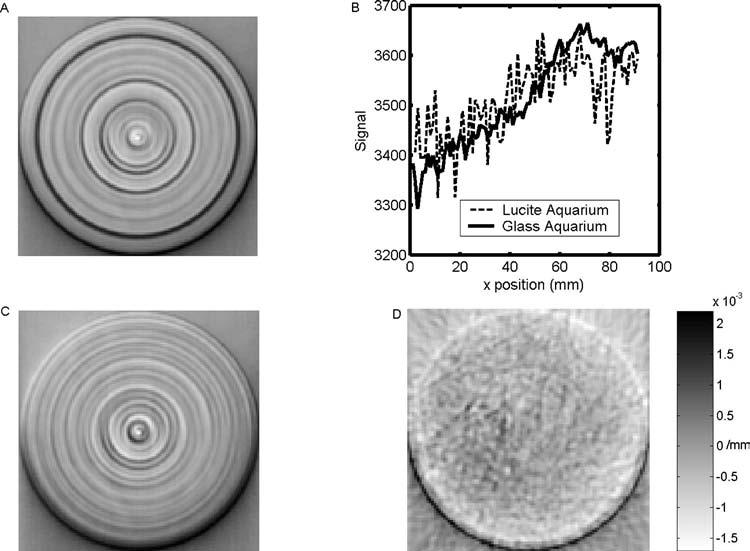
(a) Reconstructed optical-CT image of uniformly attenuating fluid in a Lucite water-bath. (b) Averaged projection data for the Lucite water-bath and a new anti-reflection-coated glass water bath. The noise-like spikes in the projections are in fact repeatable structure. The Lucite water-bath was of poor optical quality compared with the glass water-bath, resulting in more significant spiking in the projection data and causing more pronounced ring artifacts in the reconstruction. In (c) normalization by pre- and postscans was applied to reduce the ring artifacts. Reconstructed optical-CT image of uniformly attenuating fluid in a new antireflection coated glass water-bath is shown in (d).
2. Reflection and refraction
Reflected rays are produced at many points in the ray path through the scanning system. Most of these rays are easily eliminated by judicious angling of components to deflect the reflected rays away from the acquisition optics. Greater problems are caused by reflected and refracted rays originating from the walls of the gel flask and the water-bath. Grossly deflected rays were largely eliminated by incorporating a collimator downstream of the water-bath and by applying absorbing black tape to the water-bath walls, leaving a narrow slit to pass the primary laser light. However there remain reflection and refraction losses of laser light in the flask walls. If these losses are not accounted for, they carry through the reconstruction process and distort the reconstructed attenuation values of the flask contents. For accurate measurement of attenuation coefficients, a correction technique is required to compensate for reflection and refraction losses. In addition to affecting the magnitude of reconstructed attenuation coefficients, refraction of rays can potentially cause geometric distortion. This aspect is dealt with in Sec. II B.
Several authors have modeled reflection and refraction effects by assuming static geometries and performing optical simulations utilizing Fresnel and Snell equations.1,3,5 Practically, this approach is constrained by the accuracy with which the geometric and optical properties of the optical-CT setup are known. These include the refractive indices of the water-bath walls, water-bath fluid, gel and gel flask; the angles of incidence at every interface; and any attenuation between interfaces. Knowledge of the size and refractive index of scattering particles may also be required. Some of these variables are difficult to determine precisely. In our setup slight tilts and off-centeredness of the flask may also arise from the screw-thread mounting of the flask to the rotation stage. Minor variations in these and other respects limit the precision with which the Fresnel and Snell equations can be used to effect the reflection and refraction correction. An alternative measurement-based approach was therefore investigated, the basis of which was to determine the reflection and refraction losses in a single step using measured projection scans of the water-bath both with and without the presence of the gel flask. This is an extension of a method suggested by Jordan.9 The flask was filled with water-bath solution such that any differences in the projections were due entirely to the presence of the flask walls with no effects associated with its contents. If the walls of the flask contain laser-attenuating particles (e.g., barex can have a light yellow hue) this method will also account for that attenuation. This approach is illustrated in Fig. 4. In the absence of the flask, the projection is flat. When the flask is present, regions of data loss near the flask walls appear corresponding to when the laser is refracted off the detector. A slight depression is observed in the central portion of the projection corresponding to reflection losses. Correction factors for a given flask and scanner setup are obtained at every position of each projection by taking the ratio between the two scans.
Fig. 4.
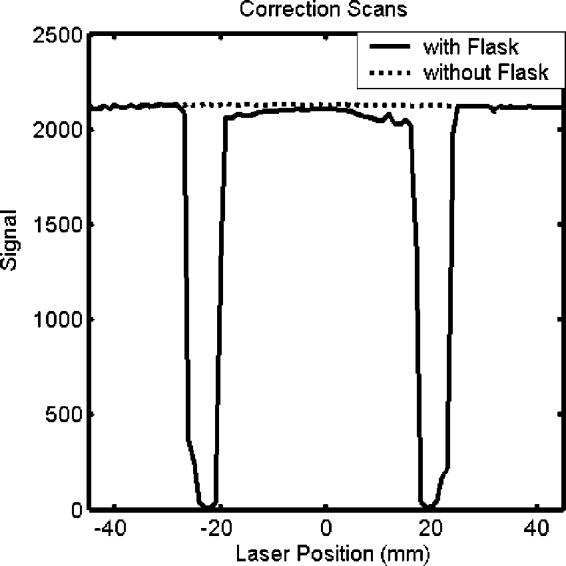
Comparison of projection scans taken with and without the presence of a flask in the water-bath. The flask contained water-bath solution, so the differences in the plots are attributed solely to the reflection, refraction, and attenuation of the flask. Correction factors for a given flask and scanner setup are obtained at every position of each projection by taking the ratio between the two scans. In this particular instance, the polarization angle of the laser was set perpendicular to the plane of incidence on the flask.
Several points are noted about this technique for correcting for the effects of reflection/refraction. First, for application to gel dosimetry, the refractive index of the water-bath fluid inside the flask was adjusted to match that of the dosimetric gel to be used (for details see Oldham et al.7). Second, this correction strategy suffers from sensitivity to flask positioning and to conditions of low signal-to-noise ratio (SNR). Significant residual errors in corrected projections can occur at and near the edges of the flask. An additional step was therefore incorporated where theoretical projection data (or splice data) were spliced into these strictly localized regions. The splice data were obtained by least-squares fitting a theoretical projection to the well-behaved section of the measured projection ignoring the corrupted end. The fit parameters were then used to extend splice data into the corrupted regions. The theoretical projection was calculated using the Fresnel, Snell, and attenuation equations, incorporating measured values for refractive indices and the outer diameter of the phantom. Nonlinear regression was used to determine the best fit values for attenuation coefficients and flask wall thickness. Third, the correction is performed on the projection data before reconstruction and thus differs from the subtraction strategy employed in our previous paper.4 In the latter case, reconstructions of preirradiation optical-CT scans are subtracted from postirradiation reconstructions to yield the changes in attenuation. Common features (e.g., flask walls, cupping artifacts) should cancel out in the difference image. The subtraction method was found to be relatively effective, but to have some disadvantages. These include the inability to account for attenuation-dependent artifacts, sensitivity to small deviations in flask position, increased noise, and also that only the changes in attenuation were obtained. Our new method enables more accurate measurement of attenuation coefficients and corrects for noise and positioning errors.
3. Scatter
The influence of scattered light on reconstructed attenuation coefficients was investigated by repeat optical-CT scanning of test tubes of BANG3 gel (MGS Research, Inc., Madison, CT), irradiated to different doses, while varying the amount of scattered light permitted to enter the collection optics. The test tubes were 2 cm in diameter and irradiated to different nominally uniform doses with a 6 MV linear accelerator, resulting in attenuation coefficients ranging from 0 to 2 cm−1. Control of the amount of scattered light entering the collection optics was achieved by means of a variable-aperture circular collimator mounted on the traveling arm on the exit side of the water-bath. Each tube was scanned twice, once with the collimator fully open (∼2 cm diameter, 4.8° acceptance angle measured from the center of rotation of the flask) and once with the collimator closed to ∼3 mm diameter (0.7° acceptance angle).
B. Geometrical distortion
A general artifact associated with refraction is geometrical distortion, which can arise if the attenuation of a ray is backprojected along a line that is not the same as that traversed by the real ray. Two experiments were performed to investigate the magnitude of distortion effects using “needle phantoms” [Fig. 5(a,b)]. The needle phantoms were constructed from 11- and 5.5 cm diameter clear plastic cylindrical vessels filled with a gelatin gel that supported an arrangement of needles orientated vertically in the gel. The refractive index of gelatin gel is close to that of BANG3. Several needle patterns were investigated including a spiral pattern where the needles were placed in radial increments of 2 mm spiraling out from the center of the flask. The spiral pattern minimizes overlap between multiple needles in any given laser projection. This contrasts with a Cartesian pattern, which incurred significant overlap of needle positions. In the first experiment, optical-CT scans of the needle phantoms were compared to x-ray CT scans. Needle positions determined by a centroid algorithm in the x-ray CT scans were taken as true positions against which the needle positions in the optical-CT scans could be compared. Repeat optical-CT scans were taken using different refractive indices for the water-bath ranging from water (n = 1.333) to a value greater than that of the gel (1.362 vs ngel = 1.3595). When the refractive index of the water-bath was poorly matched to the gel inside the flask, increased refraction effects were expected.
Fig. 5.
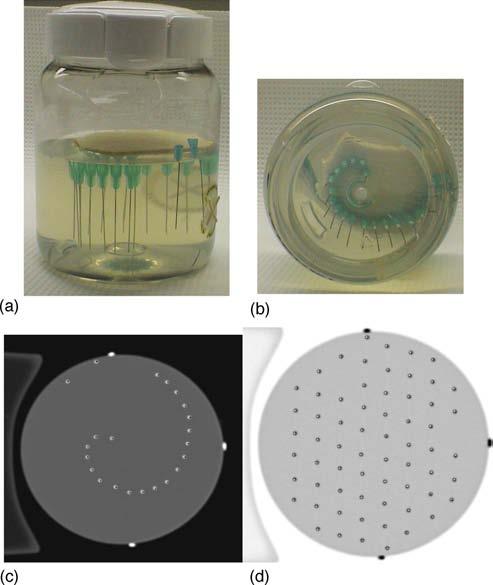
(a,b) “Needle phantom” (11 cm diameter flask, 0.5 mm diameter needles) used to quantify geometrical distortion in optical-CT scanning. (c,d) Evaluation of geometrical distortion was possible by means of comparative x-ray CT and optical-CT scans. The x-ray CT scan of the needle phantom was taken as the gold standard for needle positions. The optical-CT scan of the same plane of the needle phantom was manually registered with the x-ray-CT scan. Negligible discrepancy (∼0.25 mm) indicates very limited spatial distortion even close to the flask walls. In both images (c,d) the optical-CT needle positions are represented as points within the slightly larger diameter x-ray CT needle reconstructions.
The first experiment considered the case where the refractive index of the gel inside the flask was uniform. A second experiment was therefore performed where optical-CT scans were taken of needle phantoms (consisting of a BANG3 polymer gel) both pre- and postirradiation. Preirradiation, the refractive index of the gel was uniform. Postirradiation, the refractive index varied in accordance with the dose delivered to the gel.2 Two gel-dosimetry needle phantoms were studied. In the first, the irradiation consisted of a dose of 4 Gy given by a single circular radiosurgery beam (6 MV) of diameter 1.5 cm delivered along the central axis of the phantom. The high dose ensured significant difference between irradiated and unirradiated gel in terms of polymerization, scattering, and refractive index. In the second phantom a larger radiosurgery beam was used (5 cm diameter) to deliver the 4 Gy dose, but this time a circular lead block was applied to the central 1.8 cm diameter portion of the beam. A “ring” of dose was thus delivered to the phantom with high dose at the edges and low dose on the central axis. The latter distribution represents the inverse of the former, presenting two extreme dose distributions to study for refractive effects.
C. Absolute measurement of optical attenuation coefficient
Absolute measurements of optical attenuation coefficients were made on three separate phantom systems representing a range of scattering and attenuating gel types. The first phantom consisted of clear plastic flasks of 5.5 cm diameter [1 mm thick polyethylene terephthalate (PET) plastic walls] containing uniform fluid that had been dyed to varying degrees using blue food coloring. The second phantom consisted of larger, clear plastic finger-phantoms (11 cm diameter, 1 mm thick PET walls) containing four fingers of gel each dyed with varying amounts of food coloring.7 The third phantom system consisted of glass test tubes (2.5 cm diameter) containing BANG3 gel that had been irradiated to different doses (6 MV radiation, 0, 0.5, 1, 1.5, 2, 2.5 Gy). For all optical-CT scans, the variable-aperture collimator was set at 1 cm diameter. In the case of the BANG3 gel, laser light is primarily attenuated through scattering, whereas in the other two cases, the food coloring dye attenuates the laser by absorption.
III. RESULTS AND DISCUSSION
A. Artifact correction strategies
1. Instrumental effects
Mounting the photodiode on the traveling arm significantly improved the symmetry of the projection data by maintaining a constant optical path length between the gel flask and diode [Fig. 1(c)]. Residual asymmetries and artificial structure were found to originate from the interference filter, which introduced angular sensitivity to small flask-induced refraction of the incoming laser light. Removing the interference filter eliminated these artifacts and led to improved, flatter projection data [Fig. 1(d)]. The improved projection data translate into higher quality reconstructed images as illustrated by comparing Fig. 1(e) with Fig. 1(b).
The magnitude of signal drift was about 30× less after removal of the interference filters [Fig. 2(b)]. However, minor phase discrepancies between the two diodes persisted and manifested as a ∼1% amplitude oscillation in the field/reference ratio. Replacing the beamsplitter with an angled neutral density filter removed the phase discrepancy, resulting in a flat field/ratio plot (standard deviation <0.1%). The success of these changes allows us to retain the convenience of using a laser diode. Drift effects are expected to be smaller for He–Ne laser-based scanners, though this was not studied.
A comparison of the “reference diode” (before hardware changes were implemented) and “water-bath tracking” drift correction methods for a single plane scan of a finger phantom is shown in Fig. 2(c). During this 15 min scan the field diode signal was determined to fall and rise with peak-to-peak amplitude of 3.3%. The figure shows the drift-corrected, normalized signal through the water-bath, as determined by the two methods, versus time. A perfect correction would yield a horizontal line with unit value and random variation only. In this case, the error associated with the water-bath tracking method can be seen to be smaller with less structure than that of the reference diode method. The water-bath tracking method assumes the projection through a uniform water-bath is flat. Slight deviations from this ideal, caused by uncertainties in the positioning, shape, and quality of the water-bath, can result in a residual offset error such as that observed in the figure.
Figure 3(b) shows sample projection data for the Lucite and glass water-baths. Each point is the median average of five scans with a typical standard deviation of ∼10. The noise-like spikes in the projections were structural and repeatable. The Lucite water-bath was relatively worn and of poor optical quality compared with the glass water-bath, resulting in greater number and size of spikes. Ring artifacts due to imperfections of the walls of the Lucite water-bath were reduced after correction by a factor of 3–4, but are still present [Fig. 3(c)]. The ring artifacts are almost completely absent in the images reconstructed from projections acquired through the new antireflection-coated glass water-bath [Fig. 3(d)]. Here, the low SNR resulted in poorly correlated pre- and postwater-bath scans. The correction using these scans was therefore not retained, as the ringing in the “corrected” image was actually worse because the correction method treated the random noise in the pre- and postscans as structural and systematically removed them from every projection.
The impact of these corrections are illustrated with respect to the optical-CT scanning and reconstruction of an 11 cm diameter finger phantom in Fig. 6. The finger phantom contained four fingers of varying attenuation, and was scanned with 120 projections (1.5° rotation step size) and 0.5 mm laser step size. These images illustrate some of the key difficulties encountered with raw optical-CT data. The sinogram showing all 120 projections is illustrated in Fig. 6(a). Several imperfections (scratches, etc.) on the flask walls are identifiable as sinusoidal line features of minimal width. The loss of data at the edges of the flask is visible as white bands running across the top and bottom of the sinogram. The signal drift that occurred during the 15 min scan is illustrated in Fig. 6(b), and was found to be within 3%. The pre- and postscans through the water-bath, without the presence of the flask, is shown in Fig. 6(c). These scans show significant but repeatable structure. The reconstruction of the raw projection data, prior to the application of any corrections, is shown in Fig. 6(d). This image shows highly attenuating wall artifacts though in reality the walls are highly transmitting. The extent to which this artifact dominates the image may be conveyed by observing that the structures of real interest—the gel fingers—occupy only the bottom tenth of the full windowing and are thus barely visible. The depressive effect of the wall artifact is visible as a white ring on the inside of the flask walls and in the fact that the clear gel in the flask is reconstructed with slightly negative attenuation values. In Figs. 6(e) and 6(f), only the drift and water-bath imperfection corrections were applied to the raw data, and the resulting difference images displayed. Figure 6(e) shows that the drift effects in this particular scan were minimal, on the order of 1×10⁻⁵ mm−1 throughout most of the reconstruction. This value can be compared with the attenuation coefficient of the least attenuating finger, which was 1.56×10⁻² mm−1 as measured with a spectrophotometer. The correction of artifacts due to water-bath wall imperfections, as shown in Fig. 6(f), is of greater magnitude, with local corrections to reconstructed attenuation values as high as 2.6×10⁻³ mm−1.
Fig. 6.
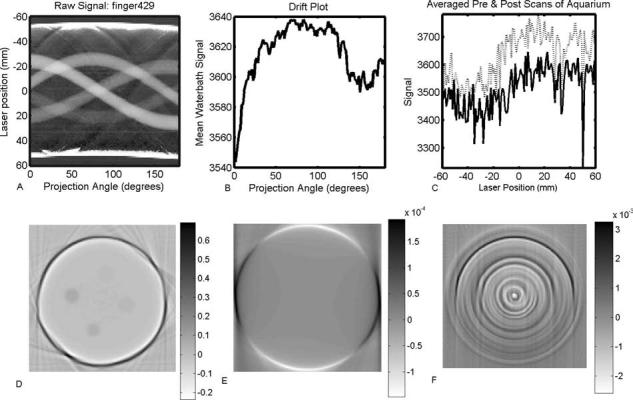
Illustration of the application of instrument drift and water-bath wall correction strategies. The raw projection data for the complete scan is shown as a sinogram in (a). The drift measured over the duration of the scan is shown in (b). The pre- and postscans of the water-bath without the presence of the finger phantom are shown in (c). The reconstructed image from the raw (uncorrected) projections is shown in (d). Difference images, with respect to the raw reconstruction, are shown after application of the drift correction (e) and the correction for imperfections in the walls of the water-bath (f).
2. Reflection and refraction
The impact of the key steps of the refraction and reflection correction, applied to the finger phantom scan introduced in Fig. 6, is illustrated in the progression of images in Fig. 7. Figure 7(a) shows the projection and reconstruction data after the drift and attenuation corrections were performed. Figure 7(b) shows the first step of the refraction and reflection correction. The measured projection is divided by a corresponding prescan projection of the same flask when filled with water-bath fluid. The corrected projection is then rescaled to account for the true attenuation of the water-bath fluid, which was dyed to match the attenuation of the gel in order to maximize the dynamic range of the scanner. The majority of the artifacts due to data loss at the edges of the flask are repaired by this correction, but the procedure is not perfect due to noise and slight errors in repeatability of flask positioning. Although remaining “spikes” in the projection data cause streak artifacts at the edges of the flask in the reconstructed image, improvement is achieved regarding the reduction in magnitude of the negative attenuation coefficients reconstructed inside the flask. Figure 7(c) represents the final, fully corrected projection and reconstruction data. The thick line over the projection data indicates the theoretical projection across the flask containing clear gel, determined using least-squares fitting. In this instance, the calculated projection appears nearly flat across the entire projection because the attenuation of water-bath fluid and gel were well matched. The residual spikes in the projection data were removed by splicing in data from the fitted theoretical projection to replace the corrupted data at the edges of the flask over a region of 2–5 mm along the projection. The streak artifacts at the flask walls correspondingly vanish. In the final reconstruction, the negative attenuation coefficients are removed, the flask walls no longer appear as highly attenuating, and the fingers are now readily visible against the background of the clear gel. The reconstructed attenuation coefficients of the fingers were found to be very close to their absolute values as determined independently using the spectrophotometer (see Sec. III C).
Fig. 7.

Illustration of the progressive improvement in image quality as the refraction and reflection corrections are applied. (a) The projection data and reconstructed image after application of the drift and water-bath corrections only. (b) Normalizing projections by corresponding prescan projections of the flask containing matched water-bath fluid removes the majority of refraction and reflection effects. Significant spikes at the edges of the flask, arising from high sensitivity to small errors in positioning of the flask, lead to streak artifacts in the reconstructed image. (c) Fitted theoretical projection data are spliced into strictly localized regions of data loss at the edges of the flask. The splicing removes the edge artifacts and yields the fully corrected final image.
3. Scatter
The effects of instrument drift, imperfections in the water-bath walls, and reflection and refraction are all essentially independent of the attenuation of the gel itself. Their impact on reconstructed attenuation values does not scale with dose given to the gel. The amount of scatter, on the other hand, does correlate with the attenuation values in scattering gel dosimeters like BANG gels. Regions of gel receiving high dose contain greater density of polymerization and are more scattering than regions given less dose. This translates into a depression of reconstructed attenuation values by a fixed proportion as opposed to the fixed offset associated with the previous effects. The amount of scattered light detected depends on the specific characteristics of the scanner's optical components and setup, in particular the position and area of the photodiode and any collimators or lenses. The combined effect for our scanner configuration is shown in Fig. 8, where reconstructed attenuation coefficients of uniformly irradiated BANG3 were found to be 13% greater when the collimator was closed to a 3 mm diameter than when fully open (20 mm diameter). Since the detector cross section seen by scattered light in our scanner is unlikely to match that seen in a spectrophotometer, an inherent difficulty arises in making absolute attenuation comparative measurements in a scattering medium. It should be noted that this difficulty in absolute measurement of attenuation coefficient does not translate directly into the clinical application of gel dosimetry. In the latter, relative changes in attenuation coefficients are measured and converted to dose through a calibration curve.2,3,6-8 Systematic differences from absolute values can be accounted for in the attenuation-to-dose calibration procedure. However nonuniform scattering distributions were not studied in this work, and the effects of scatter in intricate three-dimensional dose distributions may be more complicated and difficult to predict.
Fig. 8.
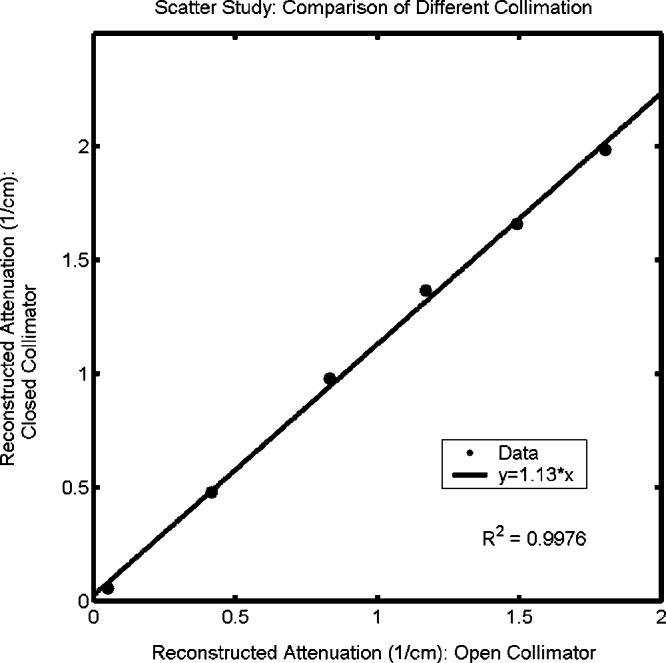
Influence of scatter on reconstructed attenuation coefficients of test tubes of BANG3 gel. The plot shows optical-CT reconstructed attenuation coefficients acquired with the scatter-rejection collimator fully open (20 mm diameter), and with the collimator closed to 3 mm diameter. Error is on the order of the data marker size.
B. Geometrical distortion
The influence of varying the refractive match of the water-bath fluid on optical-CT reconstructions of a needle phantom is shown in Fig. 9. The refractive index of the water-bath fluid was varied from 1.333 to 1.362, representing values on either side of the gel at 1.3595. The data loss at the walls was minimized when the refractive index of the water-bath was below, rather than matched to the gel. This finding is in line with previous studies on the subject.1,5 The difference image of two of the scans (n=1.341 and n=1.362) demonstrates radial distortion or compression of needle positions. The use of difference images allows the detection of small, systematic geometric distortion that may have been difficult to detect otherwise.3 The magnitude of this distortion was found to increase linearly with the refractive index of the water-bath, and also linearly with radial position. The data in Fig. 9 suggest that the optimal refractive index for the water-bath differs slightly from the standpoint of minimizing wall artifact versus minimizing geometric distortion. However, it is possible to adjust the water-bath so both the mean geometric distortion and the wall artifacts are acceptably small. This is illustrated in Fig. 5(b), which shows an overlay of x-ray CT and optical-CT scans of two needle phantoms. The mean distortion was determined by comparing needle positions in the two images (calculated to subpixel accuracy using a centroid algorithm) to be ∼0.25 mm.
Fig. 9.
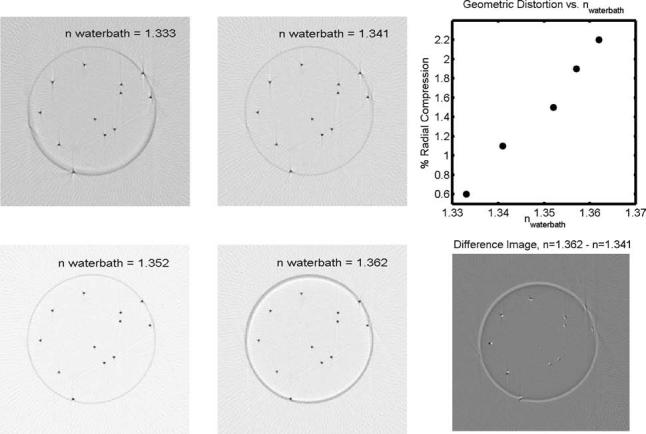
Optical-CT scans of the same plane through a needle phantom, consisting of an arrangement of 0.5 mm diameter steel needles vertically suspended in a gelatin gel (n=1.3595) within a PET flask (n=1.66, 5.5 cm diameter, 1 mm thick walls). In the lower right panel, the difference image of the n=1.341 and 1.362 scans illustrates radial distortion of increasing magnitude with distance from the center of the flask. White features correspond to the n=1.362 scan. Black features correspond to the n=1.341 scan. The maximum discrepancy in this case is about 0.5 mm. The upper right panel shows the radial compression of reconstructed needle positions as a function of the refractive index of the water-bath fluid. The amount of radial distortion was found to be linear with radial position for a given refractive index of the water-bath. This plot therefore shows the radial distortion as a fixed percentage, applicable to all radii, for a given refractive index. Discrepancies are relative to the radial needle positions determined from the gold-standard x-ray CT scan. Error is on the order of the data marker size.
The final distortion experiment involved optical-CT scanning BANG3 gel-dosimeter needle phantoms pre- and post-irradiation. Overlay images for two phantoms are shown in Fig. 10. Needle positions appear indistinguishable in the two scans. The lack of distortion in these scenarios suggests that 1st generation photodiode-based scanning is relatively insensitive to geometrical distortion because refracted beams can only be detected by the photodiode up to a certain angle before being lost completely. This cannot be said for line or area detector designs,5,6 which may be more sensitive to distortion effects.
Fig. 10.
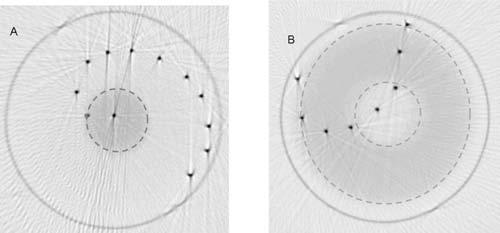
Overlay images (pre- and post-irradiation) of optical-CT scans of two gel-dosimetry needle phantoms, spiral (a) and arc (b). Pre irradiation, both flasks contained un-irradiated gel exhibiting uniform refractive index and attenuation. The left flask was irradiated with a single circular radiosurgery beam of 1.5 cm diameter. The flask on the right was irradiated by a large circular field containing a central circular block. The dashed lines demarcate irradiated areas. Negligible distortion was observed in the overlay of the needle positions pre- and post irradiation in either image. Streaking artifacts are a byproduct of the use of needles, which are completely non-transmitting and reflective (Ref. 3).
C. Absolute measurement of optical attenuation coefficient
The application of the corrections described above affects the absolute values of the attenuation coefficients reconstructed in optical-CT. Figure 11(a) illustrates the progressive effects of these corrections in the case of the absorbing finger phantom. The drift and water-bath corrections slightly improve the reconstruction accuracy of some of the fingers, while leaving others effectively unchanged. This is consistent with the fact that water-bath and drift effects can affect localized regions of the reconstruction. A more significant, global improvement arises from the refraction/reflection correction. The largest disagreement between optical-CT and spectrophotometer over a reconstructed value of a finger was under 4%. The global nature of the refraction correction is illustrated in Fig. 11(b), which shows profiles through the reconstruction of a uniform liquid dyed with food coloring before, and after, the refraction/reflection correction. The precorrection reconstruction shows both the artificially attenuating wall artifact and the corresponding, nonuniform depression of the reconstructed values inside the flask. Nowhere in the flask is the nominal attenuation value (as measured independently with a spectrophotometer) of 0.02 mm−1 reached. In fact the interior flask is reconstructed with negative attenuation throughout. Applying the refraction correction yields a uniform attenuation value throughout the flask that is in agreement with the spectrophotometer.
Fig. 11.

Correlation of optical attenuation coefficients determined by optical-CT and spectrophotometer measurement. The data in (a) were obtained from finger phantoms containing four dyed fingers, of varying attenuation, and shows the effect of applying successive corrections. The data in (b) were obtained from a uniform dyed phantom and illustrates the global nature of the refraction correction. The data in (c) were obtained from irradiated BANG3 phantoms and illustrate the problem of forward-scatter on absolute attenuation measurements. Due to initial unfamiliarity with this particular formulation of BANG gel, some samples were compromised between the radiation and measurement stage. The data should not be taken as indicative of the dose response of the BANG gel, though the comparative measurements of optical-CT and spectrophotometer are still valid. Error in (a) and (c) is on the order of the data marker size.
Figure 11(c) illustrates the difficulty of determining absolute attenuation coefficients by optical-CT in a scattering medium. The resulting line fit, y=0.94*x, indicates that although the corrections were successful in removing the offset in reconstructed values due to other artifact sources, a shallow slope was still achieved due to the confounding presence of scattered light. Closing the collimator still further may have improved this result, but increased data loss makes this solution impractical for many dosimetric applications.
IV. CONCLUSIONS
The quality of optical-CT projection data and reconstructed images was improved through modifications to the scanner and the application of correction techniques. Projection data stability and symmetry was improved by mounting the photodiode on the traveling arm to maintain constant optical path length between the gel dosimeter and the detector and removing components with sensitivity to the angle of incident light. A “water-bath-tracking” technique was found to be more effective in correcting for instrument drift than the standard reference diode technique when interference filters are incorporated in the scanner. The origin of ring artifacts in reconstructed images was traced to imperfections in the walls of the Lucite water-bath. These artifacts were found to be minimal for a new glass water-bath incorporating anti-reflection coating. Remaining water-bath effects were corrected out using baseline scans. Refraction and reflection artifacts were minimized through the use of baseline correction scans of the flask containing water-bath fluid and splicing calculated values into localized regions of data loss at the edges of the flask.
Needle phantoms (Fig. 5) were found to be an effective tool for the quantification of geometrical distortion. A radial distortion effect was observed, with greater distortion at greater radial distances. The effect was minimized by adjusting the refractive index of the water-bath (Fig. 9) and, under this condition, the maximum discrepancy was less than 0.3 mm. Radiation-induced distortion in BANG3 gels was found to be negligible in 5.5 cm diameter flasks (Fig. 10).
Finger phantoms were found to be useful for examining the accuracy of reconstructed attenuation coefficients with respect to independent measurement via spectrophotometer. A negative offset was observed in raw optical-CT reconstructed attenuation coefficients due primarily to the regions of lost data. Application of the reflection/refraction corrections brought the optical-CT reconstructed values into agreement with the spectrophotometer. For BANG3 polymer gels significant depression of reconstructed values was observed under conditions of poor collimation such that a significant amount of scattered light reached the collecting photodiode. Even under conditions of good scatter rejection, slightly depressed values were observed when compared with a spectrophotometer [Fig. 11(c)]. This limitation should not translate directly into the clinical realm where optical-CT measurements are converted to dose. The attenuation-to-dose calibration can accommodate any consistent proportional difference from the absolute attenuation values.
In summary, this paper illustrates a number of artifacts that can occur in optical-CT dosimetry, and presents a number of approaches to minimize and correct for these effects.
ACKNOWLEDGMENTS
This work is supported by NIH Grant No. CA100835-01. We are very grateful to Yevgeney Vinogradskiy for his assistance with experimental work and development of the OCTGUI.
References
- 1.Gore JC, Ranade M, Maryanski MJ, Schulz RJ. Radiation dose distributions in three dimensions from tomographic optical density scanning of polymer gels. I. Development of an optical scanner. Phys. Med. Biol. 1996;41:2695–2704. doi: 10.1088/0031-9155/41/12/009. [DOI] [PubMed] [Google Scholar]
- 2.Maryanski MJ, Zastavker YZ, Gore JC. Radiation dose distributions in three dimensions from tomographic optical density scanning of polymer gels. II. Optical properties of the BANG polymer gel. Phys. Med. Biol. 1996;41:2705–2717. doi: 10.1088/0031-9155/41/12/010. [DOI] [PubMed] [Google Scholar]
- 3.Kelly BG, Jordan KJ, Battista JJ. Optical CT reconstruction of 3D dose distributions using the ferrous-benzoic-xylenol ~FBX! gel dosimeter. Med. Phys. 1998;25:1741–1750. doi: 10.1118/1.598356. [DOI] [PubMed] [Google Scholar]
- 4.Oldham M, Siewerdsen JH, Shetty A, Jaffray DA. High resolution gel-dosimetry by optical-CT and MR scanning. Med. Phys. 2001;28:1436–1445. doi: 10.1118/1.1380430. [DOI] [PubMed] [Google Scholar]
- 5.Doran SJ, Koerkamp KK, Bero MA, Jenneson P, Morton EJ, Gilboy WB. A CCD-based optical CT scanner for high-resolution 3D imaging of radiation dose distributions: Equipment specifications, optical simulations and preliminary results. Phys. Med. Biol. 2001;46:3191–3213. doi: 10.1088/0031-9155/46/12/309. [DOI] [PubMed] [Google Scholar]
- 6.Wolodzko JG, Marsden C, Appleby A. CCD imaging for optical tomography of gel radiation dosimeters. Med. Phys. 1999;26:2508–2513. doi: 10.1118/1.598772. [DOI] [PubMed] [Google Scholar]
- 7.Oldham M, Siewerdsen JH, Kumar S, Wong J, Jaffray DA. Optical-CT gel-dosimetry I. Basic investigations. Med. Phys. 2003;30:623–634. doi: 10.1118/1.1559835. [DOI] [PMC free article] [PubMed] [Google Scholar]
- 8.Islam KT, Dempsey JF, Ranade MK, Maryanski MJ, Low DA. Initial evaluation of commercial optical CT-based 3D gel dosimeter. Med. Phys. 2003;30:2159–2168. doi: 10.1118/1.1593636. [DOI] [PubMed] [Google Scholar]
- 9.Jordan KJ. Development issues for optical-CT and gel-dosimetry; Proceedings of the Second International Conference on Gel Dosimetry, DOSEGEL, 2001; Brisbane, Australia. 2002; Queensland University of Technology; pp. 2–9. [Google Scholar]