

Abstract
In order to examine the effect of inhibition on processing auditory temporal information, responses of single neurons in the inferior colliculus of the chinchilla to sinusoidally amplitude-modulated (SAM) tones alone and the presence of a steady-state tone were obtained. The carrier frequency of the SAM tone was either the characteristic frequency (CF) or a frequency in the inhibitory response area of a studied neuron. When the carrier frequency was set to the neuron’s CF, neurons responded in synchrony to the SAM-tone envelope, as expected. When the carrier frequency was set to a frequency at which pure tones produced inhibition, SAM tones elicited little or no response, also as expected. However, when the same SAM tone was paired with a pure tone whose frequency was set to the neuron’s CF, responses synchronized to the SAM tone envelope were obtained. These modulated responses were typically one-half cycle out-of-phase with the response to the SAM tone at CF, suggesting that they arose from cyclic inhibition and release from inhibition by the SAM tone. The results demonstrate that the representation of temporal information by inferior colliculus neurons is influenced by temporally-patterned inhibition arising from locations remote from CF.
Keywords: amplitude modulation, inhibition, inferior colliculus, physiology, chinchilla
Abbreviations: CAP compound action potential, CF characteristic frequency, CMR comodulation masking release, dB SPL deciBels sound pressure level, DNLL dorsal nucleus of the lateral lemniscus, Fc carrier frequency, Fm modulation frequency, GABA gamma aminobutyric acid, Hz Hertz, IC inferior colliculus, kHz kilohertz, MTF modulation transfer function, PST peri-stimulus time, RA response area, RLF rate-level function, SAM sinusoidally amplitude modulated, VS vector strength
Introduction
Sinusoidally amplitude-modulated (SAM) signals are useful for characterizing auditory temporal processing (Javel 1980; Rees and Møller 1987; Langner and Schreiner 1988; Rees and Palmer 1989; Frisina et al. 1990a,b; Gooler and Feng 1992; Krishna and Semple 2000; Frisina 2001; Sinex et al. 2002a; Caspary et al. 2002). In most studies, a tonal or narrowband noise carrier has been placed at or near the characteristic frequency (CF) of a neuron, and parameters such as modulation frequency (Fm) or depth are varied. When the carrier frequency (Fc) of a SAM tone is excitatory, auditory neurons synchronize their discharges to the stimulus envelope, up to a cutoff frequency that varies across anatomical locations and neuron types. In general, the upper cutoff frequency for synchronization decreases at successively more central recording sites. In the inferior colliculus (IC), neurons exhibit synchrony up to Fm greater than 100 Hz. Other characteristics of the representation of excitatory SAM tones in the IC include a dependence of discharge rate on Fm, and the existence of bandpass tuning for Fm.
The processing of SAM signals with Fc placed away from CF has been described in much less detail, although the processing of this kind of signal is potentially important. Complex excitatory-inhibitory interactions occur in the IC, and there is evidence that IC neurons may integrate information across bandwidths substantially larger than the excitatory bandwidth represented by frequency tuning curves or isointensity response maps (Ryan and Miller 1978; Ehret and Merzenich 1988; LeBeau et al. 2001; Snyder and Sinex 2002; Nataraj and Wenstrup 2005, 2006). Inhibition, including that which arises in frequency regions away from CF, contributes to shaping synchronized responses to SAM. For instance, inhibition is partially responsible for the decline in phase-locking to the envelope at high modulation frequencies (Rees and Møller 1987; Yang and Pollak 1997; Burger and Pollak 1998; Caspary et al. 2002). At the same time, inhibition may also enhance synchronization to the temporal envelope (Frisina et al. 1990b) and improve the selectivity of such synchronization (Backoff et al. 1999). Also, measurements of the responses to complex sounds other than SAM tones suggest that temporally-patterned, off-CF inhibition plays a pivotal role in creating distinctive temporal discharge patterns (Sinex et al. 2002b; Sinex et al. 2005).
Integration of information across frequency is also important in auditory perception. Phenomena such as comodulation masking release (Hall et al. 1984), modulation detection interference (Yost and Sheft 1994), and auditory grouping (Darwin and Carlyon 1995) are mediated in part by comparisons of the temporal envelope in widely-spaced frequency bands, but the neural mechanisms that support those comparisons are poorly understood.
Mechanisms of across-frequency interaction, especially those involving inhibition, require further investigation (Verhey et al. 2003). The present study examined the representation by IC neurons of SAM tones with Fc placed at frequencies that had been identified as inhibiting the response to CF tones. In some structures and preparations, it is possible to investigate inhibitory inputs by monitoring the effects of stimuli on spontaneous discharge rate (Young and Brownell 1976); however, units in the IC of anesthetized animals show little or no spontaneous activity. To produce ongoing spike discharges that could be inhibited, a steady-state CF tone was presented simultaneously with tones at other frequencies and levels to identify the range of stimuli that inhibited the response to the CF tone (Portfors and Wenstrup 2002). One of those inhibiting frequencies was chosen as the carrier frequency for SAM tones. The representation of that SAM tone, and its interaction with an excitatory CF tone was examined.
Methods
Animal preparation and data collection
Responses were obtained from single neurons in the IC of the adult chinchilla. Animals were anesthetized by an initial intraperitoneal injection of Dial in urethane (0.5 ml/kg of a solution containing 40 mg/ml of diallybarbituric acid [Sigma] and 40 mg/ml of urethane [Sigma]), and supplemental injections were given as needed to maintain the animal in an areflexive condition. A tracheotomy was performed, and body temperature was maintained at 37º C with a heating pad (Harvard Apparatus). All procedures were approved by the Institutional Animal Care and Use Committee at Arizona State University.
The animal was placed in a rigid headholder in a double-walled sound-attenuating booth (Acoustic Systems). The bulla was opened, and a silver-chloride ball electrode was placed on the round window to monitor the compound action potential (CAP). CAP was checked periodically, and the experiment was terminated if a shift in CAP thresholds greater than 10 dB was observed. The pinna and the outer portion of the external auditory meatus were removed bilaterally. Sound delivery tubes were sealed into remaining ear canal with ear impression material (Audalin). A craniotomy was performed and a small portion of non-auditory cerebral cortex was aspirated to expose the dorsal surface of the IC.
A glass-coated carbon fiber electrode (Kation Scientific) with a sharp tip (<1 μm) and an impedance of 0.4 – 0.8 MΩ (tested @ 1 kHz) was placed on the surface of the IC about 2 mm from midline under visual control and advanced with a hydraulic microdrive (Trent-Wells). Extracellular activity of isolated single neurons was filtered, amplified (WPI DAM50), and discriminated from background activity (TDT PC1 and SD1). Spike times were measured with a resolution of 1 μsec (TDT ET1), and stored in a computer.
The electrode penetrated the IC in a parasagittal plane. Neurons recorded at depths greater than about 1 mm below the dorsal IC surface exhibited sharp tuning and secure short-latency responses to tone bursts, and their CFs increased with depth. These properties are consistent with other reports of the responses of neurons in the central nucleus of the IC (Merzenich and Reid 1974; Langner and Schreiner 1988; Nuding et al. 1999). The locations of recording sites were not verified histologically. However, electrodes were aimed at stereotaxic coordinates that had been found to correspond to the central nucleus in previous experiments that did use histological verification (Nuding et al. 1999). By stereotaxic and physiological criteria, all of the data reported here are believed to have been obtained from the central nucleus.
Stimulus generation and experimental design
Stimulus generation and presentation were controlled by custom software written in Matlab and running on the same computer used for data acquisition. The software synthesized waveforms, passed them to two digital-analog converters (TDT DA3), one for each ear, and regulated the level of the waveforms with programmable attenuators (TDT PA4). The signals were lowpass filtered at 20 kHz (TDT FT6) for anti-aliasing and delivered to earphones (Beyer DT48). The acoustic system was calibrated for each experiment with an Etymotic ER7 probe-tube microphone placed in the ear canal within a few mm of the tympanic membrane.
Pure tone bursts with varying frequency and intensity were presented to measure the excitatory response area (RA) of each studied neuron (Nuding et al. 1999). Tonal frequency was varied in 4 or 6 steps per octave, and tonal intensity was varied in steps of 15 or 20 dB. Each tone burst was presented once or twice in random order. Tone bursts were 300 ms long with 5 msec rise/fall times and were nearly always presented monaurally to the contralateral ear. CF was estimated from the peak of the excitatory RA at the lowest intensity at which driven responses were observed. A more detailed rate level function (RLF) was obtained by presenting pure tone bursts at CF; the RLF was estimated with 10 dB steps, and each tone burst was presented at least 15 times. This measurement was used to obtain a more precise estimate of the threshold at CF and to classify the neurons according to the shape of the peristimulus time (PST) histogram. In the present study, the neurons were placed into one of three categories based on the PST histogram: pauser, sustained and onset. Neurons with other discharge patterns were sometimes encountered but were not studied. Pauser neurons exhibited a transient response with a first-spike latency less than 15 msec, followed by a silent interval that could last for several msec and an additional sustained response. Sustained neurons also had first-spike latencies less than 15 msec but responded throughout the stimulus duration. Onset neurons exhibited a transient response to the beginning of the stimulus but were silent afterwards. Many onset neurons responded poorly to SAM tones (Sinex et al. 2002a). For that reason, onset neurons were often manually tested with amplitude-modulated signals before they had been fully characterized. If the onset neuron exhibited synchrony to the envelope of an excitatory SAM tone, it was completely characterized as described above. Otherwise, no further measurements were attempted, and the electrode was advanced to search for neurons that were more responsive to SAM tones.
A second measurement of frequency selectivity referred to as an "inhibitory RA" was also made. The stimulus parameters for this measurement were similar to those for the excitatory RA measurement, except that two tone bursts were gated simultaneously. One tone burst, the “background tone”, had a fixed frequency matching the neuron’s CF, and a fixed level, normally 10 dB above the pure tone threshold at that frequency. The second tone varied in frequency and intensity as the single tone did in the excitatory RA measurement. The inhibitory RA measurement revealed regions of frequency and intensity in which tones inhibited the response to the background tone. Stimuli within these regions will be referred to as falling “in the inhibitory RA”.
After the neuron’s responses to pure tones had been characterized, SAM tones were presented. SAM tones were 500-msec long with 5-msec cosine ramps. Modulation depth was always 100%. SAM tones were presented alone and were also paired with steady-state tones. First, a SAM tone with Fc matching the neuron’s CF was presented (SAMCF, see Fig. 1A). Fm was varied, usually from 4 Hz to 1024 Hz. SAM tones were presented at levels from 20 to 60 dB SPL, but usually at 50 or 60 dB SPL. Each tone was presented at least 15 times to accumulate enough spikes to permit discharge rate and synchronization to Fm to be estimated. Vector strength (VS, Goldberg and Brown 1969) was calculated over the modulation period to obtain measures of the magnitude and phase of synchronization to the stimulus envelope. For this calculation, the onset of the analysis window was delayed by one or more full modulation cycles, so that spikes occurring near the onset of the stimulus were omitted from the analysis. VS was judged to be statistically significant if the Rayleigh coefficient (Rhode 1976) was significant at the α ≤ 0.001 level.
Figure 1.
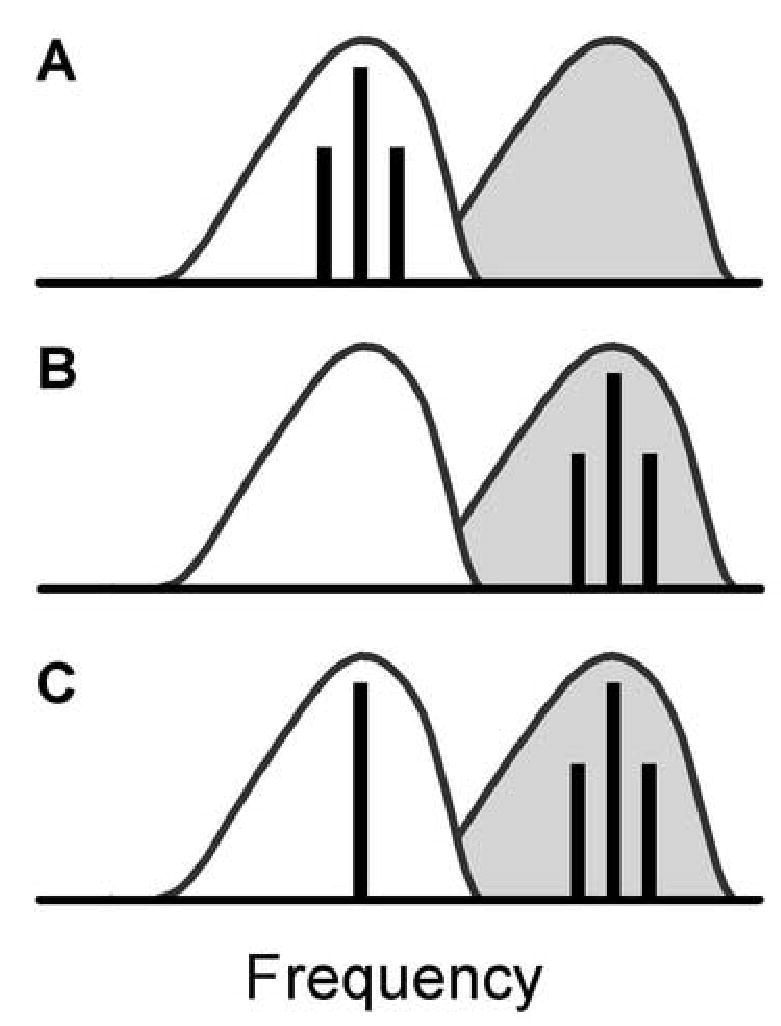
Schematic representation of SAMCF (A), SAMI (B), and SAMI+TONECF (C) stimulus conditions. The unshaded area indicates the excitatory RA of a hypothetical neuron, while the shaded area to the right of the excitatory RA indicates the inhibitory RA. Vertical lines indicate the placement of pure tones (one line) or SAM tones (three lines) relative to the RAs.
Next, these measurements were repeated with a different Fc, chosen to fall in the inhibitory RA (SAMI, Fig. 1B). Some Fm and SPL conditions were omitted since neurons typically did not respond to SAMI tones presented alone. Finally, a third set of measurements was obtained, in which the SAMI tone was paired with a pure tone at CF (SAMI+TONECF, see Fig. 1C). These two tones were presented simultaneously at equal overall SPL. In summary, there were 3 stimulus conditions that included amplitude-modulated tones: 1) SAMCF alone, 2) SAMI alone, and 3) paired SAMI+TONECF.
Results
The results reported here are representative of the responses of 95 single neurons from 23 chinchillas. The CF’s of tested neurons were distributed from 0.12 to 14 kHz. The sample included 62 pauser neurons (65% of the total), 13 sustained neurons (14%) and 20 onset neurons (21%). These proportions are different than in some previous studies (Nuding et al. 1999; Palombi and Caspary 1996; Sinex et al. 2002a) since, as described above, the sample was biased toward neurons most likely to respond to modulated tones and thus against onset neurons.
Responses of single IC neurons to SAM tones
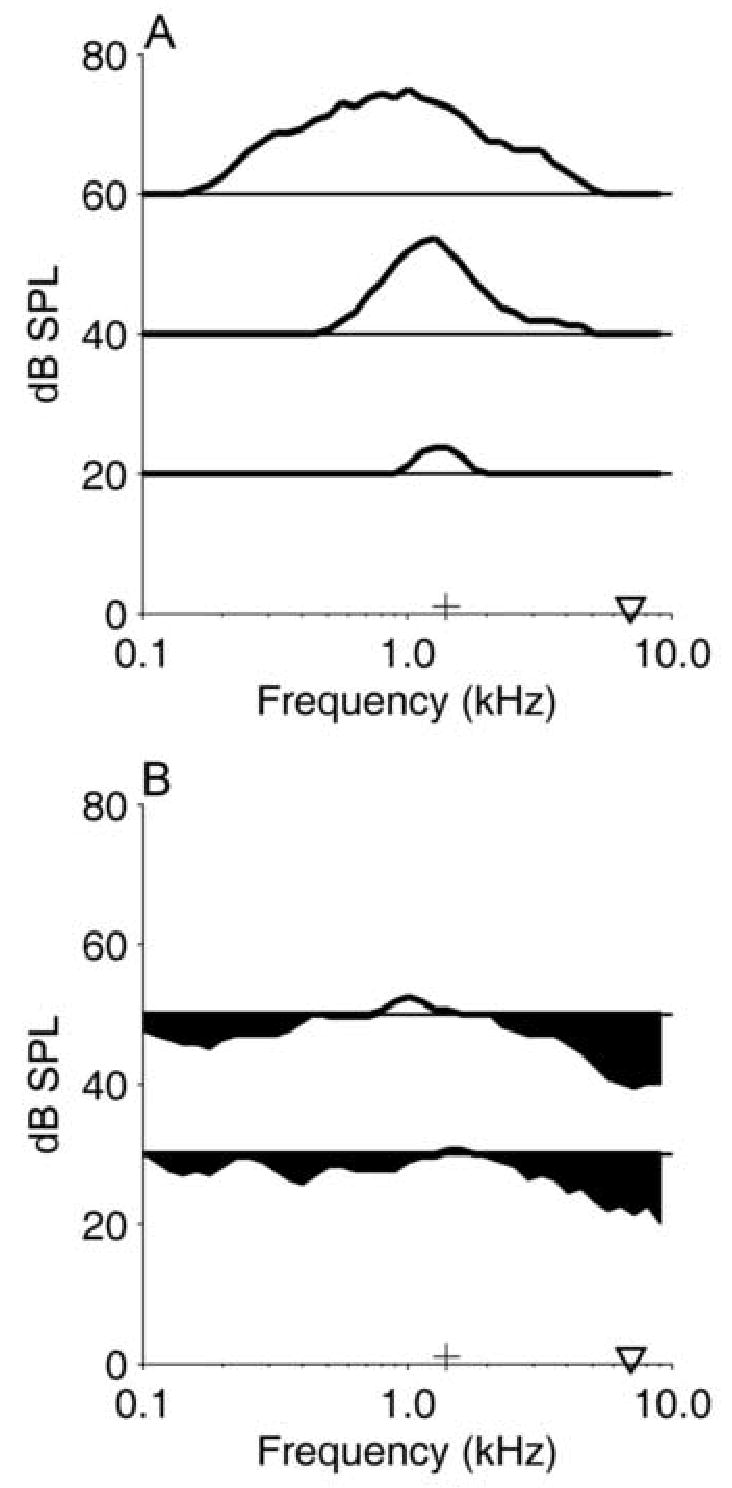
Responses of a representative IC pauser neuron are shown in Figs. 2 and 3. The neuron’s CF, estimated from the RA at 20 dB SPL, was approximately 0.8 kHz (marked by the + in Fig. 2A). It can also be seen that the frequency that elicited the maximum response shifted to slightly lower frequencies at higher SPLs (Nuding et al. 1999). The inhibitory RA, measured with the fixed background tone at 0.8 kHz (the neuron’s CF) and 20 dB SPL, is shown in Fig. 2B. The inhibitory RA revealed that 40 dB SPL tones with frequencies between 0.1–0.3 and 1–2 kHz strongly inhibited the response to the background tone at CF (Fig. 2B). Tones at 20 dB SPL had little effect on the response to the background tone. Maximum inhibition was observed at 1.4 kHz, 40 dB SPL, so that tone frequency was chosen as the Fc for SAMI.
Figure 2.
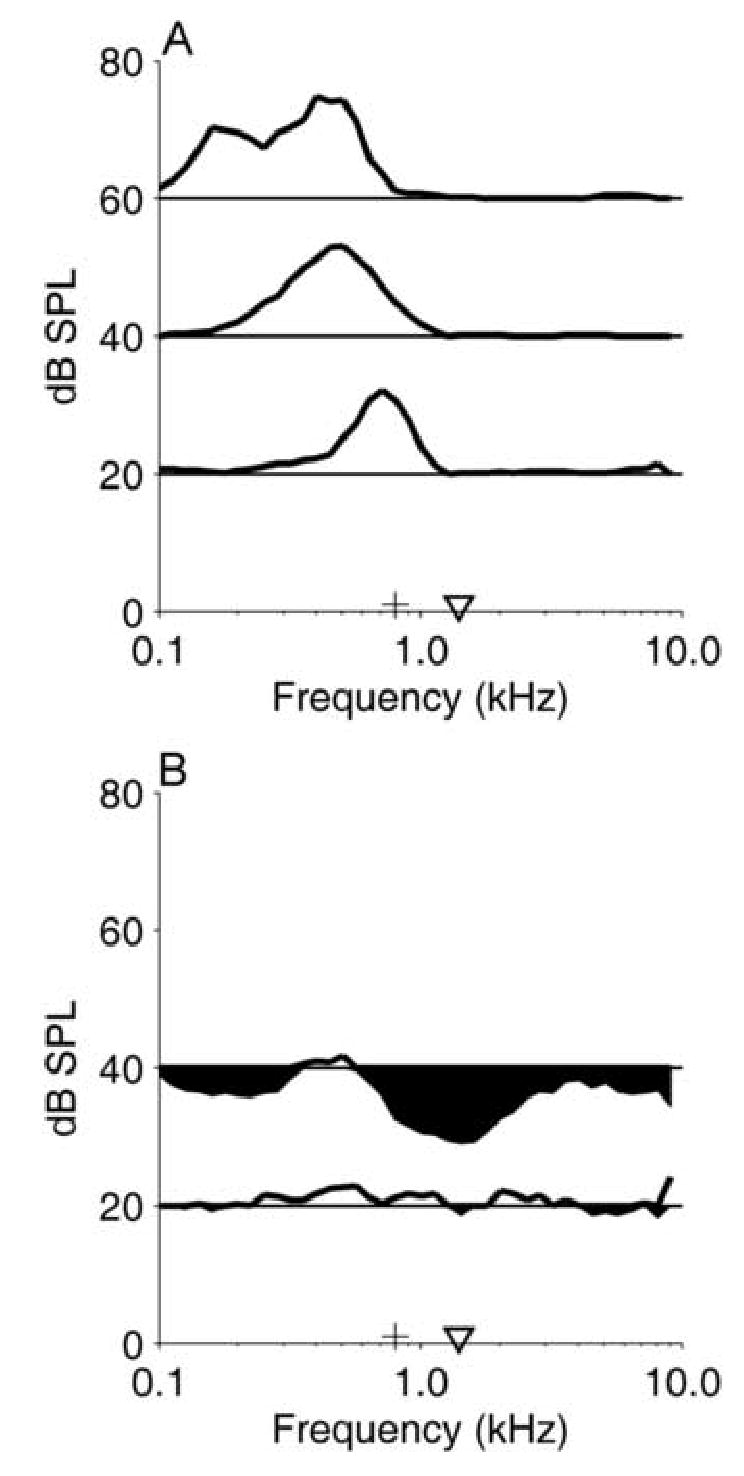
A: Excitatory RA for one representative IC neuron. Each line depicts the isointensity RA at one SPL, plotted so that the horizontal lines at 20, 40, and 60 dB SPL represent 0 spikes/sec at the indicated SPL. The maximum discharge rate obtained at 60 dB SPL was 31 sp/sec, and the vertical scale for discharge rate is the same for each line. The + marks the neuron’s CF (0.8 kHz), which was also Fc for SAMCF tones. The inverted triangle marks Fc for SAMI tones, 1.4 kHz. Neuron 0201-04, CF=0.8 kHz, pauser PST.
B: Inhibitory RA for the same neuron. In this panel, the horizontal lines at 20 and 40 dB SPL represent the average response to the fixed background tone at 0.8 kHz, 20 dB SPL. Rate increases are shown by the line, and rate decreases are indicated by shading below the horizontal line. The vertical scale for discharge rate and the symbols are the same as in Panel A.
Figure 3.
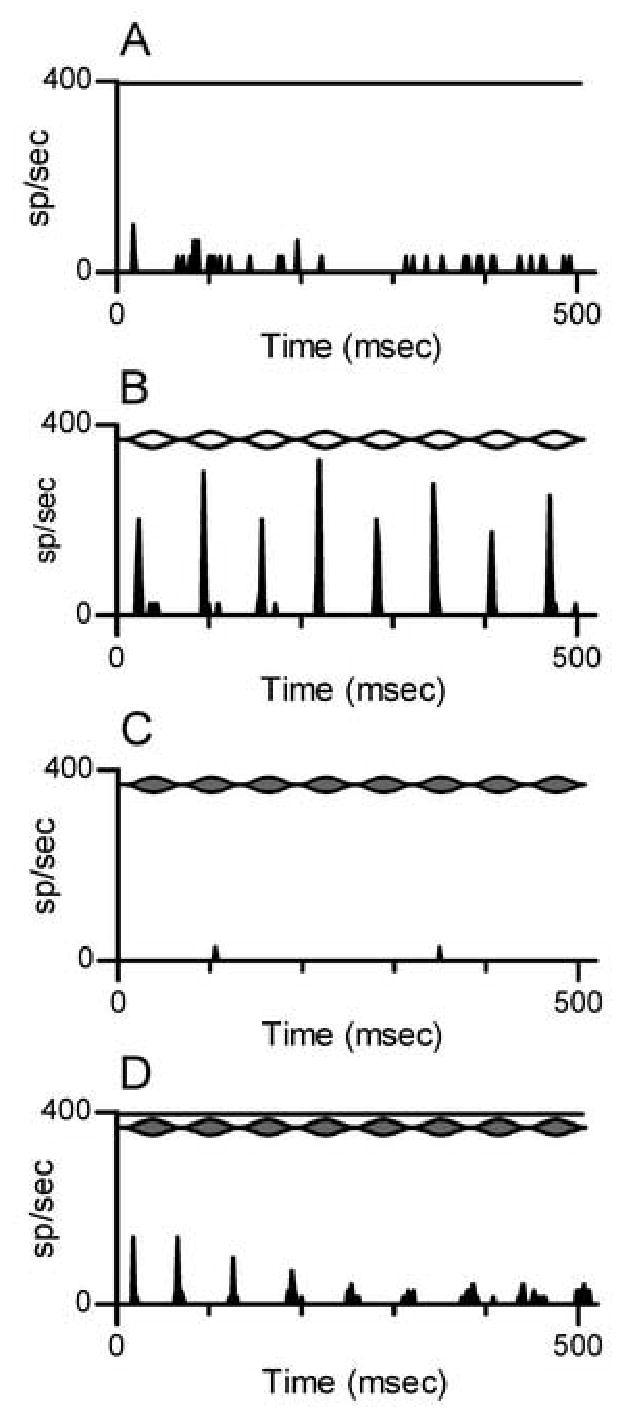
Discharge patterns obtained from the neuron shown in the previous figure. Lines at the top of each panel mark the envelope of a modulated tone and/or the duration of a steady-state tone. PSTH bin width = 2 msec.
A: Responses to a steady-state tone (TONECF). Frequency=0.8 kHz, 40 dB SPL.
B: Responses to a SAMCF tone. Fc=0.8 kHz, 40 dB SPL, Fm=16 Hz.
C: Responses to a SAMI tone with Fc=1.4 kHz. All SAM tone parameters except Fc were the same as in Panel B.
D: Responses to paired SAMI and TONECF.
The same neuron’s responses to steady-state and SAM tones are shown in Fig. 3. Responses to TONECF alone (Fig. 3A) were modest, in keeping with the leftward shift of the excitatory RA at 40 dB SPL (Fig. 2A). The neuron was classified as a pauser, based on its responses to other more-effective tones, although that is difficult to see from this PST histogram. The overall discharge rate evoked by TONECF was 5.1 spikes/sec.
The neuron’s response to a SAMCF tone with Fm=16 Hz presented at 40 dB SPL is shown in Fig. 3B. The neuron exhibited a temporally-patterned response, similar to what has been observed in many previous studies: the response was synchronized to the envelope of the stimulus, and the majority of spikes tended to occur near the peaks of modulation cycles, at least for modulation cycles after the first. The overall discharge rate to this SAMCF tone was 13.6 spikes/sec.
Figure 3C illustrates the response, or absence of a response, to the SAMI tone with Fc=1.4 kHz, Fm=16 Hz, presented at 40 dB SPL. This stimulus failed to stimulate the neuron, as expected, since the carrier frequency was outside the excitatory RA (Fig. 2A). However, when the SAMI tone was paired with the steady-state TONECF, a modulated response was elicited (Fig. 3D). The temporal pattern of this response resembled that elicited by SAMCF (Fig. 3B), in that the neuron exhibited synchrony to individual cycles of the 16-Hz modulation. However, in this condition the majority of spikes (again, for modulation cycles after the first) occurred near envelope minima. That is, the response to SAMI+TONECF was approximately one-half cycle out-of-phase with the response to SAMCF. The likely explanation (discussed in more detail below) is that the temporally-patterned response to paired SAMI+TONECF was due to release from inhibition when the amplitude of the SAMI tone was at its minimum. Despite the presence of strong inhibition from the SAMI tone, the overall discharge rate in this condition was 5.8 spikes/sec, which was actually slightly higher than the response to the TONECF stimulus presented alone.
Effects of modulation frequency on discharge rate
Discharge-rate modulation transfer functions (MTF) for four pauser neurons are illustrated in Fig. 4. MTFs for SAMCF had bandpass (Fig. 4A and B) or lowpass (Fig. 4C and D) shapes, both of which are common in IC neurons studied with similar SAM tones (Rees and Møller 1987; Langner and Schreiner 1988; Rees and Palmer 1989; Krishna and Semple 2000; Caspary et al. 2002; Sinex et al. 2002a). The same neurons’ rate MTFs obtained with paired SAMI+TONECF stimuli are also shown for comparison. These MTFs were less easily summarized. In the first example, both MTFs were bandpass, but for paired SAMI+TONECF stimuli, the best modulation frequency was higher, approximately 32 Hz compared to 8–16 Hz for SAMCF tones (Fig. 4A). In the second example, the MTF for SAMCF tones was bandpass, but the MTF for SAMI+TONECF was lowpass and shifted toward lower Fm (Fig. 4B).
Figure 4.
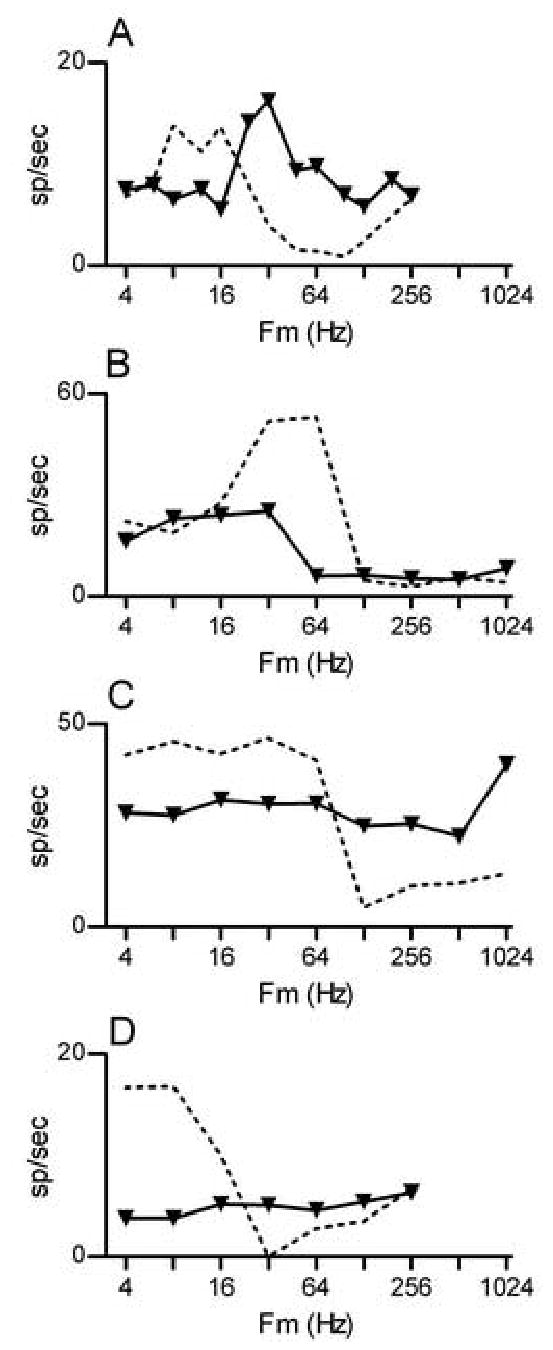
Discharge rate MTFs for four different pauser neurons. In each panel, the dashed line is the MTF for SAMCF tones, and the solid line with symbols is the MTF for paired SAMI+TONECF stimuli.
A. Neuron 0201-04, CF = 0.8 kHz. Fc for SAMI tones = 1.4 kHz, all tones presented at 40 dB SPL.
B. Neuron 0206-03, CF = 4.3 kHz, Fc for SAMI tones = 6.0 kHz, all tones presented at 50 dB SPL.
C. Neuron 0134-15, CF = 4.6 kHz, Fc for SAMI tones = 3.5 kHz, all tones presented at 30 dB SPL.
D. Neuron 0216-02, CF = 0.8 kHz, Fc for SAMI tones = 1.7 kHz, all tones presented at 50 dB SPL.
The other two neurons, for which rate MTFs for SAMCF tones were lowpass, exhibited little or no selectivity for Fm in paired SAMI+TONECF stimuli. These neurons did respond to those stimuli, even though SAMI tones presented alone were ineffective at eliciting spikes. The responses tended to occur at stimulus onset, and as the figure indicates, the number of spikes was generally independent of Fm.
As Fig. 4 suggests, MTFs obtained with paired SAMI+TONECF stimuli exhibited the same range of shapes as those obtained with SAMCF tones, although the proportions of MTF types differed. Bandpass MTFs were most common in responses to SAMCF tones, but flat MTFs were most common in responses to paired SAMI+TONECF stimuli. When the SAMI+TONECF MTF was not flat, there was a modest tendency for paired SAMI+TONECF stimuli to elicit an MTF with the same shape as the MTF elicited by SAMCF tones. In neurons that exhibited bandpass tuning for SAMCF tones, 19% of the SAMI+TONECF MTFs were also bandpass, although 58% of the SAMI+TONECF MTFs were flat. In neurons that exhibited lowpass tuning for SAMCF tones, 39% of the SAMI+TONECF MTFs were also lowpass, and 44% of them were flat.
Effects of modulation frequency on discharge synchrony
The temporal patterns of the responses of one pauser neuron to tones modulated at different frequencies are summarized in Fig. 5. Cycle histograms obtained at five different values of Fm are shown in Fig. 5A-E. Response modulation was observed in each Fm and SAM condition. Three additional trends can be seen in the cycle histograms. First, the phase lag of the response synchronized to the SAMCF tones increased with Fm (histograms marked by dotted lines), consistent with many previous observations of responses to modulated tones. Second, the phase lag of the response synchronized to SAMI tones also increased with Fm (histograms marked by solid lines). Third, the phase shifts were such that responses obtained in the two modulation conditions were consistently one-half cycle out of phase with one another; that is, the phase relation illustrated in Fig. 3 was maintained at other Fm. Figure 5F confirms that this pattern of response phases was observed over the entire tested range of Fm from 4 to 256 Hz.
Figure 5.
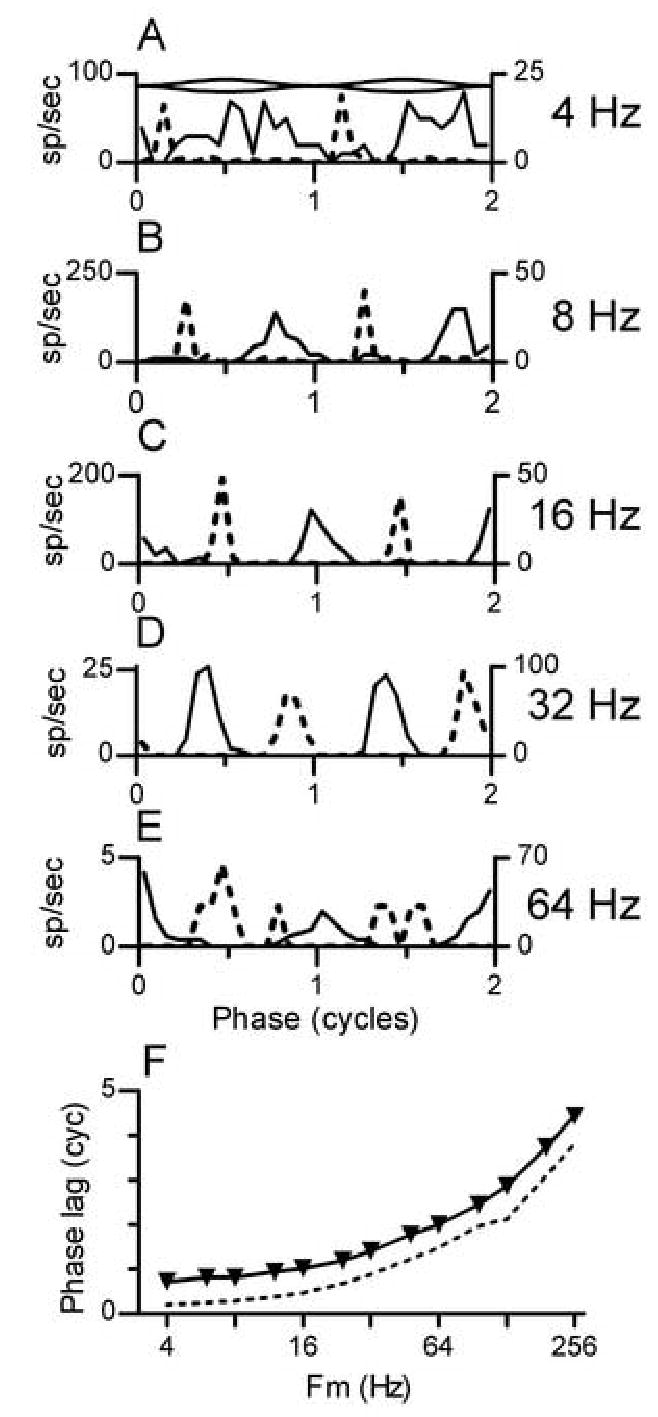
Difference in phase lag across SAM conditions. Each panel presents data for neuron 0201-04, for which data was also shown in Figs. 2 and 3. Cycle histograms were formed by folding spikes within a window that was two modulation periods wide. The window onset was delayed by one or more full modulation cycles, so that spikes occurring near the onset of the stimulus were omitted from the analysis and 0 cycles on the abscissa always represents a minimum in the amplitude envelope of the stimulus, as indicated by the schematic modulation envelope at the top of Panel A.
A. Dotted line: cycle histogram for the SAMCF tone presented at 40 dB SPL with Fm=4 Hz. Solid line: cycle histogram for the paired SAMI+TONECF stimulus with the same Fm and level.
B. Same as A for Fm=8 Hz.
C. Same as A for Fm=16 Hz.
D. Same as A for Fm=32 Hz.
E. Same as A for Fm=64 Hz.
F. Phase MTF for neuron 0201-04. Dashed line: responses to SAMCF tones. Solid line with symbols: responses to paired SAMI+TONECF stimuli.
Responses of onset neurons
The tendencies described above typically were not observed in onset neurons. In particular, onset neurons failed to exhibit modulated responses when SAMI tones were paired with steady-state tones. One example is illustrated in Figs. 6 and 7. The neuron’s excitatory RA, shown in Fig. 6A, indicated that although its CF (1.4 kHz) was less than 1 octave higher than that of the pauser neuron shown in Fig. 2, the onset neuron was more broadly tuned, especially for frequencies above CF. Extensive inhibitory sidebands were present, as shown in Fig. 6B, and tones at approximately 7 kHz and 50 dB SPL produced the most effective inhibition of the background tone at CF.
Figure 6.
Excitatory (A) and inhibitory (B) response areas for onset neuron 0134-13, CF=1.4 kHz. The maximum discharge rate obtained at 60 dB SPL was 12 sp/sec, and the vertical scale is the same for each line in each panel. See the description of Fig. 2 for additional details.
Figure 7.
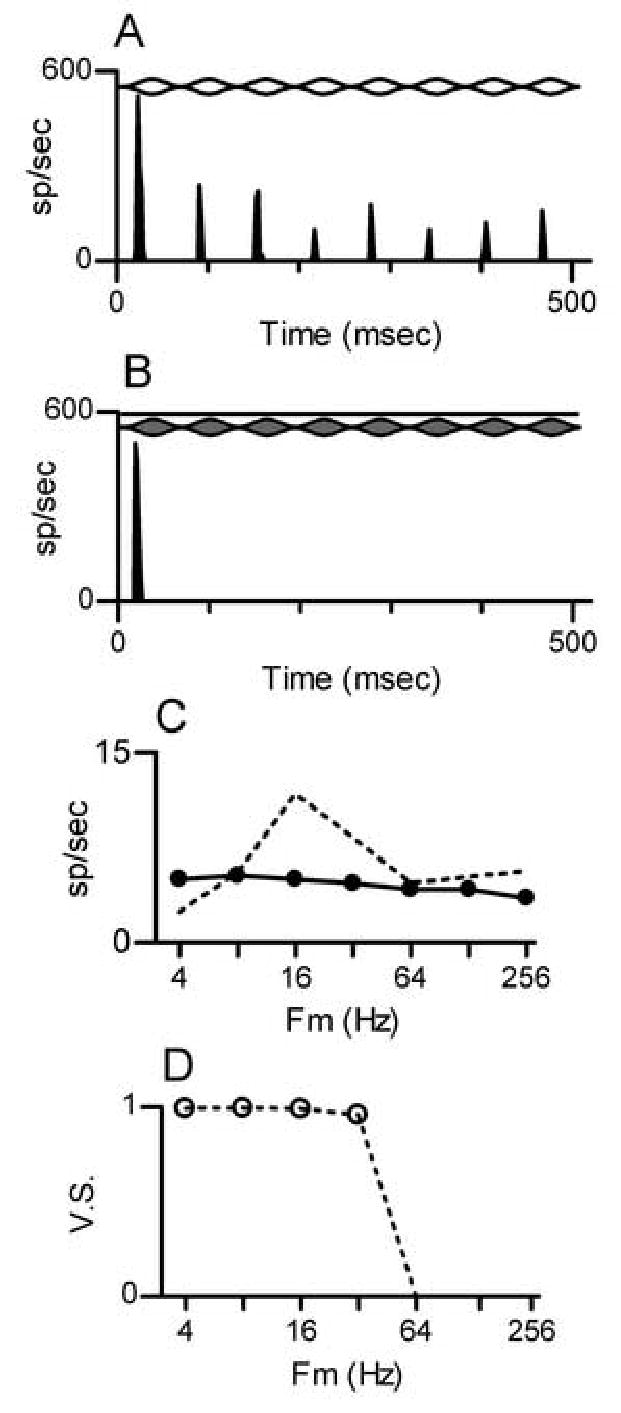
A: Similar to Fig. 3B, for the onset neuron shown in Fig. 6. Fc for the SAMCF tone = 1.4 kHz, Fm = 16 Hz, level = 50 dB SPL.
B. Similar to Fig. 3D, for the onset neuron shown in Fig. 6. Fc for the paired SAMI+TONECF stimulus = 7.0 kHz, Fm = 16 Hz, level = 50 dB SPL.
C. Discharge rate MTF, similar to Fig. 4, for the onset neuron in Fig. 6.
D. Temporal MTF for the onset neuron. Dashed line: VS as a function of Fm for SAMCF tones. If VS reached statistical significance as described in the text, the point is marked with a symbol. VS for paired SAMI+TONECF stimuli is not shown because statistically-significant values were not obtained at any Fm.
The response to a SAMCF tone with Fm=16 Hz is shown in Fig. 7A. As in the previous example, the neuron exhibited a short-latency response at stimulus onset, followed by a series of response peaks synchronized to the envelope in the SAMCF tone. In contrast, the SAMI+TONECF stimulus elicited a nearly-identical onset response but failed to elicit any subsequent modulated response (Fig. 7B). Comparable patterns were observed at other Fm, as summarized by the neuron’s rate MTF (Fig. 7C). The neuron exhibited bandpass selectivity for SAMCF tones. In contrast, for paired SAMI+TONECF stimuli, the response at each Fm was limited to a few spikes at onset, and the average discharge rate was independent of Fm. When spikes were elicited by the SAMCF tone, they were strongly locked to the modulation envelope; the temporal MTF (Fig. 7D) indicates that synchrony to Fm was essentially perfect for SAMCF tones modulated at rates up to 32 Hz.
Summary of discharge synchrony
Discharge synchrony across the population of neurons is summarized in Fig. 8. Each bar in each panel shows the percentage of neurons that exhibited statistically-significant VS at one Fm, for one SAM condition. Three trends are apparent in the figure. First, synchrony was more prevalent in pauser and sustained neurons, and so the remaining comments apply only to those two types of neurons. Second, synchrony was most prevalent in the midrange of Fm, from approximately 8 to 64 Hz. Third, although synchrony to SAMCF was observed in a slightly-higher proportion of neurons, SAMI+TONECF was also highly effective in eliciting temporally-patterned responses from IC neurons.
Figure 8.
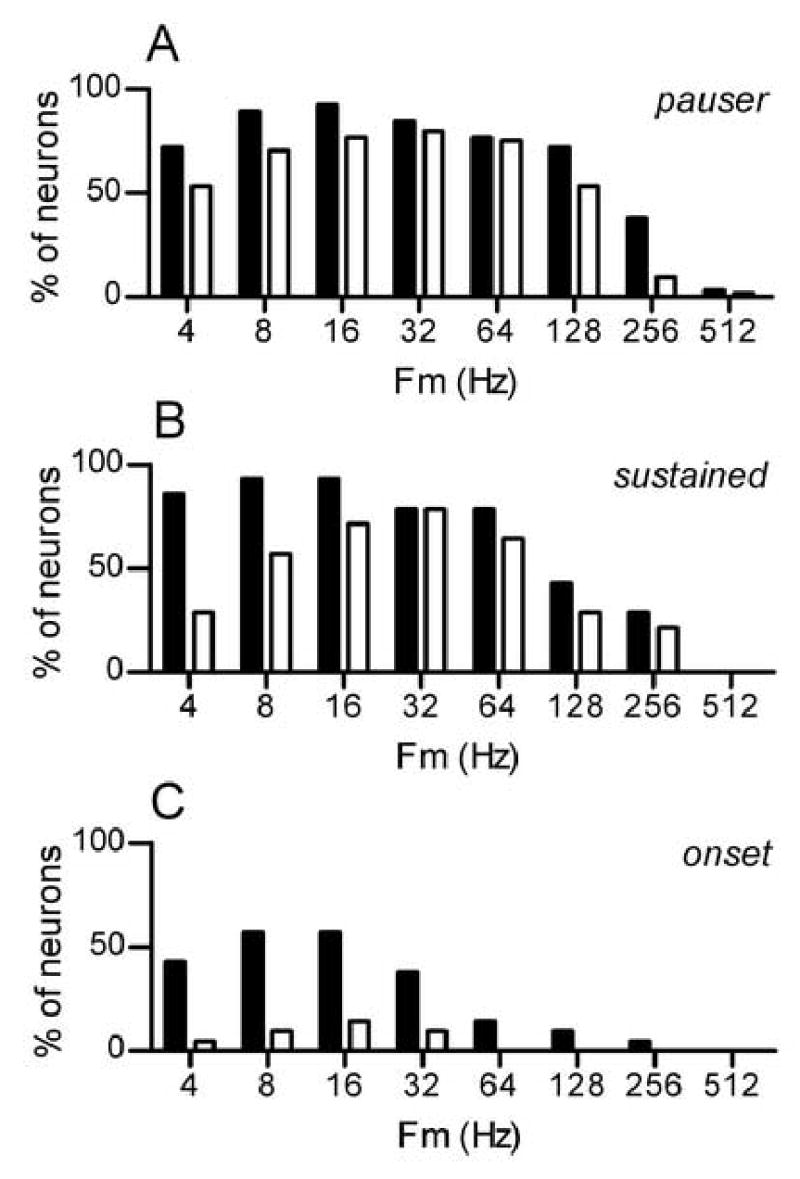
Prevalence of discharge synchrony to modulated tones. Each bar represents the percentage of neurons showing statistically-significant VS to a particular stimulus configuration. Shaded bars: responses to SAMCF tones. Unshaded bars: responses to paired SAMI+TONECF stimuli.
A. Responses of pauser neurons.
B. Responses of sustained neurons.
C. Responses of onset neurons.
Overall, synchrony was most prevalent for Fm=16 Hz, so additional summary measurements were made at that Fm. Although SAMI+TONECF stimuli elicited temporally-patterned responses, synchrony to these tones was slightly less precise the synchrony to SAMCF tones. This is shown in Fig. 9A, which illustrates the distribution of VS for the two SAM conditions. VS values greater than 0.9 were common at this Fm in response to SAMCF but rarely elicited by SAMI+TONECF stimuli. Consistent with that, the smallest values of VS, less than about 0.4, were less likely to be obtained in response to SAMCF tones.
Figure 9.
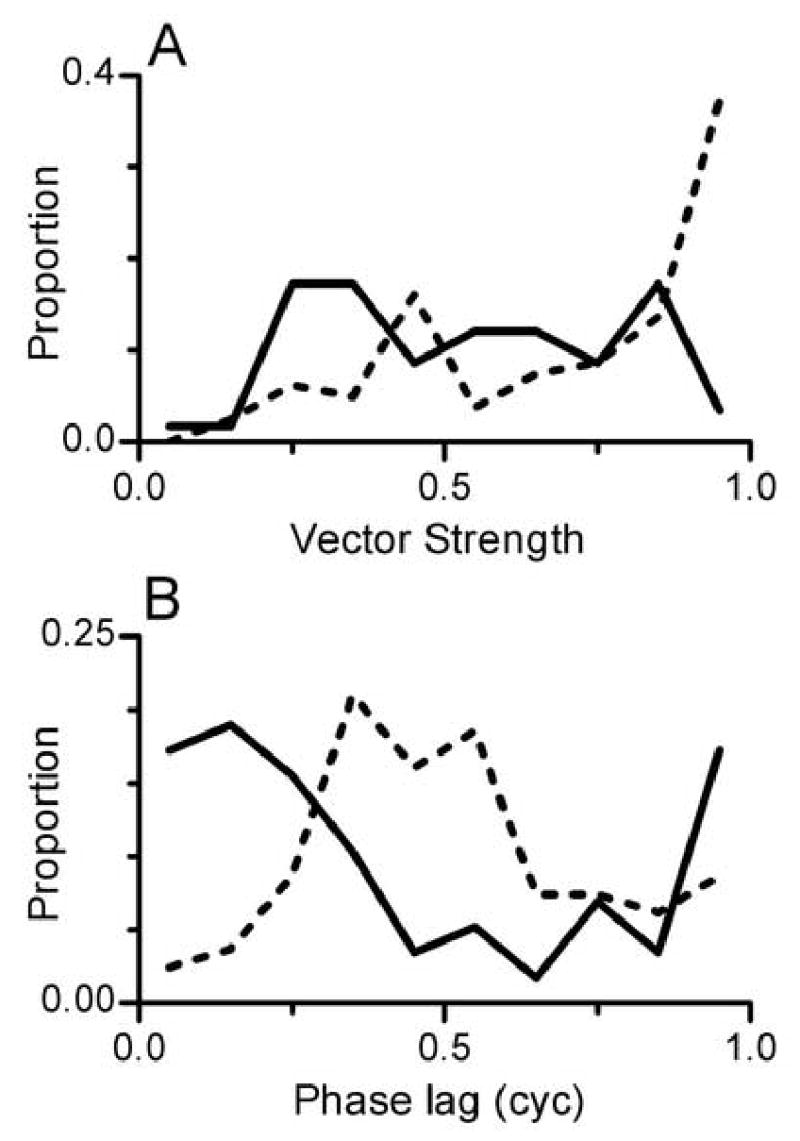
A. Distribution of VS in responses to tones modulated with Fm = 16 Hz. Dashed line: distribution of VS in response to SAMCF tones, from 81 cycle histograms. Solid line: distribution of VS in response to paired SAMI+TONECF stimuli, from 58 cycle histograms.
B. Distribution of phase lags in responses to tones modulated with Fm = 16 Hz. A phase lag of 0 or 1 cyc indicates a response at an amplitude minimum of the modulated envelope, and a phase lag of 0.5 cyc indicates a response at an amplitude maximum. Dashed line: distribution of phase lags in response to SAMCF tones, from the same dataset shown in Panel A. Solid line: distribution of phase lags in response to paired SAMI+TONECF stimuli, from the same dataset shown in Panel A.
The distribution of response phase lags for the two SAM conditions is shown in Fig. 9B. As suggested by previous examples, response phases for SAMCF tones at this particular Fm clustered around lags of 0.4–0.5 cycle, corresponding to the peak of the modulated envelope. In contrast, response phases for the SAMI+TONECF stimulus clustered around lags of 0 or 1 cycle, corresponding to the valley of the modulated envelope. As noted previously, the phase difference between the two conditions was approximately 0.5 modulation cycles.
Discussion
Responses to SAM stimuli were recorded from neurons located in the inferior colliculus of the chinchilla. SAM tones with Fc placed at the neurons’ CFs elicited responses that were consistent with what has been reported in many previous studies with similar sounds (Rees and Møller 1987; Langner and Schreiner 1988; Rees and Palmer 1989; Gooler and Feng 1992; Krishna and Semple 2000; Caspary et al. 2002; Sinex et al. 2002a). Neurons were also studied with SAM tones having Fc placed at a frequency away from CF at which tones were known to inhibit responses to CF tones; responses of IC neurons to SAM tones with these characteristics has not previously been described. These SAMI tones usually did not elicit responses when presented alone. However, when paired with steady-state CF tones, SAMI tones elicited responses that were synchronized with the stimulus envelope. Responses evoked by paired SAMI+TONECF stimuli exhibited some of the same properties as responses elicited by more commonly-used excitatory SAM tones; for example, bandpass and lowpass tuning for Fm were observed (e.g., Fig. 5). Selectivity for Fm for paired tones did not match the selectivity observed with excitatory SAM tones, indicating that the neurons that provide inhibitory input to IC neurons have different, and sometimes better, temporal resolution than the IC neurons themselves (Casseday et al. 1997). Overall, the results have implications for the integration of temporal information across frequency by IC neurons.
Inhibition in the representation of temporal information
IC neurons receive inhibitory projections from a number of sources, including but not limited to the lower brainstem (Oliver and Shneiderman 1991; Merchán et al. 1994; Saint Marie and Baker 1990). Inhibition acting on the neurons that provide excitatory input to the IC will also influence the responses of IC neurons; however, the procedures used here cannot separate effects of inhibition arising at one level from effects arising at a different level. Although these inputs can be assumed to have important physiological consequences, those consequences have only rarely been measured directly.
One potential role of inhibitory inputs is to improve, or at least alter, frequency resolution (Ehret and Moffat 1985; Ehret and Merzenich 1988; Casseday and Covey 1992; Palombi and Caspary 1996; LeBeau et al. 2001), a function analogous to the role of lateral inhibition in the visual (Kuffler 1953) and somatosensory systems (Gardner and Kandel 2000). Inhibition has also been shown to influence auditory temporal processing (Frisina et al. 1990b; Backoff et al. 1999; Lu et al. 1998; Koch and Grothe 1998; Caspary et al. 2002; Nataraj and Wenstrup 2005, 2006). For example, when inhibition is blocked by local application of bicuculline, many IC neurons become less selective for frequency (Koch and Grothe 1998) or amplitude modulation (Caspary et al. 2002). Those results indicate that the ability of an IC neuron to represent the envelope is constrained by inhibitory inputs; from this it could be concluded that the functional effect of inhibition is primarily to adjust modulation bandwidth. The present results extend these previous findings by demonstrating a clear effect of inhibition on the responses of IC neurons that is more than a simple bandwidth control. Rather, these results indicate a more significant role for off-CF inhibition, one that would allow IC neurons to integrate temporal information across spectral frequency (Verhey et al. 2003). Some implications of this integration are discussed below.
The “release and rebound” mechanism
For paired SAMI+TONECF stimuli, the occurrence of an amplitude peak in the SAMI tone was associated with a decrease in the ongoing response. The occurrence of an amplitude valley was associated with a discharge rate increase; in this case, the short-term discharge rate could exceed that obtained in response to the steady-state tone. It is suggested that this pattern of synchronized responses could be explained by a "release and rebound" mechanism. A similar interpretation was first offered by Kuwada and Batra (1999), who studied “off neurons” located in the superior olivary complex. These neurons did not respond during presentation of steady-state tones, but they did produce a burst of spikes at the stimulus offset. When stimulated with SAM tones, off neurons synchronized to the envelope with the same phase relation observed here; spikes tended to occur at amplitude minima. Kuwada and Batra suggested that rebound from inhibition produced the off responses to pure tones, and also accounted for the response modulation with SAM stimuli. The results of the present study with respect to the representation of paired SAMI+TONECF stimuli are consistent with their interpretation. However, one difference between studies is that in Kuwada and Batra (1999), neurons rebounded during SAM tones even in the absence of a simultaneous excitatory stimulus. In the present study, of course, synchronized responses were observed only when excitatory drive in the form of a CF tone was provided.
Kuwada and Batra (1999) also suggested that off neurons with similar responses to modulated stimuli might exist in the dorsal nucleus of the lateral lemniscus (DNLL). Since the DNLL provides a major inhibitory input to the IC, one may ask whether DNLL off neurons might contribute to the present results. The phase dependence seen in the responses to paired SAMI+TONECF stimuli suggests that off neurons from the DNLL do not play a significant role in shaping those responses (although other DNLL neurons undoubtedly do). A population of off neurons generating spikes at the envelope minimum would produce the strongest inhibition at the point in the modulation cycle at which the IC response to paired SAMI+TONECF stimuli was actually found to be largest.
Effects of anesthesia
The data reported here in which effects of inhibition were prominent were obtained from animals given a barbiturate anesthetic. Barbiturates are known to augment the effect of GABA-mediated inhibition (Schulz and MacDonald 1981; Kuwada et al. 1989) and thus it cannot be stated with certainty that the representation of SAMI+TONECF stimuli (as well as other stimuli) described here would be the same in unanesthetized animals. However, results of separate studies from this lab suggest that the major effect of Dial in urethane anesthetic was to reduce the overall excitability of the studied neurons without altering the temporal fine structure of the responses. Sinex et al. (2002b) described temporally-complex responses elicited from IC neurons in chinchillas anesthetized with the same mixture used here, and Sinex et al. (2005) subsequently observed the same complex patterns in chinchillas anesthetized with Ketamine/Xylazine. Thus those patterns, and by inference the patterns described here, were not produced or exaggerated by the use of barbiturates.
Across-frequency processing in hearing
IC neurons responding to paired SAMI+TONECF stimuli may be described as computing the difference in temporal envelopes across frequency. Interestingly, some psychoacoustic observations have been interpreted as reflecting a computation or comparison of the amplitude envelope across frequency. Perhaps the best-known example is comodulation masking release (CMR, Hall et al. 1984; Verhey et al. 2003). Comparison of envelope information across frequency is also thought to contribute to modulation detection interference (Yost and Sheft 1994), auditory grouping (Darwin and Carlyon 1995; Carrell and Opie 1992), and sound-source determination (Yost 1991).
CMR refers to the finding that listeners’ thresholds for detecting tones in a broadband masker are lower when the temporal envelope of the masker is correlated across frequency; the improvement in thresholds indicates that listeners are able to make use of temporal information remote from the signal frequency to detect that signal. That result is difficult to account for if it is assumed that information is processed exclusively in independent narrowband channels. In the context of the present results, it is also difficult to account for phenomena like CMR if it is assumed the role of off-CF inhibition is to restrict the information available to a neuron to that which originates in a narrow region around that neuron’s CF. CMR and related psychophysical phenomena are more understandable if it is assumed that listeners can detect the envelope in local frequency bands, and can compare those envelopes across frequency bands to identify differences (Richards and Buss 1996). The present results indicate that when driven with paired SAMI+TONECF stimuli, IC neurons respond as if they are computing the difference in envelopes across frequency. That is, they perform an analysis like the one that is hypothesized to occur in CMR and in more complex phenomena like auditory grouping.
Acknowledgments
This work was supported by Grant DC00341 from NIDCD to D.G.S. The authors thank Krista Herder for assisting with data collection, and Jialong He for coding a prototype of Matlab code to generate stimuli. Preliminary results have been presented as abstracts (Li et al. 2002, 2003).
Footnotes
Present addresses: Hongzhe Li, PhD, University of Washington School of Medicine, Department of Radiation Oncology, 1959 NE Pacific Street, NW141, Box 356069, Seattle, WA 98195 USA, 206-598-4094, FAX: 206-598-6473, hongzhe@u.washington.edu
Jennifer H. Sabes, University of California-San Francisco, Department of Otolaryngology, San Francisco, CA 94143 USA, Jennifer.Henderson-Sabes@ucsfmedctr.org
Donal G. Sinex, PhD, Utah State University, Departments of Psychology and Biology, Logan, UT 84322-2810 USA, 435-797-8921, FAX: 435-797-1448, don.sinex@usu.edu
References
- Backoff P, Palombi PS, Caspary D. Gamma-aminobutyric acidergic and glycinergic inputs shape coding of amplitude modulation in the chinchilla cochlear nucleus. Hear Res. 1999;134:77–88. doi: 10.1016/s0378-5955(99)00071-4. [DOI] [PubMed] [Google Scholar]
- Burger R, Pollak G. Analysis of the role of inhibition in shaping responses to sinusoidally amplitude-modulated signals in the inferior colliculus. J Neurophysiol. 1998;80:1686–701. doi: 10.1152/jn.1998.80.4.1686. [DOI] [PubMed] [Google Scholar]
- Carrell TD, Opie JM. The effect of amplitude comodulation on auditory object formation in sentence perception. Percept Psychophys. 1992;52:437–45. doi: 10.3758/bf03206703. [DOI] [PubMed] [Google Scholar]
- Caspary D, Palombi PS, Hughes L. GABAergic inputs shape responses to amplitude modulated stimuli in the inferior colliculus. Hear Res. 2002;168:163–73. doi: 10.1016/s0378-5955(02)00363-5. [DOI] [PubMed] [Google Scholar]
- Casseday JH, Covey E. Frequency tuning properties of neurons in the inferior colliculus of an FM bat. J Comp Neurol. 1992;319:34–50. doi: 10.1002/cne.903190106. [DOI] [PubMed] [Google Scholar]
- Casseday JH, Covey E, Grothe B. Neural selectivity and tuning for sinusoidal frequency modulations in the inferior colliculus of the big brown bat, Eptesicus fuscus. J Neurophysiol. 1997;77:1595–605. doi: 10.1152/jn.1997.77.3.1595. [DOI] [PubMed] [Google Scholar]
- Darwin C, Carlyon R. Auditory grouping. In: Moore BC, editor. Hearing. Academic; San Diego: 1995. pp. 387–424. [Google Scholar]
- Ehret G, Merzenich M. Complex sound analysis (frequency resolution, filtering and spectral integration) by single units of the inferior colliculus of the cat. Brain Res Rev. 1988;13:139–63. doi: 10.1016/0165-0173(88)90018-5. [DOI] [PubMed] [Google Scholar]
- Ehret G, Moffat A. Inferior colliculus of the house mouse II. Single unit responses to tones, noise and tone-noise combinations as a function of sound intensity. J Comp Physiol A. 1985;156:619–635. [Google Scholar]
- Frisina RD. Subcortical neural coding mechanisms for auditory temporal processing. Hear Res. 2001;158:1–27. doi: 10.1016/s0378-5955(01)00296-9. [DOI] [PubMed] [Google Scholar]
- Frisina RD, Smith RL, Chamberlain SC. Encoding of amplitude modulation in the gerbil cochlear nucleus: I. A hierarchy of enhancement. Hear Res. 1990a;44:99–122. doi: 10.1016/0378-5955(90)90074-y. [DOI] [PubMed] [Google Scholar]
- Frisina RD, Smith R, Chamberlain SC. Encoding of amplitude modulation in the gerbil cochlear nucleus: II. Possible neural mechanisms. Hear Res. 1990b;44:123–41. doi: 10.1016/0378-5955(90)90075-z. [DOI] [PubMed] [Google Scholar]
- Gardner E, Kandel E. Touch. In: Kandel E, Schwartz J, Jessell T, editors. Principles of Neural Science. McGraw-Hill; New York: 2000. pp. 451–471. [Google Scholar]
- Goldberg J, Brown P. Response of binaural neurons of dog superior olivary complex to dichotic tonal stimuli: Some physiological mechanisms of sound localization. J Neurophysiol. 1969;32:613–636. doi: 10.1152/jn.1969.32.4.613. [DOI] [PubMed] [Google Scholar]
- Gooler D, Feng A. Temporal coding in the frog auditory midbrain: the influence of duration and rise-fall time on the processing of complex amplitude- modulated stimuli. J Neurophysiol. 1992;67:1–22. doi: 10.1152/jn.1992.67.1.1. [DOI] [PubMed] [Google Scholar]
- Hall J, Haggard M, Fernandes M. Detection in noise by spectro-temporal pattern analysis. J Acoust Soc Am. 1984;76:50–6. doi: 10.1121/1.391005. [DOI] [PubMed] [Google Scholar]
- Javel E. Coding of AM tones in the chinchilla auditory nerve: implications for the pitch of complex tones. J Acoust Soc Am. 1980;68:133–46. doi: 10.1121/1.384639. [DOI] [PubMed] [Google Scholar]
- Koch U, Grothe B. GABAergic and glycinergic inhibition sharpens tuning for frequency modulations in the inferior colliculus of the big brown bat. J Neurophysiol. 1998;80:71–82. doi: 10.1152/jn.1998.80.1.71. [DOI] [PubMed] [Google Scholar]
- Krishna B, Semple M. Auditory temporal processing: responses to sinusoidally amplitude- modulated tones in the inferior colliculus. J Neurophysiol. 2000;84:255–73. doi: 10.1152/jn.2000.84.1.255. [DOI] [PubMed] [Google Scholar]
- Kuffler S. Discharge patterns and functional organization of mammalian retina. J Neurophysiol. 1953;16:37–68. doi: 10.1152/jn.1953.16.1.37. [DOI] [PubMed] [Google Scholar]
- Kuwada S, Batra R. Coding of sound envelopes by inhibitory rebound in neurons of the superior olivary complex in the unanesthetized rabbit. J Neurosci. 1999;19:2273–87. doi: 10.1523/JNEUROSCI.19-06-02273.1999. [DOI] [PMC free article] [PubMed] [Google Scholar]
- Kuwada S, Batra R, Stanford T. Monaural and binaural response properties of neurons in the inferior colliculus of the rabbit: effects of sodium pentobarbital. J Neurophysiol. 1989;61:269–82. doi: 10.1152/jn.1989.61.2.269. [DOI] [PubMed] [Google Scholar]
- Langner G, Schreiner C. Periodicity coding in the inferior colliculus of the cat. I. Neuronal mechanisms. J Neurophysiol. 1988;60:1799–822. doi: 10.1152/jn.1988.60.6.1799. [DOI] [PubMed] [Google Scholar]
- LeBeau F, Malmierca M, Rees A. Iontophoresis in vivo demonstrates a key role for GABA(A) and glycinergic inhibition in shaping frequency response areas in the inferior colliculus of guinea pig. J Neurosci. 2001;21:7303–12. doi: 10.1523/JNEUROSCI.21-18-07303.2001. [DOI] [PMC free article] [PubMed] [Google Scholar]
- Li H, Henderson J, Sinex DG. Responses of Inferior Colliculus Neurons to SAM Tones Located in Inhibitory Response Area. Abstr Assoc Research Otolaryngol. 2002 doi: 10.1016/j.heares.2006.07.012. [DOI] [PMC free article] [PubMed] [Google Scholar]
- Li H, Sabes JH, Sinex DG. Responses of inferior colliculus neurons to SAM stimuli with varied modulation depth. Abstr Assoc Research Otolaryngol 2003 [Google Scholar]
- Lu Y, Jen P, Wu M. GABAergic disinhibition affects responses of bat inferior collicular neurons to temporally patterned sound pulses. J Neurophysiol. 1998;79:2303–15. doi: 10.1152/jn.1998.79.5.2303. [DOI] [PubMed] [Google Scholar]
- Merchán M, Saldana E, Plaza I. Dorsal nucleus of the lateral lemniscus in the rat: concentric organization and tonotopic projection to the inferior colliculus. J Comp Neurol. 1994;342:259–78. doi: 10.1002/cne.903420209. [DOI] [PubMed] [Google Scholar]
- Merzenich M, Reid M. Representation of the cochlea within the inferior colliculus of the cat. Brain Res. 1974;77:397–415. doi: 10.1016/0006-8993(74)90630-1. [DOI] [PubMed] [Google Scholar]
- Nataraj K, Wenstrup J. Roles of inhibition in creating complex auditory responses in the inferior colliculus: facilitated combination-sensitive neurons. J Neurophysiol. 2005;93:3294–312. doi: 10.1152/jn.01152.2004. [DOI] [PubMed] [Google Scholar]
- Nataraj K, Wenstrup J. Roles of inhibition in complex auditory responses in the inferior colliculus: inhibited combination-sensitive neurons. J Neurophysiol. 2006;95:2179–92. doi: 10.1152/jn.01148.2005. [DOI] [PMC free article] [PubMed] [Google Scholar]
- Nuding S, Chen GD, Sinex D. Monaural response properties of single neurons in the chinchilla inferior colliculus. Hear Res. 1999;131:89–106. doi: 10.1016/s0378-5955(99)00023-4. [DOI] [PubMed] [Google Scholar]
- Oliver D, Shneiderman A. The anatomy of the inferior colliculus: A cellular basis for integration of monaural and binaural information. In: Altschuler RA, Bobbin RP, Clopton BM, Hoffman DW, editors. Neurobiology of Hearing: The central auditory system. Raven Press; New York: 1991. pp. 195–222. [Google Scholar]
- Palombi P, Caspary D. GABA inputs control discharge rate primarily within frequency receptive fields of inferior colliculus neurons. J Neurophysiol. 1996;75:2211–9. doi: 10.1152/jn.1996.75.6.2211. [DOI] [PubMed] [Google Scholar]
- Portfors C, Wenstrup J. Excitatory and facilitatory frequency response areas in the inferior colliculus of the mustached bat. Hear Res. 2002;168:131–8. doi: 10.1016/s0378-5955(02)00376-3. [DOI] [PubMed] [Google Scholar]
- Rees A, Møller A. Stimulus properties influencing the responses of inferior colliculus neurons to amplitude-modulated sounds. Hear Res. 1987;27:129–43. doi: 10.1016/0378-5955(87)90014-1. [DOI] [PubMed] [Google Scholar]
- Rees A, Palmer A. Neuronal responses to amplitude-modulated and pure-tone stimuli in the guinea pig inferior colliculus, and their modification by broadband noise. J Acoust Soc Am. 1989;85:1978–94. doi: 10.1121/1.397851. [DOI] [PubMed] [Google Scholar]
- Rhode W. Technical Report, University of Wisconsin, Dept. of Neurophysiology; 1976. A test for the significance of the mean direction and the concentration parameter of a circular distribution. [Google Scholar]
- Richards VM, Buss E. Frequency correlation functions for the detection of a tone added to modulated noise maskers. J Acoust Soc Am. 1996;99:1645–1652. doi: 10.1121/1.414736. [DOI] [PubMed] [Google Scholar]
- Ryan A, Miller J. Single unit responses in the inferior colliculus of the awake and performing rhesus monkey. Exp Brain Res. 1978;32:389–407. doi: 10.1007/BF00238710. [DOI] [PubMed] [Google Scholar]
- Saint Marie R, Baker R. Neurotransmitter-specific uptake and retrograde transport of [3H] glycine from the inferior colliculus by ipsilateral projections of the superior olivary complex and nuclei of the lateral lemniscus. Brain Res. 1990;524:244–53. doi: 10.1016/0006-8993(90)90698-b. [DOI] [PubMed] [Google Scholar]
- Schulz DW, MacDonald RL. Barbiturate enhancement of GABA-mediated inhibition and activation of chloride ion conductance: correlation with anticonvulsant and anesthetic actions. Brain Res. 1981;209:177–88. doi: 10.1016/0006-8993(81)91179-3. [DOI] [PubMed] [Google Scholar]
- Sinex DG, Henderson J, Li H, Chen GD. Responses of chinchilla inferior colliculus neurons to amplitude- modulated tones with different envelopes. J Assoc Res Otolaryngol. 2002a;3:390–402. doi: 10.1007/s101620020026. [DOI] [PMC free article] [PubMed] [Google Scholar]
- Sinex DG, Sabes JH, Li H. Responses of inferior colliculus neurons to harmonic and mistuned complex tones. Hear Res. 2002b;168:150–62. doi: 10.1016/s0378-5955(02)00366-0. [DOI] [PubMed] [Google Scholar]
- Sinex DG, Li H, Velenovsky DS. Prevalence of stereotypical responses to mistuned complex tones in the inferior colliculus. J Neurophysiol. 2005;94:3523–37. doi: 10.1152/jn.01194.2004. [DOI] [PMC free article] [PubMed] [Google Scholar]
- Snyder RL, Sinex DG. Immediate changes in tuning of inferior colliculus neurons following acute lesions of cat spiral ganglion. J Neurophysiol. 2002;87:434–52. doi: 10.1152/jn.00937.2000. [DOI] [PubMed] [Google Scholar]
- Verhey JL, Pressnitzer D, Winter IM. The psychophysics and physiology of comodulation masking release. Exp Brain Res. 2003;153:405–17. doi: 10.1007/s00221-003-1607-1. [DOI] [PubMed] [Google Scholar]
- Yang L, Pollak GD. Differential response properties to amplitude modulated signals in the dorsal nucleus of the lateral lemniscus of the mustache bat and the roles of GABAergic inhibition. J Neurophysiol. 1997;77:324–40. doi: 10.1152/jn.1997.77.1.324. [DOI] [PubMed] [Google Scholar]
- Yost WA. Auditory image perception and analysis: the basis for hearing. Hear Res. 1991;56:8–18. doi: 10.1016/0378-5955(91)90148-3. [DOI] [PubMed] [Google Scholar]
- Yost WA, Sheft S. Modulation detection interference: across-frequency processing and auditory grouping. Hear Res. 1994;79:48–58. doi: 10.1016/0378-5955(94)90126-0. [DOI] [PubMed] [Google Scholar]
- Young ED, Brownell WE. Responses to tones and noise of single cells in dorsal cochlear nucleus of unanesthetized cats. J Neurophysiol. 1976;39:282–300. doi: 10.1152/jn.1976.39.2.282. [DOI] [PubMed] [Google Scholar]