Abstract
The generality of the molar view of behavior was extended to the study of choice with rats, showing the usefulness of studying order at various levels of extendedness. Rats' presses on two levers produced food according to concurrent variable-interval variable-interval schedules. Seven different reinforcer ratios were arranged within each session, without cues identifying them, and separated by blackouts. To alternate between levers, rats pressed on a third changeover lever. Choice changed rapidly with changes in component reinforcer ratio, and more presses occurred on the lever with the higher reinforcer rate. With continuing reinforcers, choice shifted progressively in the direction of the reinforced lever, but shifted more slowly with each new reinforcer. Sensitivity to reinforcer ratio, as estimated by the generalized matching law, reached an average of 0.9 and exceeded that documented in previous studies with pigeons. Visits to the more-reinforced lever preceded by a reinforcer from that lever increased in duration, while all visits to the less-reinforced lever decreased in duration. Thus, the rats' performances moved faster toward fix and sample than did pigeons' performances in previous studies. Analysis of the effects of sequences of reinforcer sources indicated that sequences of five to seven reinforcers might have sufficed for studying local effects of reinforcers with rats. This study supports the idea that reinforcer sequences control choice between reinforcers, pulses in preference, and visits following reinforcers.
Keywords: choice, molar view, visits patterns, fix and sample, lever press, rats
The molar approach to the study of behavior is based on the concept of aggregated and temporally extended patterns of action called activities (Baum, 2002). It sees choice as an extended (not derived) pattern of behavior composed of two parts, responding at one alternative and responding at the other. Each part is an activity that in turn is composed of parts that are also activities seen as necessarily extended and nested within one another (Baum, 1995, 2001). Accordingly, more local patterns within choice can be studied by examining visits or bouts of responding, revealing local patterns within the more extended pattern of behavioral allocation between two reinforced alternatives (e.g., Baum & Davison, 2004).
In contrast with the molar view, the molecular view sees behavior as consisting of discrete responses occurring at moments in time. To explain behavior, the molecular approach relies on antecedent and consequent stimuli occurring in temporal contiguity to the responses (e.g., Skinner, 1935/1961). In the molecular view, for example, the matching relation (Herrnstein, 1961) is considered “derived” and only valid pending discovery of the moment-to-moment relations that would explain it (e.g., Catania, 1981). To analyze concurrent performance, the molecular view focuses on predicting at which alternative the next response will occur (e.g., Hinson & Staddon, 1983).
As Baum (2002) noted, the difference between the molar and molecular views is a difference of paradigms, not a difference of theories, and cannot be resolved by experiments or data. The two views may be evaluated only in terms of their relative plausibility, elegance, and comprehensiveness. The plausibility of the molecular view is often undermined, however, by the need always to infer instantaneous behavior in retrospect (e.g., “At that moment, the rat was lever pressing”); it cannot be observed at the moment because only extended activities produce the environmental effects (e.g., switch closure) from which they (e.g., lever pressing) are named (Baum, 1997, 2002).
Recently, Baum and Davison (2004) demonstrated the superior elegance and comprehensiveness of the molar view by showing that choice can be analyzed at various levels of extendedness without resorting to hypothetical events. One aim of the present experiment was to extend the generality of the findings obtained with pigeons (Davison & Baum, 2000, 2002, 2003) to rats whose lever pressing was reinforced by food delivery under conditions in which multiple changes in reinforcer distribution occur regularly within single sessions. Another aim was to determine whether the fix-and-sample pattern (Baum, Schwendiman, & Bell, 1999) observed in choice situations when schedule pairs are presented for a sufficient number of consecutive sessions (e.g., Baum 2002; Baum & Aparicio, 1999) occurs in dynamic reinforcing environments where rapid adaptation of behavior is required (e.g., Baum & Davison, 2004).
Choice on concurrent schedules—principally concurrent pairs of variable-interval (VI) schedules—can be analyzed by the following equation:
| 1 |
where B1 and B2 are behavior allocations, measured in time or responses, to Alternatives 1 and 2, r1 and r2 are reinforcer rates obtained from Alternatives 1 and 2, b is a measure of bias toward one alternative or the other arising from factors other than r1 and r2, and s is sensitivity of the behavior ratio to the reinforcer ratio (Baum, 1974). The feasibility and reliability of Equation 1 in describing the relationship between an extended pattern of behavior and a distribution of reinforcers expressed as a reinforcer ratio has been demonstrated with more extended patterns of choice as parts of still more extended activity patterns (Baum, 2002), as well as with more local patterns within choice (i.e., Baum & Davison, 2004).
Although Equation 1 has most often been applied to steady-state choice, it has been used to analyze behavior in transition. Several studies documented large changes in choice within single sessions in response to unpredictable within-session changes in reinforcer ratios (Bailey & Mazur, 1990; Mazur, 1992, 1995, 1996, 1997; Mazur & Ratti, 1991). Other studies have shown that choice quickly adapts to rapid changes in reinforcer ratio (e.g., Hunter & Davison, 1985; Mazur, 1997; Schofield & Davison, 1997). Davison and Baum (2000) varied the speed of environmental change within sessions to investigate whether pigeons' choice would change more rapidly when the environment changes more frequently. They adapted a procedure introduced by Belke and Heyman (1994) to study performance where seven different reinforcer ratios (27∶1, 9∶1, 3∶1, 1∶1, 1∶3, 1∶9, and 1∶27) were presented to the pigeons in a random order in each experimental session. Each of these ratios was separated by a 10-s blackout of the key lights, and across conditions the number of reinforcers per ratio was varied. Davison and Baum found that from reinforcer to reinforcer more responding or time was allocated to the alternative from which each reinforcer came; even if one alternative provided a series of reinforcers and choice was strongly favoring it with more responses or time, one reinforcer from the other alternative was enough to move choice during the next interreinforcer interval beyond indifference. While these dynamics were occurring at a local level, at a more extended level sensitivity to reinforcer ratio increased rapidly, reaching levels between 0.5 and 0.7 after six to eight reinforcer deliveries. To analyze the possibility of carryover from one reinforcer ratio to the next, Davison and Baum conducted a multiple linear-regression analysis with the logarithm of response ratio in the current component as the dependent variable, and the logarithm of reinforcer ratio in the current component and previous component as the independent variables. This analysis showed that sensitivity to the previous reinforcer ratio was about 0.20 at the beginning of a component, but decreased toward zero as more reinforcers were obtained in the current component. Furthermore, when Davison and Baum varied the number of reinforcers per component, they found that the rate of component change had no effect on sensitivity.
In subsequent studies, however, Landon and Davison (2001) found that sensitivity decreased with the range of reinforcer-ratio variation across components, suggesting that the amount of carryover increases when the component reinforcer ratios vary over a narrower range than that employed by Davison and Baum (2000). One possibility is that the 10-s blackout used by Landon and Davison failed to eliminate the effects of the reinforcers obtained in the previous component. To explore this possibility, Davison and Baum (2002) arranged intercomponent blackout durations ranging from 1 to 120 s in one experiment, and arranged a 60-s period of unsignaled extinction between components in a second experiment. They documented three results: (1) as the blackout duration between components increased, the effect of reinforcers obtained in the previous component decreased; (2) this decrement was faster than the decrement observed when components were demarcated by unsignaled periods of extinction; and (3) within components, a delivery of a reinforcer was followed by a “pulse” in preference to the just-reinforced alternative, with choice subsequently decreasing towards indifference (Davison & Baum, 2002).
In Davison and Baum's (2002) study, the term “pulse” in preference was first used to mean that immediately following three consecutive reinforcers from the same alternative, choice for that alternative rose briefly to extreme levels, often exceeding 100∶1. This finding was important because pulses in preference had never been documented previously in concurrent VI VI performance. More evidence supporting the occurrence of preference pulses comes from studies of steady-state choice. For example, Landon, Davison, and Elliffe (2002) studied local effects of reinforcers with reinforcer ratios kept constant for 65 sessions. Although they found greater and longer preference pulses (i.e., choice rose briefly to extreme levels) following reinforcers for the more-reinforced alternative, choice also was affected by both recent and temporally distant reinforcer deliveries. These findings exemplify results readily explained by the molar view but requiring implausible assumptions for a molecular-view explanation.
The large preference pulses following a reinforcer from the richer alternative accord with results obtained in experiments on foraging with a group of pigeons (Bell & Baum, 2002) and with the finding that at a relatively extended level, steady-state choice reveals visit patterns in which responding is primarily allocated to the rich alternative with occasional brief visits to the lean alternative (i.e., “fix and sample”; Baum, 2002; Baum & Aparicio, 1999; Baum et al., 1999). The fix-and-sample pattern documented by Baum (2002) comprises two different activities, behavior at the rich alternative and behavior at the lean alternative. In accord with this idea, behavior at the rich alternative consists of staying there (fixing) whereas behavior at the lean alternative consists of brief visiting (sampling: Baum, 2002).
Local analyses reveal that during a preference pulse more responses or time are allocated to the just-reinforced alternative, but then the choice ratio shifts toward indifference and can even favor (in terms of responses or time) the not-just-reinforced alternative (Davison & Baum, 2002, 2003). Recently, Baum and Davison (2004) analyzed local choice in terms of visits, where visit may be defined as a series of responses beginning with either a reinforcer or a changeover (Baum & Aparicio, 1999). They examined the dynamics of choice as patterns of visits, looking for a tendency toward the fix-and-sample pattern reported by Baum et al. (1999) and offering a potentially more fruitful approach to the study of preference pulses. Seven reinforcer ratios were arranged within each session, each lasting for a fixed number (4 or 12) of reinforcers, and with 30-s blackouts between components. As in Davison and Baum's studies, the reinforcers were arranged dependently, and the components changed randomly and were not signaled.
As in earlier studies, Baum and Davison (2004) found that choice changed rapidly within components as reinforcers were delivered, and following each reinforcer, choice shifted toward the alternative that produced the reinforcer. If several reinforcers were delivered consecutively by one alternative, a discontinuation of such a series of reinforcers by a reinforcer from the other alternative resulted in a shift of response ratio toward that alternative. Analysis of the visits to the two alternatives revealed that performance moved toward a fix-and-sample pattern, changes in visit length occurred in the first visit to the repeatedly reinforced alternative, and brief visits at the nonpreferred alternative remained invariant across reinforcer ratios with a high probability of switching immediately after a reinforcer from that alternative (Baum & Davison, 2004).
The present experiment extended the molar view of behavior and the generality of its multi-level analyses to the study of choice in rats. As in previous studies by Davison and Baum (2002, 2003), the arranged overall reinforcer rate was constant across seven components, but the components alternated randomly and without replacement, providing seven different, unsignaled reinforcer ratios (27∶1, 9∶1, 3∶1, 1∶1, 1∶3, 1∶9, and 1∶27) within each session. Each ratio lasted until 10 reinforcers had been delivered for pressing on the left or right lever. The termination of each component was demarcated by a 60-s blackout. A fixed-ratio 1 changeover requirement was in effect in all components. As in Baum and Davison's (2004) study, patterns of behavior were examined following various sequences of reinforcers.
Method
Subjects
Eight naive male Wistar rats (numbered R30 to R37) were maintained at 85% of their free-feeding body weights. Water was available at all times. The rats were fed varying amounts of Purina chow immediately after the final daily session. The rats were approximately 100 days old when the experiment began and were housed individually in a temperature-controlled colony room on a 12∶12-hr light∶dark cycle.
Apparatus
Four modular chambers (Coulbourn E10-18TC) for rats measuring 310 mm long, 260 mm wide, and 320 mm high were located in a sound-controlled box 780 mm wide, 540 mm long, and 520 mm high. A square metal grid constituted the floor of each chamber. A food cup (E14-01), 30 mm wide and 40 mm long, was centered horizontally from the left and right walls 20 mm from the floor. Two retractable levers (E23-17), 30 mm wide and 15 mm long, requiring a force of 0.2 N to operate, were mounted on the front wall of each chamber; the centers of the levers were 85 mm to the left or right from the center of the food cup and 100 mm above the floor. Two white, 24-V DC light bulbs (E11-03), centered with the levers and installed 20 mm above them, provided the illumination of the chamber. A food dispenser (E14-24) located behind the front wall delivered 45-mg food pellets (Formula A/1 Research Diets) into the food cup. A speaker (E12-01) 26 mm wide by 40 mm high, which was mounted on the front wall of each chamber 20 mm from the ceiling and connected to a white noise generator (E12-08), provided a constant white noise 20 kHz (+/− 3 dB). A third non-retractable lever (E21- 03), requiring a force of 0.2 N to operate, was centrally mounted on the back wall of each chamber at 100 mm above the floor. All experimental events were arranged on a HP® PC-compatible computer running Coulbourn-PC® software, located in a room remote from the experimental cages. The computer recorded the time (10-ms resolution) at which every event occurred in experimental sessions.
Procedure
A technique similar to that of Brown and Jenkins (1968) was used to establish lever pressing. Sixty trials were arranged according to a variable-time schedule of 60 s. In each trial, either the left or the right lever (randomly selected) was extended into the chamber with the light above it turned on for 8 s. Pressing the lever during this period immediately produced the reinforcer (1 food pellet). Otherwise, the pellet was presented at the end of the trial while turning off the light and retracting the lever. When the rats pressed the levers in 60 consecutive trials, the left and right retractable levers were removed from the chamber, and the third (non-retractable) lever was centrally mounted on the back wall of the chamber. Each press on that lever produced a food pellet until the rats obtained 60 consecutive pellets. After that, the experiment started.
Sessions were conducted at the same time each day, and lasted until seven components were completed or until 90 min elapsed, whichever occurred first. Each component began with the left and the right retractable levers extended into the chamber and the lights above them turned on, which signaled the availability of food pellets for pressing the retractable levers. The first response on either the left or right lever caused the opposite lever to retract. Pressing on the available lever produced food pellets according to the VI schedule assigned to that lever. At any time, however, the rat could leave this lever and switch to the retracted lever by making one press on the changeover lever (located on the back wall). This changeover response caused the available lever to retract, and the retracted lever to extend into the chamber. This fixed-ratio 1 changeover (FR1 CO) requirement was implemented to simulate travel (Aparicio & Baum, 1997) and separate the contingencies of reinforcement arranged for each lever (Pliskoff, Cicerone, & Nelson, 1978; Stubbs, Pliskoff, & Reid, 1977). The seven components were separated from one another by a 60-s blackout. During the blackout, the lights were extinguished and the levers retracted from the chamber. Two VI schedules arranged, on average, one food pellet every 11 s, but the reinforcer ratio changed randomly over components, providing seven different, unsignaled reinforcer ratios (27∶1, 9∶1, 3∶1, 1∶1, 1∶3, 1∶9, and 1∶27) for the session. In practice, this was accomplished by programming a fixed time of 3 s on each lever. At the end of this period, the computer used a probability (p) to determine whether or not to set up a reinforcer. Seven pairs of probabilities (p) defined the seven unsignaled reinforcer ratios: .27∶.01, .25∶.03, .21∶.07, .14∶.14, .07∶.21, .03∶.25, and .01∶.27). (Note that the sum of each pair is equal to 0.28, and the fixed time of 3 s divided by that sum results in the average time of 10.71 s to set up one food pellet).
In all sessions, the reinforcer ratios were randomly selected without replacement, and were arranged dependently; that is, reinforcers were probabilistically assigned to one of the two retractable levers. Whenever a VI schedule arranged a reinforcer for a lever that was retracted, the rats had to make a changeover response so as to extend this lever into the chamber. One press on this lever produced the arranged reinforcer; further responses on it produced more reinforcers according to the VI schedule assigned to the lever. Each component lasted until 10 pellets had been obtained by pressing the left or the right lever; components varied in length from 10 to 19 reinforcers, but usually ended after 10 to12 reinforcers. Training continued for 118 sessions during which the time of every coded event was collected (10-ms resolution).
Data Analysis
From the daily records of total number of presses on the left and right levers across components, the ratios of responses (left/right) were computed and transformed into base-2 logarithms. Also, the numbers of responses during visits to the left and right levers (presses per visit) were summed across components. For each rat, the logs of response ratios, presses per visit on the left lever, and presses per visit on the right lever were plotted across the 118 sessions. These plots were used to judge stability by visual inspection. Performance was judged stable when no systematic trends (up-and-down patterns) in these measures were detected for several consecutive days. This stability criterion allowed selecting 66 to 68 consecutive sessions for data analysis.
The data from all selected sessions were then pooled across sessions for each reinforcer within the sequence of the first 10 obtained reinforcers. Within the same component 10 ratios of responses could be computed, (with one ratio per reinforcer), corresponding to a total of 70 ratios for the seven components. In addition, the length of the series of responses beginning with either a reinforcer or a changeover (i.e., presses per visit) was computed for the left and right levers. When longer reinforcer-source sequences were pooled regardless of where they began in the component, measures were computed on sequences ranging to the end of the component, sometimes ending with the eighteenth reinforcer.
Results
To compare the present results with those from previous studies with pigeons, our first analysis investigated how response ratios changed as a function of the successive reinforcers delivered in each of the seven components. Across all presentations of the component (66 to 68 sessions), responses were pooled from the beginning of a component to the first reinforcer, from the first to the second reinforcer, from the second to the third, and so on.
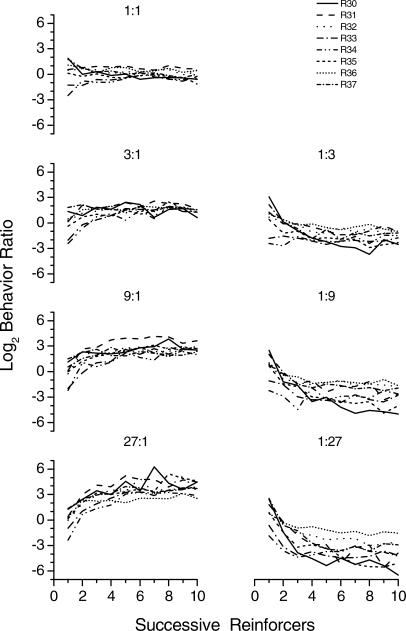
Figure 1 shows the base-2 logarithm of response ratio as a function of the successive reinforcers delivered in a component. With the exception of the 1∶1 component, in which the response ratio fell close to indifference (zero on the y-axis) for all rats, with an increasing number of reinforcers the response ratio tracked the component reinforcer ratio. When the left lever was associated with the higher reinforcer probability (components 3∶1, 9∶1, and 27∶1), more presses occurred on that lever than on the right lever, with response ratios taking positive values with increasing number of reinforcers. The same result holds for the right lever when it was associated with the higher reinforcer probability (components 1∶3, 1∶9, and 1∶27); more presses occurred on that lever, with response ratios taking negative values with increasing number of reinforcers.
Fig 1. Log (base 2) of behavior ratio as a function of successive reinforcers delivered in a component.
The multiple panels are organized according to the components. Different lines represent the individual rats.
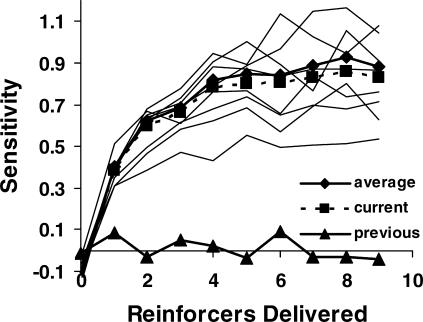
Figure 2 shows sensitivity (s in Equation 1) calculated by fitting least-squares regression lines to the log response ratios, calculated prior to each successive reinforcer and expressed as a function of arranged log reinforcer ratios. The multiple lines represent the individual rats, and the thick line with diamonds shows the average across rats. The broken line with squares and the solid line with triangles, respectively, indicate the slopes obtained by multiple regression, using the current reinforcer ratio and the behavior ratio in the previous component (calculated from all responses made after the 10th reinforcer was delivered) as the predictor variables. Equation 1 generally described the data well. For group data and individuals, values of sensitivity to the reinforcer ratio increased progressively from a value close to zero (often negative), prior to the first reinforcer, to a value of about 0.8. For some rats, sensitivity reached 1.0. Average sensitivity for the group (diamonds) approximated that for the current reinforcer ratio from the multiple regression analysis (squares), because carryover from the previous component (triangles) was slight. Thus, the 60-s blackouts between components eliminated almost all carryover.
Fig 2. Sensitivity to reinforcer ratio (s in Equation 1) as a function of the number of reinforcers delivered in a component, calculated using arranged reinforcer ratios.
The light lines represent data for the individual rats, and the heavy solid line with diamonds indicates the group average. The heavy broken line with squares and the heavy solid line with triangles show the slopes from multiple regression analysis using current reinforcer ratio and previous behavior ratio as the predictor variables, respectively. Points plotted at zero on the x-axis indicate performance before any reinforcer was delivered.
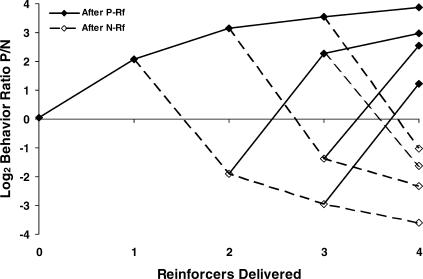
Figure 3 shows response ratios preceding the first reinforcer and following the first four reinforcers in a component. The sequences were selected regardless of component, and the data were pooled over rats. The first point represents the behavior ratio up to the first reinforcer. After the first reinforcer, P signifies the lever (left or right) that was reinforced first in the component, and N represents the other, not-first-reinforced lever. Filled symbols and solid lines are for P reinforcers, and open symbols and broken lines for N reinforcers. The log response ratio before the first reinforcer was close to zero, indicating no average preference at the beginning of the component. A shift of choice (log behavior ratio) occurred with each successive reinforcer toward the lever from which it came. When all four reinforcers occurred on the left or right lever (PPPP), choice shifted progressively in the direction of the reinforced lever. Whenever a shift of reinforcer source occurred (from the left to the right lever or vice versa), a shift in choice followed. After three N reinforcers in a row (PNNN), the behavior ratio was nearly the same, but opposite in sign (-3.61), as after four P (PPPP) reinforcers (3.89), suggesting that the effect of three reinforcers in a row from lever N eliminated most of the effect of the first reinforcer from the P lever.
Fig 3. Log (base 2) of interreinforcer behavior ratio as a function of the source sequence of reinforcers for the first four reinforcers within components.
P: first-reinforced lever; N: not-first-reinforced lever. Filled symbols and solid lines represent P reinforcers, and unfilled symbols and broken lines indicate N reinforcers. Points plotted at zero on the x-axis represent data before any reinforcer was delivered.
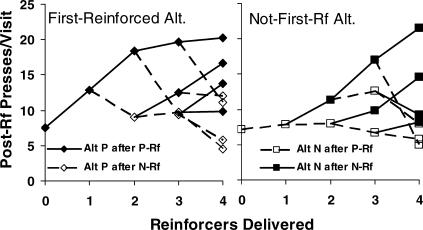
To study bouts of activity or visits (i.e., a series of consecutive responses beginning with either a reinforcer or a changeover), we compared the visits following a reinforcer ( presses per visit) on the lever that produced the first reinforcer of a component (first-reinforced lever) with the visits following a reinforcer on the other, not-first-reinforced, lever. An analysis similar to that implemented in Figure 3 was conducted. Figure 4 shows the first visit to a lever following a reinforcer, for various sequences of four reinforcers. Again, P signifies the lever (left or right) that was reinforced first in the component, and N represents the other, not-first-reinforced lever. The left panel shows the postreinforcer visits to alternative P after P was reinforced (“Alt P after P-Rf”) and the postreinforcer visits to alternative P after N was reinforced (“Alt P after N-Rf”). The right panel shows the postreinforcer visits to alternative N after P was reinforced (“Alt N after P-Rf”) and the postreinforcer visits to alternative N after N was reinforced (“Alt N after N-Rf”). The open symbols show visits in which a switch followed the reinforcer; they were infrequent, and after two or three successive reinforcers from either alternative, relatively short. When pressing stayed at P (filled diamonds), visit length increased with four successive reinforcers, but in a negatively accelerated fashion. In contrast, for visits to N after P was reinforced (unfilled squares), visit length was short and appeared to decrease with four successive reinforcers, although the trend was not statistically significant because of the small number of such visits. Even after the first reinforcer, however, visits to N after P (unfilled square at abscissa 1) were significantly shorter than visits to P after P (filled diamond at abscissa 1; t-test; p < .001). The brevity of the visits to N (usually the lean alternative) supports the idea that the fix-and-sample pattern was developing and that these visits constituted sampling. Reinforcers obtained from N after the first reinforcer increased postreinforcer visit length (filled squares), and after three successive N-reinforcers, these visits averaged 21.5 presses, compared to 20.2 presses after four successive P-reinforcers. A comparison of sequences of three successive reinforcers differing in the source of the first reinforcer [for example, (P)NNP with (P)PNP in the left panel (9.8 versus 13.8) or (P)PNN with (P)NNN in the right panel (14.6 versus 21.5)], reveals that the source of the third reinforcer back (P versus N) persisted for a few reinforcers (t-tests; p < .001). This result led us to ask, how long a sequence would be free from the effects of the source of the first reinforcer? In other words, for how long did the effect of a reinforcer last?
Fig 4. For group data and the first four reinforcers, length of the first visit following a reinforcer (presses per visit) on the lever that produced the first reinforcer of a component (first-reinforced alternative: P; left panel) and length of visits following a reinforcer on the not-first-reinforced lever (N; right panel) as a function of reinforcer-source sequence.
The unfilled symbols indicate visits in which a switch followed a reinforcer. Points plotted at zero on the x-axis represent data before any reinforcers were delivered.
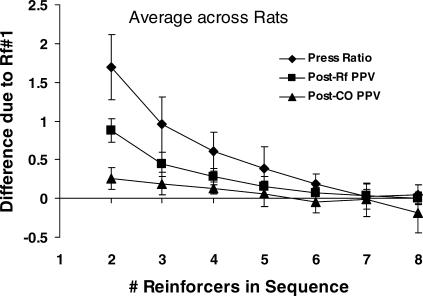
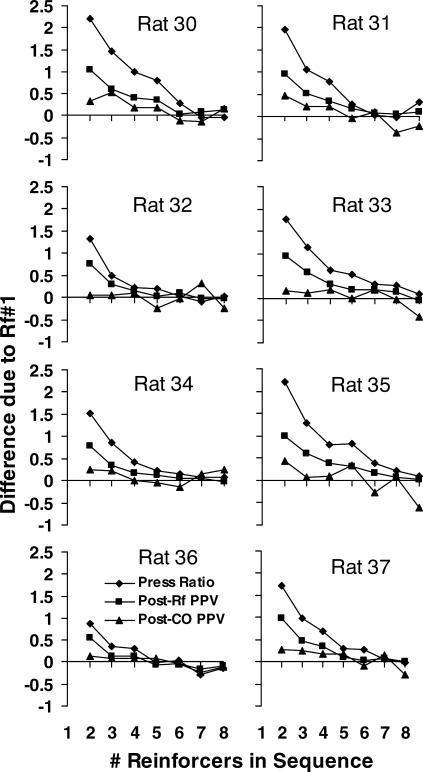
To answer this question, Figure 5 shows the difference due to the first reinforcer in a source sequence (successive reinforcers from both levers) as a function of the length of the sequence. Three measures in log base 2 are shown: response (press) ratio between reinforcers, as in Figure 3; postreinforcer presses per visit, as in Figure 4; and postchangeover presses per visit (i.e., visits following the postreinforcer visit, beginning and ending with a changeover). Each point represents the average difference in the measure following two source sequences, one beginning with a reinforcer from the first-reinforced lever (P) and one beginning with a reinforcer from the not-first-reinforced lever (N). For example, at two reinforcers in the sequence, differences between PP and NP sequences were calculated, whereas at four reinforcers in the sequence, differences between PPPP and NPPP were calculated. Figure 5 shows that the source of the first reinforcer mattered little for sequences of five or more reinforcers and that the source of the seventh or eighth reinforcer back had no measurable effect. For log press ratio (diamonds), the difference due to one reinforcer back (sequence length of two reinforcers) was 1.7 (i.e., a factor of 3); with sequences of seven or more reinforcers, the difference in log press ratio decreased to zero. For postreinforcer presses per visit (squares), the difference in visit length decreased to 0.075 when the difference in the source of the first reinforcer was six reinforcers back, and to 0.037 at seven reinforcers back. For postchangeover visits (triangles), the effect of previous reinforcer source was generally small: the difference in visit length decreased to 0.19 after two reinforcers (three-reinforcer sequence), 0.056 after four reinforcers, and was negligible after five reinforcers. Overall, Figure 5 suggests that source sequences of five to seven reinforcers in length might suffice for studying local effects of reinforcers with rats. Figure A1 in the Appendix shows that the results in Figure 5 were representative of the individual rats, although some variation occurred from rat to rat.
Fig 5. The effect, averaged across rats, of the first reinforcer in sequences up to eight reinforcers on three interreinforcer measures following the sequence: log2 behavior ratio (diamonds); log2 first postreinforcer visit length (squares); log2 average postchangeover visit length at the not-first-reinforced lever of the component (triangles).
The effect was calculated by taking the difference in a measure following two sequences identical except for the first reinforcer (first-reinforced lever in a component vs. not-first-reinforced) and averaging across all sequences of the same length. Error bars represent standard deviations across rats.
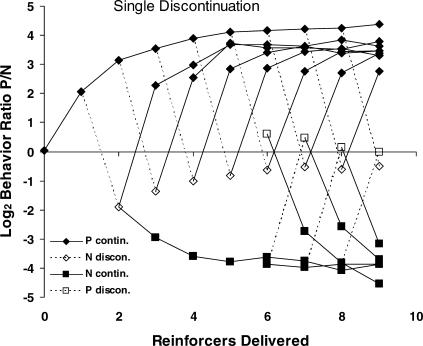
Previous studies with pigeons (Baum & Davison, 2004; Davison & Baum, 2002) that implemented moment-by-moment or response-by-response analyses showed that the immediate effect of a reinforcer is to create a pulse of preference (i.e., response ratios rise briefly to extreme levels, often exceeding 100∶1) in favor of the source of the reinforcer. Such pulses result from averaging across different postreinforcer and postchangeover visits. Relying instead on analyses at varied levels, Figure 3 averaged all presses between reinforcers, and Figure 4 focused on postreinforcer visits. Figures 6 and 7 extend those analyses to longer sequences of reinforcers. Figure 6 shows the behavior ratio (responses on the first-reinforced lever/responses on the not-first-reinforced lever) following sequences of continuing reinforcers for the first-reinforced (P) lever or not-first-reinforced (N) lever and following a single reinforcer (discontinuation) from the other lever. For sequences of five or fewer reinforcers, calculations began from the beginning of components, but for sequences of six or more reinforcers, calculations were done on these sequences regardless of where they occurred in the component (cf. Figure 5). The filled diamonds show the change in behavior ratio (preference) with increasing number of continuing P-reinforcers. Each open diamond shows the change in preference following a single discontinuation after one or more continuing P-reinforcers. Each discontinuation shifted preference toward the lever from which the discontinuation came. The open diamonds show an upward trend of discontinuations toward indifference, but the lengths of broken lines indicate that discontinuing reinforcers shifted preference about the same amount (4.5; a factor of 23) throughout. After a discontinuation, the behavior ratio returned close to its level before discontinuation after several P-reinforcers in succession. The behavior ratios were almost exactly the same for strings of N-reinforcers (i.e., N continuations; filled squares), but opposite in sign because all ratios were calculated as P/N. The unfilled squares show the effect of a discontinuation (i.e., P-reinforcer) following a continuous series of N-reinforcers. (These could only be calculated for sequences of six or more reinforcers.) The shifts following the N discontinuations mirrored those following the P discontinuations, showing a symmetrical tree for P and N successive reinforcers. The filled squares following each unfilled square indicate that the behavior ratio shifted back after a few additional N-reinforcers.
Fig 6. Log interreinforcer behavior ratio within components as a function of number of continuing reinforcers from the same lever (filled symbols and solid lines) and following a reinforcer from the other lever (a discontinuation; unfilled symbols and broken lines).
Points plotted at zero on the x-axis represent preference before any reinforcers were delivered. See text for more details.
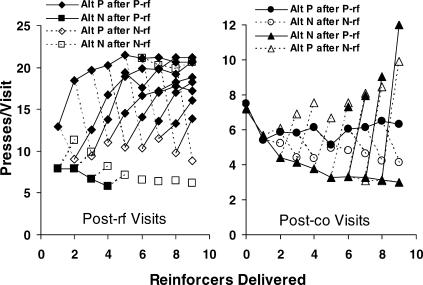
Fig 7. Visit length (presses per visit) following a series of continuing reinforcers or following a series of continuing reinforcers ending with a discontinuation.
Group data are shown for the first nine reinforcers delivered. Filled symbols represent visits following a reinforcer from the first-reinforced (P) lever. Unfilled symbols indicate visits following a discontinuation or a series of continuing reinforcers from the not-first-reinforced lever. Left: first visit following a reinforcer (i.e., postreinforcer visits). Right: visits beginning and ending with a switch (postchangeover visits). Points plotted at zero on the x-axis show average visit length prior to the first reinforcer in a component. Note the different scales on the y-axes.
Figure 7 extends the more local analysis of visits shown in Figure 3 to longer reinforcer sequences and to postchangeover visits. It shows the effects of continuations and discontinuations for sequences of six to nine reinforcers treated without regard to where the sequence began in the component. Whereas behavior ratios in Figure 6 included all responses between reinforcers, here visits are separated according to whether they began with a reinforcer or with a changeover. The left panel shows the first visit immediately following a reinforcer (postreinforcer visits), and the right panel shows postchangeover visits—that is, the visits beginning and ending with a changeover (the latter were usually the second and third visits following a reinforcer). As in the earlier figures, P refers to the first-reinforced lever, and N refers to the not-first-reinforced lever.
Because the great majority of visits immediately following a reinforcer occurred on the lever that was just reinforced, in the left panel the most common type of visit is “Alt P after P-Rf” (filled diamonds), meaning visits on the first-reinforced alternative following a reinforcer from that alternative. The next most common is “Alt N after N-Rf” (unfilled squares), the visits to the not-first-reinforced alternative following a reinforcer from that alternative. We shall call both types of visits (Alt P after P-rf and Alt N after N-rf) staying visits. The other two types of visit (unfilled diamonds and filled squares, respectively) are visits to the first-reinforced alternative following a reinforcer from the not-first-reinforced alternative (Alt P after N-rf) and visits to the not-first-reinforced alternative following a reinforcer from the first-reinforced alternative (Alt N after P-rf); we shall call these two types of visits (Alt P after N-rf and Alt N after P-rf) switched visits. They were few in number and relatively short. The top curve of filled diamonds shows how postreinforcer visits increased in a negatively accelerated fashion with successive reinforcers from the P alternative. The unfilled diamonds show the effect of a single discontinuation (N-reinforcer) when the postreinforcer visit was to the first-reinforced alternative (P). No trend was evident, perhaps because the low number of such switched visits made the estimates unreliable. As in Figure 6, the filled diamonds following each unfilled diamond show the effect of P-reinforcers after the discontinuation; after about five of these successive P-reinforcers, the postreinforcer visits to alternative P were approximately back to where they would have been without the discontinuation.
The filled squares show switched visits to the N alternative after a reinforcer from the P alternative; they correspond to the unfilled squares in Figure 4; as noted there, their brevity is consistent with a tendency toward the fix-and-sample pattern originally reported by Baum et al. (1999)—that is, they would represent a shift toward brief sampling of the lean alternative. These visits were few, however, and never occurred after four successive reinforcers from the P alternative. The lower set of unfilled squares show staying visits to the N alternative following a single N-reinforcer discontinuation (the counterparts of the unfilled diamonds). Again, the downward trend is supportive of the fix-and-sample pattern, in which responding switches immediately back to the rich alternative following a reinforcer from the lean alternative, because it shows that switching away from the N (usually lean) alternative occurred sooner and sooner with more continuing reinforcers from the P (usually rich) alternative. Analysis of variance on these unfilled squares revealed the downward trend to be highly statistically significant [F(7, 4647) = 52; p < .00001]. Whether visits would eventually reach one response, as found by Baum et al. (1999), is doubtful; in the present experiment, visits appeared to level off at about six to seven presses. The upper set of unfilled squares show staying visits to the N alternative following a string of six to nine N reinforcers (N continuations). Their near equality to the postreinforcer visits to the P alternative following such strings reflects the result shown in Figure 5: in a string of six or more continuations, the source of the first reinforcer does not matter. Visits to the P alternative following these strings of N-reinforcers (not shown), though uncommon, averaged about six presses.
The postchangeover visits shown in the right panel of Figure 7 typically were shorter than the postreinforcer visits (note the different scale on the y-axis). Most of the postchangeover visits were to the not-first-reinforced alternative (N) following a postreinforcer visit to the first-reinforced alternative (P). The decreasing line of filled triangles shows that second visits and some of the fourth visits to the N alternative got shorter as the number of reinforcers consecutively obtained on the P alternative increased [F(8,7789) = 86; p < .00001), suggesting the development of the sampling part of the fix-and-sample pattern. The single unfilled triangles (“P after N-Rf”) that jump off the filled triangles show visits to alternative P after discontinuations at the N alternative. They are mostly the second visits after an N-reinforcer, following the staying post-reinforcer visit at the N alternative. The increasing trend reflects development of the long visits of the fixing part of the fix-and-sample pattern, because visits to P usually were visits to the rich alternative. The upward trend was statistically significant [F(7, 1780) = 5.1; p < .00001].
The filled circles show postchangeover visits to the P alternative following a reinforcer from that alternative (mostly the third visit after a P-reinforcer, the second being to the N lever). Although they average only about six presses, their increasing trend from one to nine continuing P-reinforcers also is consistent with the development of the fixing part of the fix-and-sample pattern. However, the upward trend was not statistically significant. The unfilled circles (“N after N-Rf”) show visits to alternative N, mostly third visits after a discontinuation N-reinforcer. Consistent with the idea that lever P was the rich alternative and that the sampling part of the fix–and-sample pattern was developing, the post-changeover visits to the N alternative (i.e., samples) tended to be brief, even though they followed an N-reinforcer. The downward trend was not statistically significant [F(7, 1256); p = .058].
The line of unfilled triangles at the lower right (overlapping with filled triangles between reinforcers 6 to 8) shows post-changeover visits to alternative P following a string of six to nine reinforcers in a row from alternative N. That the data points can barely be seen shows again the symmetry of the results, indicating that the source of reinforcers more than five reinforcers ago has no effect (Figure 5). The four filled triangles going off those points show the effect of a discontinuation (P-reinforcer) following a string of N-reinforcers. That these postchangeover visits are similar to the corresponding unfilled triangles further demonstrates the symmetry of effects of strings of reinforcers six or more reinforcers long.
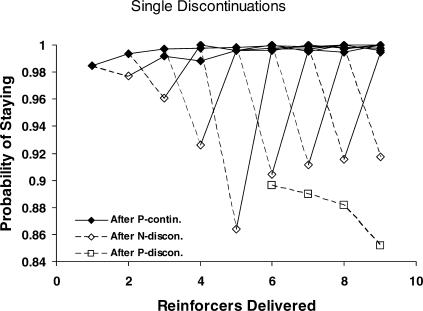
Although Figures 4 and 7 show the length of switched and staying postreinforcer visits, they give no indication of the relative frequency of these visits. Figure 8 shows the probability of staying at the just-reinforced lever following a series of continuing reinforcers or following a discontinuation reinforcer. That the probability never fell below 0.85 most likely resulted from the response cost (travel time) associated with the changeover response requirement. At the P first-reinforced lever (filled diamonds) and the N not-first-reinforced lever (not shown in Figure 8), the probability of staying after a few continuing reinforcers was always near 1.0. By contrast, the probability of staying was reliably affected after a discontinuation reinforcer. The unfilled diamonds show that the probability of staying at the not-first-reinforced (N) lever tended to decrease after a discontinuation N-reinforcer [F(1,3969) = 72; p < .00001). Following a series of continuing reinforcers from the N lever, the lower probability of staying (unfilled squares) after a discontinuation P-reinforcer supports the idea that the probability of staying on the lean lever tended to decrease and indicates that the performance was tending toward a fix-and-sample pattern, in which responding immediately switches back to the rich alternative following a reinforcer from the lean alternative. The downward trend for these four unfilled squares was not statistically significant, however, because too few of these sequences occurred. Within a component, one might not expect this probability to decrease to zero, as it did in the Baum et al. (1999) experiment, but the decrease in probability alone is suggestive; the cost of switching in the present study (a press on the changeover lever) might prevent the probability of staying from ever getting down to zero.
Fig 8. Probability that responding stayed at the just-reinforced lever following a series of continuing reinforcers from the first-reinforced (P) lever (filled diamonds), and following a series of continuing reinforcers from the first-reinforced lever ending with a discontinuation from the not-first-reinforced (N) lever (unfilled diamonds).
The figure shows group data. Unfilled squares indicate the probability of staying following a series of continuing reinforcers from the N lever ending with a discontinuation from the P lever.
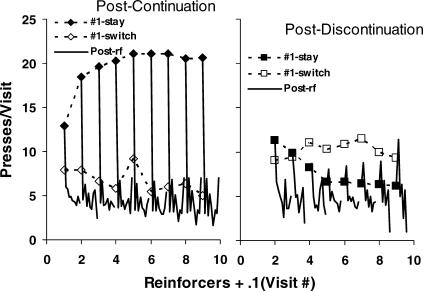
Figure 4 showed postreinforcer visits to the first-reinforced lever and those occurring to the not-first-reinforced lever, omitting visits after the first visit following a reinforcer. Figure 7 showed visits that followed a changeover rather than a reinforcer, but omitted details about the visits in their order of occurrence. Figure 9 shows visit lengths following continuations (left panel) and discontinuations (right panel) for visits in order following a reinforcer just received. The integers along the x-axis represent the number of reinforcers delivered, but between integers, the next nine visits after the first postreinforcer visit are shown with lines without symbols. As in Figure 7, the line of filled diamonds shows the first visit to the just-reinforced lever following a continuation, except that for Figure 9 the data were pooled across within-component position for the five-reinforcer sequences, as well as for the six-, seven-, eight-, and nine-reinforcer sequences. These visits also were calculated including postreinforcer visits that ended with the next reinforcer. Their inclusion had no appreciable effect (compare the filled diamonds of Figure 7 with those shown in Figure 9); stay postreinforcer visits lengthened with increasing number of continuing reinforcers in the same negatively accelerated way.
Fig 9. Visit length (presses per visit) following a series of continuing reinforcers (left graph) or following a series of continuing reinforcers ending with a discontinuation (right graph) for the first nine reinforcers in a component (group data).
Filled symbols show the first postreinforcer visit to the just-reinforced lever (#1 stay). Unfilled symbols show the first postreinforcer visit to the not-just-reinforced lever (#1 switch). The solid lines without symbols represent the subsequent nine postreinforcer visits (i.e., postchangeover visits) in order, plotted in tenths along the x-axis. Sample size was allowed to vary down to one visit.
The unfilled diamonds (left panel) show the visits to the not-just-reinforced lever (switched postreinforcer visits), which Figure 8 showed were always infrequent following a continuation. They correspond to the filled squares in Figure 7. When they occurred, they tended to be brief, similar to the postchangeover visits. The postchangeover visits, shown in order by the solid lines without symbols, tended to be brief, and all about the same after four successive reinforcers, but invariably much shorter than the stay postreinforcer visits. The saw-tooth, up-and-down pattern shows that the postchangeover visits to the just-reinforced lever tended to be longer than those to the not-just-reinforced lever, a result that also was observed in previous studies with pigeons (Baum & Davison, 2004; Davison & Baum, 2003). That difference between the peaks (just-reinforced lever) and troughs (not-just-reinforced lever) appears on average in Figure 7 (right panel) in the difference between the filled circles and the lower line of filled triangles. Two-way analysis of variance confirmed that this difference in Figure 7 was statistically significant [F(1,10206) = 588; p < .00001]. (The effect of reinforcers delivered and the interaction were also statistically significant.)
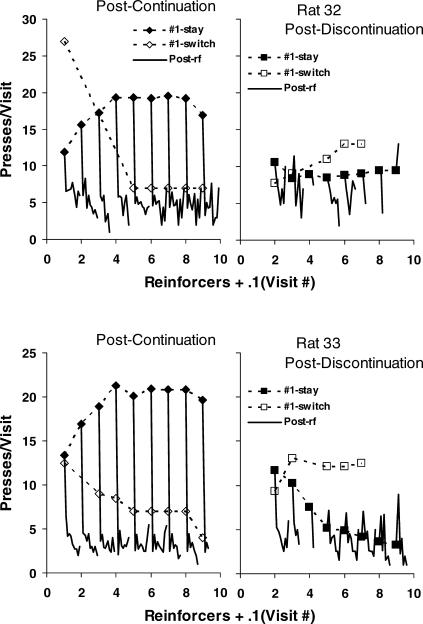
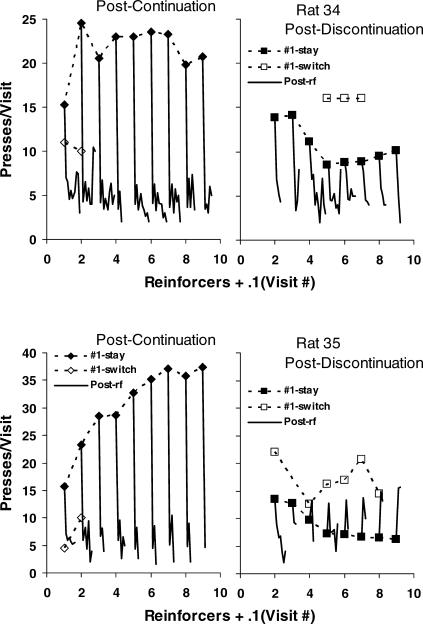
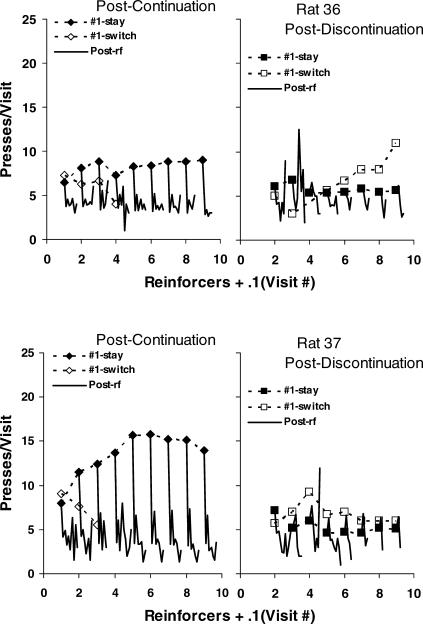
The right panel of Figure 9 shows visits following a discontinuation, making the just-reinforced lever the less-reinforced (lean) lever. The filled squares, corresponding to the unfilled squares in the left panel of Figure 7, show first postreinforcer visits to the just-reinforced lever, and the unfilled squares, corresponding to the unfilled diamonds in Figure 7, show first postreinforcer visits to the rich, not-just-reinforced lever. Postreinforcer visits to the just-reinforced lever decreased in length (and frequency; unfilled diamonds in Figure 8) as more prior reinforcers were obtained from the rich lever, in accord with the idea that the sampling part of fix and sample was developing. The solid lines without symbols show the postchangeover visits (second through ninth postreinforcer visits). These visits also tended to be brief, except for one remarkable phenomenon: the second visit, which was to the more-reinforced (rich) lever, lengthened as more reinforcers were delivered for that lever before the discontinuation (see the peaks in the solid lines). After seven or eight successive reinforcers and a discontinuation, visit number 2 was about as long as the switched postreinforcer visit to the rich side (unfilled squares). This accounts for the increasing trend shown by the upper set of unfilled triangles in Figure 7. The lengthening of the postchangeover visits to the rich alternative supports the idea that a fix-and-sample pattern was developing within components. The same phenomenon was not observed in previous studies with pigeons (i.e., Baum & Davison, 2004; Davison & Baum, 2003), indicating that in the present study the rats' performance was moving faster toward the fix-and-sample pattern than the pigeons' performance did in these previous studies. Figures A2 to A5 in the Appendix show that the group results in Figure 9 were representative of the individual rats' performance.
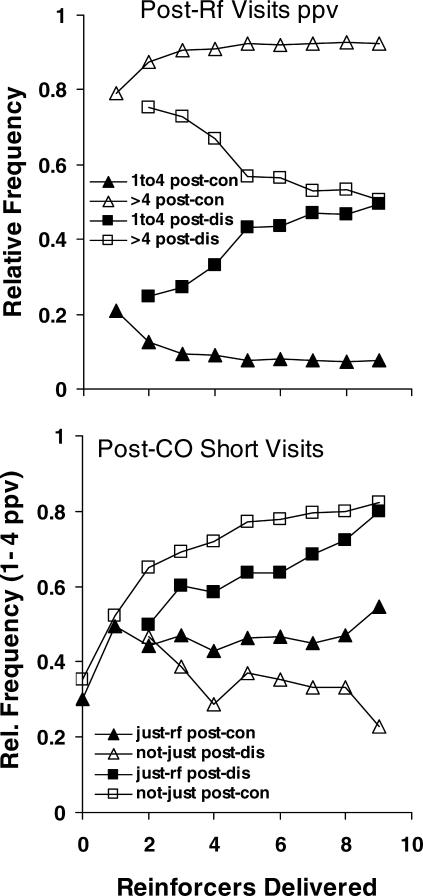
The brevity of the visits to the lean lever shown in Figure 9 suggests that these visits represent sampling of the lean lever. That visits to the rich lever tended to get longer indicates that fixing was developing. Figure 10 gives information about the relative frequencies of short visits (less than or equal to four presses) and of long visits (longer than four presses). The top panel shows relative frequencies of short (one to four responses) and long (more than four responses) postreinforcer visits, the first visits following a reinforcer. All visits ending with a reinforcer were excluded. Since the pairs of ordinates (triangle plus triangle and square plus square) must add to 1.0, one point is redundant for each pair. Only visits to the just-reinforced lever were counted, because switches immediately after a reinforcer, as shown in Figure 8, were uncommon. The triangles show frequencies of postcontinuation visits (one to four responses postcontinuation, and more than four responses postcontinuation). As more reinforcers were delivered from the same lever, the frequency of long visits went up (the unfilled triangles), while the frequency of short visit went down (the filled triangles). Analysis of variance on the first three points revealed that the increase was statistically significant [F(2,3567) = 32; p < .00001]. The squares show the frequencies of postdiscontinuation visits (one to four responses postdiscontinuation and more than four responses postdiscontinuation). As more reinforcers were delivered before the discontinuation, the frequency of short visits went up (the filled squares), while the frequency of long visits went down (the unfilled squares), until about half the visits were shorter than four presses. Analysis of variance revealed the decrease of long visits to be statistically significant [F(7,4647) = 18.8; p < .00001]. The trend shows no tendency to level off; had the number of reinforcers continued to accumulate, presumably the postreinforcer visits to the lean lever would have continued to shorten. Thus, the more reinforcers to the rich lever, the shorter the visits to the lean lever, confirming the idea that the visit pattern was progressing toward the fix-and-sample pattern.
Fig 10. Relative frequency of visits less than or equal to four presses and of visits longer than four presses for the first nine reinforcers in a component.
Top: First visit to the just-reinforced lever following a series of continuing reinforcers from the same lever (triangles) or following a series of continuing reinforcers ending with a discontinuation (squares). Bottom: Interreinforcer visits beginning with a changeover following a series of continuing reinforcers from the same lever or following a discontinuation. Filled symbols represent visits to the just-reinforced lever. Unfilled symbols represent visits to the not-just-reinforced lever. Triangles represent visits to the rich lever, and the squares represent visits to the lean lever. See text for more details.
The lower panel in Figure 10 capitalizes on the redundancy between long (more than four responses) and short (one to four responses) visit frequencies, illustrated in the top panel, to focus on the frequency of short postchangeover visits following the first postreinforcer visit (i.e., visit number 2 and more). The squares show results for the less-reinforced lever (the lean lever)—that is, the just-reinforced lever following a discontinuation (filled squares, just-rf post-dis) and the not-just-reinforced lever following a series of continuations (unfilled squares, not-just post-con). As progression toward fix and sample would predict, the relative frequency of short visits to the lean lever (filled and unfilled squares) increased as a function of reinforcers delivered to the rich lever (continuations). Two-way analysis of variance revealed no effect of postdiscontinuation versus postcontinuation [F(1,1091) = 1.2; p = .28, non-significant], and the increases to be statistically significant [F(7,1091) = 16; p < .00001]. The interaction was statistically significant [F(7, 1091) = 22; p < .00001], reflecting the difference in the slopes of the curves . The increase in frequency of short visits is a crucial result, because it indicates the move toward sampling of the lean lever. The triangles show visit frequencies to the rich lever—that is, the just-reinforced lever following a series of continuations (just-rf post-con) and the not-just-reinforced lever following a discontinuation (not-just post-con). Consistent with progression toward the fix-and-sample pattern, the relative frequency of short visits (unfilled triangles) decreased following a discontinuation as the number of prior continuations increased. Analysis of variance revealed this downward trend to be statistically significant [F(7,4647) = 8; p < .00001]. The exception was the frequency of short visits following a series of continuations (filled triangles), which did not decrease as more reinforcers were delivered at the rich lever. They remained at a relative frequency of about 0.5.
Discussion
Baum and Davison (2004), using a procedure in which seven different pairs of VI schedules changed unpredictably within a session and without cues accompanying them, presented results supporting three important conclusions concerning the molar view of behavior: (1) in choice situations of frequent environmental change the molar view of behavior offers a flexible approach to studying local patterns of behavior; (2) the molar view of behavior provides a rationale for examining both the pattern of behavior across alternatives (i.e., choice) and patterns of behavior within alternatives (i.e., visits); and (3) performance moves toward the fix-and-sample pattern discovered in long-term experiments on choice (Baum et al., 1999), even in dynamic situations where the reinforcer ratio changes frequently and behavior adjusts rapidly.
Consistent with Baum and Davison's (2004) findings, our results show that each reinforcer counts in determining the rats' preferences. With each successive reinforcer, a shift of response ratio occurred toward the lever from which the reinforcer came. When several reinforcers occurred in succession on the left or right lever, response ratio shifted progressively in the direction of the reinforced lever. Following a discontinuation of reinforcers on that lever (i.e., a reinforcer from the other lever), a shift in response ratio occurred toward the opposite lever (Figures 3 and 6). For continuing reinforcers the parts of each behavior ratio included the postreinforcer visit on the first-reinforced lever (P), subsequent visits to the not-first-reinforced lever (N), and visits back to the first-reinforced lever. In a parallel way, each behavior ratio for a discontinuation was composed of parts including the postreinforcer visit to N, subsequent visits to P, and visits back to N. For both continuing reinforcers and discontinuations, the correspondence between response ratios and postreinforcer visit length was remarkable; when all four reinforcers occurred on the left or the right lever, response ratio favored that lever, and postreinforcer visit length increased on that lever (Figures 4 and 7). Whenever a shift of reinforcer source occurred, a shift in response ratio followed, in which switched postreinforcer visits were always relatively short. These increases and decreases in response ratio were consistent with the development of fixing on the richer alternative while sampling the leaner alternative, the fix-and-sample pattern first reported in long-term experiments on choice (Baum et al., 1999) and recently demonstrated in dynamical situations (Baum & Davison, 2004). Thus, the present study and other experiments in which local effects of reinforcers were analyzed in concurrent performance (e.g., Davison & Baum, 2000, 2002; Landon & Davison, 2001; Landon, Davison, & Elliffe, 2003) support the idea that reinforcer-source sequences control preference between reinforcers, pulses in preference, and visits following reinforcers (i.e., Baum & Davison, 2004; Davison & Baum, 2003).
The present results led us to ask, how long a sequence will be free from effects of the source of the first reinforcer? In other words, for how long does the effect of a reinforcer last? The answer: about five reinforcers (Figure 5). The source of the first reinforcer did not matter for sequences of five or more reinforcers. Our findings also suggest that source sequences from five to seven reinforcers long can suffice for studying local effects of reinforcers with rats. We detected, however, a small but apparently systematic effect of the first reinforcer all the way out (Figure 6). This can be seen in the difference between series of uninterrupted continuations and series of continuations following a discontinuation. Because of this difference, we also included sequences of N (not-first-reinforced lever) reinforcers, which showed that the behavior ratios were almost exactly the same for series of N reinforcers as for the series of P reinforcers following a discontinuation, contradicting the anomalous result with P reinforcers and supporting the conclusion that the effect of the first reinforcer didn't matter for sequences of five or more reinforcers.
In addition, the present results revealed local regularities between postreinforcer visits and various sequences up to nine reinforcers in length similar to those found by Baum and Davison (2004) for sequences up to eight reinforcers. This finding may help to illuminate the process controlling the long postreinforcer visits. With pigeons as subjects, one might argue that preference pulses are due to elicitation and not to the discriminative functions of the response keys. This argument, however, carries less weight when rats are used as subjects. Furthermore, our results are consistent with those of Landon, Davison, and Elliffe (2002, 2003), who documented similar dynamical relations within stationary choice. Bell and Baum (2002) found indications of similar dynamics with foraging in a group of pigeons. The increases in postreinforcer visit length agree with the observation by Davison and Baum (2002, 2003) that the immediate effect of a reinforcer is a pulse of preference in favor of the source of the reinforcer.
The great majority of postreinforcer visits occurred at the just-reinforced lever (Figure 8). Switched visits (to the not-just-reinforced lever) were few and showed a decreasing trend with successive reinforcers (Figure 7), a result indicative of a fix-and-sample pattern (Baum et al., 1999). Further evidence supporting the development of the sampling part of fix and sample pattern came from the postchangeover visits, most of which were second and fourth visits to the not-just-reinforced lever following a postreinforcer visit to the just-reinforced lever (Figures 7 and 9). These postchangeover visits to the less-reinforced lever grew shorter and shorter with continuing reinforcers to the more-reinforced lever. Furthermore, the postchangeover visits to the not-first- reinforced lever decreased after a discontinuation reinforcer from that lever as the number of prior continuations increased (Figure 7), a result consistent with the idea (Baum & Davison, 2004) that the first-reinforced lever was usually the rich lever and the sampling part of the fix-and-sample pattern was developing. The increasing trend in postchangeover visits to the more-reinforced lever after a discontinuation reinforcer from the less-reinforced lever (Figure 9) also supports the development of the fixing part of the fix-and-sample pattern, in that visits to the continuing-reinforced lever were visits to the rich lever. Thus, in the present study the brevity of the visits to the lean lever indicates that these represented sampling of the lean lever, and the lengthening of visits to the rich lever indicates that fixing was developing.
As in previous studies with pigeons (Baum & Davison, 2004; Davison & Baum, 2003), in the present study the postchangeover visits to the just-reinforced lever were longer than those to the not-just-reinforced lever (Figures 7 and 9). Following a discontinuation reinforcer, the first postreinforcer visit to the rich not-just-reinforced lever increased with increasing number of prior reinforcers from that lever (Figure 9). Visit number 2, the first visit to the richer lever after a discontinuation, lengthened with more prior reinforcers to that lever, and after seven or eight successive reinforcers and a discontinuation, visit number 2 was about as long as the switched visit to the rich lever. This lengthening, not reported in previous studies with pigeons (e.g., Davison & Baum, 2002, 2003), indicates that in the present experiment the rats' performance was moving toward fix and sample faster than the pigeons' performance did (Baum & Davison, 2004).
If the brief visits to the not-just-reinforced lever indicate sampling of the lean lever and if the lengthening of visits to the rich lever indicates that fixing was developing, then the frequency of short visits should increase and decrease accordingly. This prediction was partially confirmed (Figure 10). The expected decrease appeared for postreinforcer visits to the rich lever and for postchangeover visits to the rich lever following a discontinuation, but failed to appear for postchangeover visits following a continuation. For the lean lever, relative frequency of short visits increased with increasing continuing reinforcers to the rich lever. On the whole, these results are consistent with progression toward the fix-and-sample pattern (Baum et al., 1999). Consistent with Baum and Davison's (2004) conclusions, the most important point is that the more reinforcers were delivered from the rich lever, the shorter became the visits to the lean lever.
In the present study, sensitivity to reinforcer ratio reached higher levels (0.9 for the group data and above 1.0 for some rats; Figure 2) than the levels of sensitivity (mean around 0.65) documented in studies with pigeons (Baum & Davison, 2004; Davison & Baum, 2000, 2002). This result probably was due to the changeover requirement. Our rats were required to move from the main panel to the back wall of the chamber (locomotion or travel) and to press on a changeover lever located there, whereas the studies with pigeons (e.g., Baum & Davison, 2004; Davison & Baum, 2000, 2002) employed a standard changeover delay or no changeover requirement at all. Accordingly, the present study confirms that when the choice situation requires locomotion to travel from one place to another (i.e., the cost of searching for food increases), sensitivity to differences in relative reinforcer rate increases (e.g., Aparicio, 2001; Aparicio & Baum, 1997; Aparicio & Cabrera, 2001; Baum, 1982; Boelens & Kop, 1983).
Moreover, the probability of staying on the same lever following a reinforcer was always close to 1.0, most likely due to our requiring travel to the changeover lever. Several studies have shown that switching from one alternative to another is reduced by a changeover response requirement (e.g., Pliskoff et al., 1978; Pliskoff & Fetterman, 1981). Consistent with the notion that performance was tending to fix and sample, the probability of staying at the lean lever (whether first-reinforced or not-first-reinforced) tended to decrease, although it never fell below 0.85. This decrease falls short of the finding of Baum et al. (1999) that, in the long term, the probability of staying at the lean alternative decreases to zero. The decrease in probability is suggestive, however; and the cost of switching in the present experiment (a response on the changeover lever) might have prevented the probability from decreasing to zero even in the long term.
In conclusion, the present study systematically replicated Baum and Davison's (2004) results and extended the generality of the fix-and-sample pattern (Baum, 2002; Baum et al., 1999) to the study of choice with rats, supporting the idea that the rats' performance tended toward the fix-and-sample pattern that has been reported in long-term studies of choice (Baum et al., 1999) and has been suggested to occur with pigeons in dynamical situations (Baum & Davison, 2004). Our findings replicated those obtained by Baum and Davison (2004), extending the generality of the molar view of behavior (Baum, 2002, 2003) to the study of choice with rats in environments with frequent changes. For instance, we found the same global and local patterns of choice proportions that Baum and Davison documented in previous studies (Baum & Davison, 2004; Davison & Baum, 2000, 2002). The visit-by-visit and reinforcer-by-reinforcer analyses, conducted across alternatives and within alternatives, confirmed the idea that the molar view of behavior offers flexibility in examining choice (Baum & Davison, 2004). Future research on choice ought to be open to further analysis at the local level to enhance our account of the fix-and-sample pattern found with both stationary choice and performance in transition.
Appendix
Fig A1. Depth analyses for the individual rats.
Details as in Figure 5.
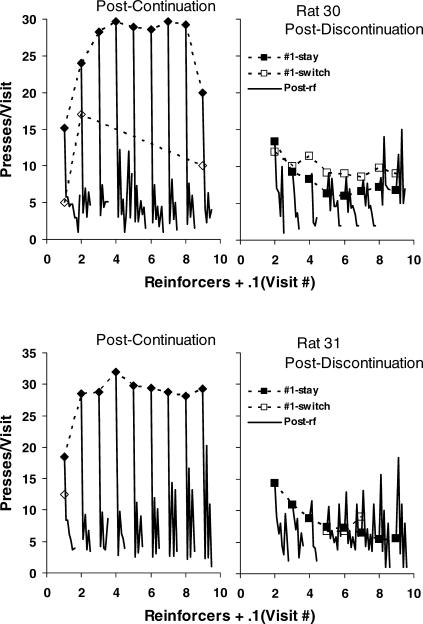
Fig A2. Postcontinuation and postdiscontinuation visits analyzed individually for Rats 30 and 31.
All details as in Figure 9.
Fig A3. Postcontinuation and postdiscontinuation visits analyzed individually for Rats 32 and 33.
All details as in Figure 9.
Fig A4. Postcontinuation and postdiscontinuation visits analyzed individually for Rats 34 and 35.
All details as in Figure 9.
Fig A5. Postcontinuation and postdiscontinuation visits analyzed individually for Rats 36 and 37.
All details as in Figure 9.
Footnotes
The National Council of Science and Technology (CONACyT) supported this research; Grant 42050-H. Portions of this paper were presented at the XXIX annual convention of the Association for Behavior Analysis, San Francisco 2003.
References
- Aparicio C.F. Overmatching in rats: The barrier choice paradigm. Journal of the Experimental Analysis of Behavior. 2001;75:93–106. doi: 10.1901/jeab.2001.75-93. [DOI] [PMC free article] [PubMed] [Google Scholar]
- Aparicio C.F, Baum W.M. Comparing locomotion with lever-press travel in an operant simulation of foraging. Journal of the Experimental Analysis of Behavior. 1997;68:177–192. doi: 10.1901/jeab.1997.68-177. [DOI] [PMC free article] [PubMed] [Google Scholar]
- Aparicio C.F, Cabrera F. Choice with multiple alternatives: The barrier choice paradigm. Mexican Journal of Behavior Analysis. 2001;27:97–118. [Google Scholar]
- Bailey J.T, Mazur J.E. Choice behavior in transition: Development of preference for the higher probability of reinforcement. Journal of the Experimental Analysis of Behavior. 1990;53:409–422. doi: 10.1901/jeab.1990.53-409. [DOI] [PMC free article] [PubMed] [Google Scholar]
- Baum W.M. On two types of deviation from the matching law: Bias and undermatching. Journal of the Experimental Analysis of Behavior. 1974;22:231–242. doi: 10.1901/jeab.1974.22-231. [DOI] [PMC free article] [PubMed] [Google Scholar]
- Baum W.M. Choice, changeover, and travel. Journal of the Experimental Analysis of Behavior. 1982;38:35–49. doi: 10.1901/jeab.1982.38-35. [DOI] [PMC free article] [PubMed] [Google Scholar]
- Baum W.M. Introduction to molar behavior analysis. Mexican Journal of Behavior Analysis. 1995;21:17–36. [Google Scholar]
- Baum W.M. The trouble with time. In: Hayes L.J, Ghezzi P.M, editors. Investigations in behavioral epistemology. Reno, NV: Context Press; 1997. pp. 47–59. In. eds. [Google Scholar]
- Baum W.M. Molar versus molecular as a paradigm clash. Journal of the Experimental Analysis of Behavior. 2001;75:338–341. doi: 10.1901/jeab.2001.75-338. [DOI] [PMC free article] [PubMed] [Google Scholar]
- Baum W.M. From molecular to molar: A paradigm shift in behavior analysis. Journal of the Experimental Analysis of Behavior. 2002;78:95–116. doi: 10.1901/jeab.2002.78-95. [DOI] [PMC free article] [PubMed] [Google Scholar]
- Baum W.M. The molar view of behavior and its usefulness in behavior analysis. Behavior Analyst Today. 2003;4:78–81. [Google Scholar]
- Baum W.M, Aparicio C.F. Optimality and concurrent variable-interval variable-ratio schedules. Journal of the Experimental Analysis of Behavior. 1999;71:75–89. doi: 10.1901/jeab.1999.71-75. [DOI] [PMC free article] [PubMed] [Google Scholar]
- Baum W.M, Davison M. Choice in a variable environment: Visit patterns in the dynamics of choice. Journal of the Experimental Analysis of Behavior. 2004;81:85–127. doi: 10.1901/jeab.2004.81-85. [DOI] [PMC free article] [PubMed] [Google Scholar]
- Baum W.M, Schwendiman J.W, Bell K.E. Choice, contingency discrimination, and foraging theory. Journal of the Experimental Analysis of Behavior. 1999;71:355–373. doi: 10.1901/jeab.1999.71-355. [DOI] [PMC free article] [PubMed] [Google Scholar]
- Belke T.W, Heyman G.M. Increasing and signaling background reinforcement: Effect on the foreground response–reinforcer relation. Journal of the Experimental Analysis of Behavior. 1994;61:65–81. doi: 10.1901/jeab.1994.61-65. [DOI] [PMC free article] [PubMed] [Google Scholar]
- Bell K.E, Baum W.M. Group foraging sensitivity to predictable and unpredictable changes in food distribution: Past experience or present circumstances? Journal of the Experimental Analysis of Behavior. 2002;78:179–194. doi: 10.1901/jeab.2002.78-179. [DOI] [PMC free article] [PubMed] [Google Scholar]
- Boelens H, Kop P.F.M. Concurrent schedules: Spatial separation of response alternatives. Journal of the Experimental Analysis of Behavior. 1983;40:35–45. doi: 10.1901/jeab.1983.40-35. [DOI] [PMC free article] [PubMed] [Google Scholar]
- Brown P.L, Jenkins H.M. Auto-shaping of the pigeon's keypeck. Journal of the Experimental Analysis of Behavior. 1968;11:1–8. doi: 10.1901/jeab.1968.11-1. [DOI] [PMC free article] [PubMed] [Google Scholar]
- Catania A.C. The flight from experimental analysis. In: Bradshaw C.M, Szabadi E, Lowe C.F, editors. Quantification of steady-state operant behavior. Amsterdam: Elsevier North-Holland; 1981. pp. 49–64. In. eds. [Google Scholar]
- Davison M, Baum W.M. Choice in a variable environment: Every reinforcer counts. Journal of the Experimental Analysis of Behavior. 2000;74:1–24. doi: 10.1901/jeab.2000.74-1. [DOI] [PMC free article] [PubMed] [Google Scholar]
- Davison M, Baum W.M. Choice in a variable environment: Effects of blackout duration and extinction between components. Journal of the Experimental Analysis of Behavior. 2002;77:65–89. doi: 10.1901/jeab.2002.77-65. [DOI] [PMC free article] [PubMed] [Google Scholar]
- Davison M, Baum W.M. Every reinforcer counts: Reinforcer magnitude and local preference. Journal of the Experimental Analysis of Behavior. 2003;80:95–129. doi: 10.1901/jeab.2003.80-95. [DOI] [PMC free article] [PubMed] [Google Scholar]
- Herrnstein R.J. Relative and absolute strength of response as a function of frequency of reinforcement. Journal of the Experimental Analysis of Behavior. 1961;4:267–272. doi: 10.1901/jeab.1961.4-267. [DOI] [PMC free article] [PubMed] [Google Scholar]
- Hinson J.M, Staddon J.E.R. Matching, maximizing, and hill-climbing. Journal of the Experimental Analysis of Behavior. 1983;40:321–331. doi: 10.1901/jeab.1983.40-321. [DOI] [PMC free article] [PubMed] [Google Scholar]
- Hunter I, Davison M. Determination of a behavioral transfer function: White noise analysis of session-to-session response-ratio dynamics on concurrent VI VI schedules. Journal of the Experimental Analysis of Behavior. 1985;43:43–59. doi: 10.1901/jeab.1985.43-43. [DOI] [PMC free article] [PubMed] [Google Scholar]
- Landon J, Davison M. Reinforcer-ratio variation and its effects on rate of adaptation. Journal of the Experimental Analysis of Behavior. 2001;75:207–234. doi: 10.1901/jeab.2001.75-207. [DOI] [PMC free article] [PubMed] [Google Scholar]
- Landon J, Davison M, Elliffe D. Concurrent schedules: Short-and long-term effects of reinforcers. Journal of the Experimental Analysis of Behavior. 2002;77:257–271. doi: 10.1901/jeab.2002.77-257. [DOI] [PMC free article] [PubMed] [Google Scholar]
- Landon J, Davison M, Elliffe D. Concurrent schedules: Reinforcer magnitude effects. Journal of the Experimental Analysis of Behavior. 2003;79:351–365. doi: 10.1901/jeab.2003.79-351. [DOI] [PMC free article] [PubMed] [Google Scholar]
- Mazur J.E. Choice behavior in transition. Development of preference with ratio and interval schedules. Journal of Experimental Psychology: Animal Behavior Processes. 1992;18:364–378. doi: 10.1037//0097-7403.18.4.364. [DOI] [PubMed] [Google Scholar]
- Mazur J.E. Development of preference and spontaneous recovery in choice behavior with concurrent variable-interval schedules. Animal Learning and Behavior. 1995;23:93–103. [Google Scholar]
- Mazur J.E. Past experience, recency, and spontaneous recovery in choice behavior. Animal Learning & Behavior. 1996;24:1–10. [Google Scholar]
- Mazur J.E. Effects of rate of reinforcement and rate of change on choice behavior in transition. Quarterly Journal of Experimental Psychology. 1997;50b:111–128. doi: 10.1080/713932646. [DOI] [PubMed] [Google Scholar]
- Mazur J.E, Ratti T.A. Choice behavior in transition: Development of preference in a free-operant procedure. Animal Learning and Behavior. 1991;19:241–248. [Google Scholar]
- Pliskoff S.S, Cicerone R, Nelson T.D. Local response-rate constancy on concurrent variable-interval schedules of reinforcement. Journal of the Experimental Analysis of Behavior. 1978;29:431–446. doi: 10.1901/jeab.1978.29-431. [DOI] [PMC free article] [PubMed] [Google Scholar]
- Pliskoff S.S, Fetterman J.G. Undermatching and overmatching: The fixed-ratio changeover requirement. Journal of the Experimental Analysis of Behavior. 1981;36:21–27. doi: 10.1901/jeab.1981.36-21. [DOI] [PMC free article] [PubMed] [Google Scholar]
- Schofield G, Davison M. Nonstable concurrent choice in pigeons. Journal of the Experimental Analysis of Behavior. 1997;68:219–232. doi: 10.1901/jeab.1997.68-219. [DOI] [PMC free article] [PubMed] [Google Scholar]
- Skinner B.F. Cumulative record (Enlarged ed., pp. 347–366) New York: Appleton-Century-Crofts; 1961. The generic nature of the concepts of stimulus and response. In. (Original work published 1935). [Google Scholar]
- Stubbs D.A, Pliskoff S.S, Reid H.M. Concurrent schedules: A quantitative relation between changeover behavior and its consequences. Journal of the Experimental Analysis of Behavior. 1977;27:85–96. doi: 10.1901/jeab.1977.27-85. [DOI] [PMC free article] [PubMed] [Google Scholar]


