Abstract
We trained four pigeons to discriminate a Michotte launching animation from three other animations using a go/no-go task. The pigeons received food for pecking at one of the animations, but not for pecking at the others. The four animations featured two types of interactions among objects: causal (direct launching) and noncausal (delayed, distal, and distal & delayed). Two pigeons were reinforced for pecking at the causal interaction, but not at the noncausal interactions; two other pigeons were reinforced for pecking at the distal & delayed interaction, but not at the other interactions. Both discriminations proved difficult for the pigeons to master; later tests suggested that the pigeons often learned the discriminations by attending to subtle stimulus properties other than the intended ones.
Keywords: causation, animated motion, Michotte's launching effect, discrimination, key peck, pigeons
Identifying causal relations, such as the actions that produce food, attract mates, or prompt aggression by others, ought to be fundamental to survival in every species. In most species, these and many other vital determinations are not the result of careful, deliberative processes, but are the consequence of fundamental learning processes or generalization from prior learning. An organism that can respond quickly to potential causes of good or bad outcomes may rapidly change its behavior to produce, avoid, or prepare for these outcomes. Such rapid decision-making could confer a fitness advantage that may outweigh the slower, more deliberative decision-making strategies that involve Bayesian inference, probability theory, and the computation of expected utility. Although one might argue that the brains of vertebrates have effectively evolved to compute these complex quantities, simpler neural solutions may exist that, although suboptimal, are nonetheless adaptively satisfactory. A “fast and frugal heuristic” (Gigerenzer & Goldstein, 1996) can be superior for ensuring survival in the unforgiving environs that most organisms inhabit.
Indeed, considerable evidence now suggests that even humans are unlikely to engage in careful deliberations most of the time (cf. Greenwald, 1992; Lewicki, Hill, & Czyzewska, 1997; Sloman, 1996). Although infants, children, and adults must acquire knowledge about prevailing causal relations, much of this knowledge is likely to be implicit and automatic, guiding our behavior in ways that we cannot readily appreciate or describe (e.g., Bargh & Ferguson, 2000; Nisbett & Wilson, 1977; Wegner, 2002). The development of the fields of mathematics, logic, and economics clearly indicates that people can leverage normative methods to improve decision-making, but very few people are trained in these fields. And, even after training, people have difficulty applying this knowledge to everyday decision-making (e.g., Ploger & Wilson, 1991).
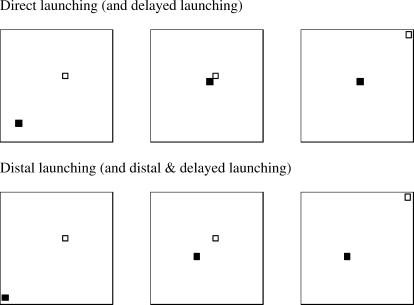
One commonly cited case of causal attribution that many theorists believe to be “direct” and not deliberative occurs when an object appears to strike and move another—Michotte's famous launching effect (e.g., Michotte, 1946/1963, see Figure 1). Multiple observations may be unnecessary; from the outset, it either looks like the first object caused the second one to move or it does not. It is unknown whether this attribution is the product of generalization from many similar relations experienced earlier or if it is innate (the result of neural pathways formed during prenatal development). Regardless, the early emergence (by 6 months of age) of the ability to quickly discriminate causal from noncausal launches (Leslie & Keeble, 1987) raises the question of whether other species also readily make the same distinction. We decided to explore this question using a species with excellent visual ability that inhabits a very different niche from that of an infant—the pigeon.
Fig 1. Top row: three frames from the direct launching animation: the first frame, the frame of contact, and the final frame.
Bottom row: three frames from the distal animation involving a spatial gap: the first frame, the frame at which the first object stops moving, and the final frame. The delayed versions are indistinguishable except that the middle frame persisted for 5 s. The red square (in the actual animation) is shown as a filled black square and the green square as an unfilled black square. The actual animations are available at: http://www.psychology.siu.edu/bcs/facultypages/young/Research/Supplemental.html.
The pigeon's world is replete with object interactions. Twigs are gathered and woven into nests, in-flight collisions with conspecifics are adroitly avoided, and beaks are used both to scoop and to peck seeds. Pigeons have been shown to discriminate different types of pigeon movements (Dittrich, Lea, Barrett, & Gurr, 1998), to respond to apparent motion as though it was real motion (Siegel, 1970), and to identify the direction of motion of a foreground object against a static background (Goto & Lea, 2003). These findings prompted the question of whether a pigeon could learn to respond differentially to causal versus noncausal object interactions when those interactions are simply observed, rather than interactions in which the pigeon itself participates.
The work of Leslie and Keeble (1987) suggests that relatively young infants distinguish interactions in which an object contacts and immediately launches another object from similar interactions involving a temporal delay to launching or no spatial contact between the objects. The present study involved stimuli like those used by Leslie and Keeble to determine whether pigeons can discriminate causal from noncausal interactions. If the pigeon can master this kind of discrimination, then the readiness with which this skill emerges might suggest the degree to which this ability is fundamental, although rapid learning would not by itself answer the question of whether the ability is innate or learned.
We trained pigeons to discriminate one type of launching animation from three other types using a go/no-go task. Each pigeon was reinforced for pecking at one type of animation but not for pecking at the other three. The direct launching animation involved a red square moving diagonally from the lower left area of the display to the middle of the display and contacting a green square that immediately moved along the same trajectory to the upper right area of the display (see Figure 1). The other three animations involved either a 5-s delay (the delayed animation) between the stopping of the red square and the launch of the green square, a 1.5-cm gap (the distal animation) between the termination point of the red square and the onset point of the green square, or both a 5-s delay and a 1.5-cm gap (the distal & delayed animation). The four animations represented two classes: causal (direct launching) and noncausal (delayed, distal, and distal & delayed).
If pigeons discriminate causal interactions between objects, then pigeons trained to peck at direct launching animations, but not at the noncausal animations, should find the task easier than pigeons trained to peck at one particular noncausal animation (distal & delayed) but not at any of the other animations (cf. the infant habituation design used by Leslie & Keeble, 1987).
Method
Subjects
Four feral pigeons (Columba livia) were kept at 85% of their free-feeding weights by controlled feeding. Fluorescent lighting in the colony room was on from 7 a.m. to 9 p.m. daily; otherwise the room was dark.
Apparatus
The experiment used four specially constructed (29 × 38 × 38 cm, height, width, and length, respectively) unenclosed operant chambers. One plywood wall of each chamber contained a large opening with an aluminum frame. The frame held a clear touch screen (DuraTouch Model #70056-001, Elmwood Sensors, Pawtucket, RI); pecks on the touch screen were processed by a serial controller board (Model #E271-2200, Elographics, Oak Ridge, TN). A brushed aluminum panel was placed directly in front of the touch screen to allow the pigeons access to circumscribed areas of a video monitor (13-in AppleColor High-Resolution RGB) that was located 0.9 cm behind the touch screen at its center and 1.1 cm at the outer edges (the difference being due to the slightly convex curvature of the face of the monitor). There were five openings in the panel: a 7.0-cm × 7.0-cm square central display area in which animations appeared and four round “report” areas (1.9-cm diameter) located 2.3 cm from each of the four corners of the central opening. The four report areas were not used in the present study. A clear Plexiglas food cup was centered on the rear wall of the chamber. A pellet dispenser (ENV-203, Med Associates, Lafayette, IN) delivered 45-mg Noyes pigeon pellets through a vinyl tube into the food cup. A houselight, mounted on the upper rear wall of the chamber, provided illumination during experimental sessions. The houselight and pellet dispenser were controlled by a digital input/output (I/O) interface board (Model #NC-DIO-24, National Instruments, Austin, TX).
The monitor, pellet dispenser, and houselight, as well as recording of the pigeon's responses within each chamber, were controlled by Apple Macintosh IIci computers (via the I/O interface card). A video splitter (VOPEX-2M, Network Technologies Inc., Aurora OH) connected each computer to the pigeon's monitor and to an identical monitor located in an adjacent room. Programs for the presentation of video stimuli and control of the houselight and feeder were developed in HyperCard (Version 2.3, 1995).
Visual Stimuli and Experimental Design
All animations were created using Mathematica™ and run at 15 frames per s (well within the range of speeds at which pigeons identify apparent motion; Siegel, 1970). The background of the animations was a 7.73 cm × 7.73 cm (203 × 203 pixels) white square. The objects within the animations were 0.35-cm × 0.35-cm squares (green and red). The squares followed a 10.93-cm diagonal trajectory from the lower left corner of the display to the upper right corner of the display (we chose movement along the diagonal to maximize the time of exposure to object movement). The center of the red square was initially located 2.06 cm from the lower left corner of the stimulus window; the green square was initially located 6.38 cm from the lower left corner of the stimulus window.
During training, pigeons viewed four animations (these can be viewed at http://www.psychology.siu.edu/bcs/facultypages/young/Research/Supplemental.html). In the direct launching animation (see the top panel of Figure 1), the red square in the lower left portion of the display moved diagonally across the screen for 5 s, where it came into contact with the green square and stopped. Immediately after contact, the green square began to move diagonally from the middle toward the upper right of the screen. The green square continued along this trajectory for 5.2 s.
In creating the other three training animations, we held the motion path, movement rate, and initial location of the green square constant and only varied aspects of the animation preceding the green square's motion. This method ensured that pecking behavior during the green square's motion would be produced by the action of the red square or the interaction between the squares and not be due to changes in the action of the green square in isolation.
For the distal animation, the time of movement was identical to that of the direct launching animation, but the red square's initial position was shifted 1.50 cm toward the lower-left corner of the display while the green square remained in the same position as in the direct launching animation. Because the rate and duration of motion of the red square were unchanged, the red square stopped 1.50 cm short of the green square.
For the delayed animation, the pigeons saw the same red and green squares move in the same trajectory as in the direct launching animation but with the addition of a 5-s delay at the point of contact between the red and green squares. Consequently, the entire animation was 15.2 s long.
Finally, the distal & delayed animation involved both a temporal delay and a spatial gap. Thus, the timeline was the same as the delayed animation coupled with the spatial trajectories from the distal animation.
The stimuli used during the testing phase of the experiment included five animations in addition to those described above. These stimuli were devised to test for control by the initial position of the red square and by the length of the time that passed before the onset of the green square's motion. These two cues were diagnostic of the discrimination and might have been used in lieu of delay and gap. The first testing animation manipulated the speed at which the red square moved across the screen within the direct launching animation. The red square took 9 s to reach the launching point. The second testing animation manipulated the speed at which the red square moved across the screen within the distal animation with the speed matching that in the first testing animation. The third testing animation changed the starting location of the red square within the direct launching animation to match that for the distal animation (1.50 cm closer to the lower left corner). The fourth testing animation changed the starting location of the red square within the delayed animation to match that of the third testing animation. The final testing animation was a combination of the previous two tests, where both the speed and the starting location of the red square were manipulated within the direct launching animation to be identical to those of the first and third testing animations.
Procedure
The pigeons were pretrained to peck at the central display area on a fixed-ratio (FR) 30 schedule. The central area was randomly colored red, green, blue, or yellow to maximize generalization to the subsequent training stimuli; in this way no novel colors would be encountered during training. Pretraining began at FR 1. Each pigeon was progressively moved to leaner schedules until it reached FR 30.
During the training and testing periods, each trial began with the presentation of a white square region that filled the central display area and with a centrally located cross. A single peck within this region (the orienting response) removed this square and began the animation that was designated for the trial. The latency and location of pecks during the animation were recorded.
On S+ trials (go trials), in order to receive reinforcement, a pigeon was required to peck at least once while the target object (the green square) was in motion. This response resulted in a flash of the houselight after completion of the animation (the houselight was turned off for 333 ms, then on again) immediately followed by the presentation of pellets to the feeder. The number of pellets was chosen individually for each pigeon on each day in order to maintain its 85% free-feed weight. On S− trials (no-go trials), the trial terminated after the end of the animation. All trials were immediately followed by a randomly determined 5- to 10-s intertrial interval.
Training lasted for 226 sessions regardless of performance. The pigeons progressed through one session each day, 7 days a week. Training sessions consisted of two S+ warm-up trials followed by eight blocks of 12 trials (a total of 98 trials). Each block comprised four S+ trials (which varied from pigeon to pigeon to be either direct launching or distal & delayed), and two trials each of direct launching, delayed, distal, and distal & delayed; the order within each block was randomized. Pigeons 182w and 6r were trained with the direct launching animation as the S+ whereas pigeons 94w and 43r were trained with the distal & delayed animation as the S+.
Sessions during the testing phase consisted of two S+ warm-up trials followed by six randomized blocks of 29 trials (a total of 176 trials). Each block comprised eight S+ trials, four trials each of direct launching, delayed, distal, and distal & delayed animations, and one trial each of the five testing animations. No reinforcement was provided on any of the testing trials other than the S+ trials designated for a particular pigeon.
Results
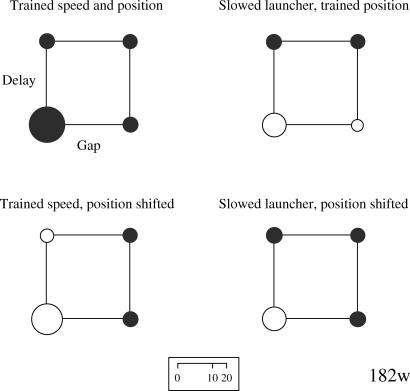
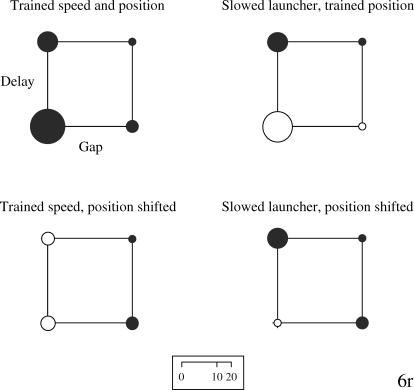
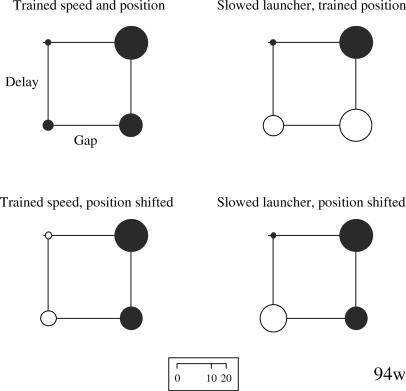
Although one pigeon (43r) failed to discriminate all of the S− stimuli from the S+ stimuli (our training criterion was a peck rate for each S− stimulus that was one-third or less of the rate to the S+), training was terminated after 226 sessions. The four subjects' performance during the testing phase is shown in the form of bubble charts in Figures 2 through 5. This type of display proved the most transparent method of displaying the results by allowing relevant comparisons of the effects of the manipulations on the overall discrimination. The area of each bubble is designed to reflect the overall peck rate (e.g., doubling the peck rate doubles the area), thus the scale that indexes bubble diameter as it relates to the rate of pecking is not linear.
Fig 2. Bubble charts for Pigeon 182w's rate of pecking to each of the training and testing stimuli.
The bubbles are arranged along the two dimensions of spatial gap (no gap at the left, a gap at the right) and temporal delay (none at the bottom, a delay at the top). The direct causal animation was the S+. The dark circles designate the training stimuli and are constant across all four charts. The white circles designate those animations used in testing in which the red square was slowed, had its initial position shifted, or both. Circle area corresponds to the peck rate, and thus the peck rate scale (at the bottom) is not linear as a function of circle diameter. See text for additional details.
Fig 3. Bubble charts for Pigeon 6r's rate of pecking to each of the training and testing stimuli.
The bubbles are arranged along the two dimensions of spatial gap (no gap at the left, a gap at the right) and temporal delay (none at the bottom, a delay at the top). The direct causal animation was the S+. See text for additional details.
Fig 4. Bubble charts for Pigeon 94w's rate of pecking to each of the training and testing stimuli.
The bubbles are arranged along the two dimensions of spatial gap (no gap at the left, a gap at the right) and temporal delay (none at the bottom, a delay at the top). The distal & delayed animation was the S+. See text for additional details.
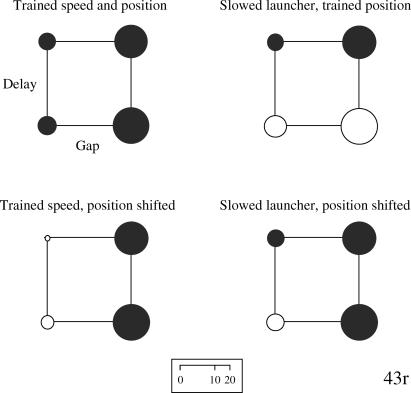
Fig 5. Bubble charts for Pigeon 43r's rate of pecking to each of the training and testing stimuli.
The bubbles are arranged along the two dimensions of spatial gap (no gap at the left, a gap at the right) and temporal delay (none at the bottom, a delay at the top). The distal & delayed animation was the S+. See text for additional details.
The upper left chart for each pigeon shows the rates of pecking to each of the four training stimuli during the testing phase. Within the chart, the lower left bubble indicates the rate of pecking to the direct launching animation. The upper left bubble indicates the rate to the delayed launch animation, the lower right bubble the rate to the distal launch animation, and the upper right bubble the rate to the distal & delayed launch animation. Thus, the bubble associated with reinforcement during training (the S+) should have the largest diameter. The other three bubble charts reflect changes in responding to the animations used in the testing phase.
Because each pigeon showed distinctly different response patterns to the testing stimuli, we will consider each individually to determine which variables were controlling responding for each pigeon. The rate of pecking per trial during the green square's movement (which will be influenced by those animation features that precede its motion onset) was subjected to an analysis of variance (ANOVA) for each pigeon followed by a Newman-Keuls post-hoc test (α = .05). In a second set of analyses, we examined the spatial distribution of pecks to each of the training stimuli to determine whether there was evidence that (a) the pigeons were tracking the objects, (b) whether the spatial pattern of responding differed across stimuli, and (c) whether different spatial patterns reflected differences in discriminative performance (see below).
Analysis of Pecking Rates
During training, Pigeon 182w exhibited good discrimination of the S+ stimulus from the three S− stimuli (upper left chart in Figure 2) both collectively, t(63) = 10.72, p < .05, and individually. When the two nondelay animations, direct launching and distal, were slowed (upper right chart in Figure 2), the discrimination between the slowed direct launching and the other three animations was weaker but remained statistically significant, t(63) = 3.98, p < .05. When the starting locations of the squares were shifted for the two nondistal animations, direct launching and delayed, to match those in the distal animations (lower left chart in Figure 2), the discrimination was slightly weaker than without the shift and remained statistically significant, t(63) = 7.91, p < .05. Finally, when the direct launching animation was both slowed and the squares' starting points were shifted (lower right chart in Figure 2), the discrimination between the direct launching and the other animations used in training remained statistically significant, t(63) = 3.54, p < .05. Thus, this subject showed robust discrimination of the direct launching animation from the other animations, although its discriminative performance was weakened by slowing the red square's motion and by shifting the starting location of the squares.
Pigeon 6r exhibited good discrimination of the S+ stimulus from the three S− stimuli (upper left chart in Figure 3), both collectively, t(63) = 10.72, p < .05, and individually. When the two nondelay animations were slowed (upper right chart in Figure 3), the discrimination between the slowed direct launching and the other three animations was slightly weaker, and it was still statistically significant, t(63) = 8.97, p < .05. When the starting points of the squares were shifted for the two nondistal animations to match those in the distal animations (lower left chart in Figure 3), however, the discrimination was no longer significant, t(63) = 1.12, p = .27. Finally, when the direct launching was both slowed and the squares' starting points were shifted, the discrimination was again no longer significant, t(63) = −1.55, p = .13. Thus, this pigeon's discrimination of the direct launching from the other animations was robust only when the original starting points of the squares were retained and the speed of the red square was slowed.
Pigeon 94w exhibited good discrimination of the S+ stimulus from the S− three stimuli (upper left chart in Figure 4), both collectively, t(63) = 17.85, p < .05, and individually. When the two nondelay animations were slowed (upper right chart in Figure 4), the discrimination remained significant, t(63) = 11.43, p < .05, but the individual comparison of delayed & distal with distal was not. When the starting points of the squares were shifted for the two nondistal animations to match those in the distal animations (lower left chart in Figure 4), the discrimination was still statistically significant, t(63) = 17.39, p < .05. Finally, when the direct launching was both slowed and the squares' starting points were shifted, the discrimination was again significant, t(63) = 14.09, p < .05. Thus, this pigeon discriminated the direct launching animation from the other animations across changes in the squares' starting locations, but it did not discriminate when the original locations remained the same but the speed of the red square changed.
Although Pigeon 43r exhibited statistical discrimination of the S+ stimulus from the S− three stimuli collectively, t(63) = 4.15, p < .05, the Newman-Keuls post hoc tests revealed discrimination of the spatial gap between the squares but not the delay (upper left chart in Figure 5). Given the failure to discriminate delays during training, it was not surprising that, when the two nondelay animations were slowed (upper right chart in Figure 5), performance was unaffected. When the starting points of the squares were shifted for the two nondistal animations to match those in the distal animations (lower left chart in Figure 5), the discrimination on the basis of gap was unaffected. Finally, when the direct launching was both slowed and the squares' starting points were shifted, the discrimination remained the same (lower right chart). Thus, this pigeon showed discrimination on the basis of the spatial gap that was robust across the objects' starting locations, but it failed to discriminate on the basis of delay.
In summary, 3 of the 4 pigeons mastered the original discrimination, but only 1 of them—Pigeon 182w—did so using both of the designated stimulus dimensions (size of gap and size of delay).
Analysis of Response Location
In our final set of analyses, we examined the location of pecks to the training animations during the testing phase. As previously noted, we were interested in three questions: (a) Were the pigeons tracking the squares? (b) Did the spatial patterns of responding differ across the four animation types? (c) Were differences in those spatial patterns indicative of discriminative performance?
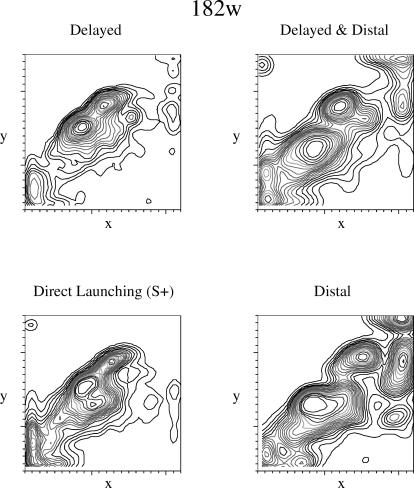
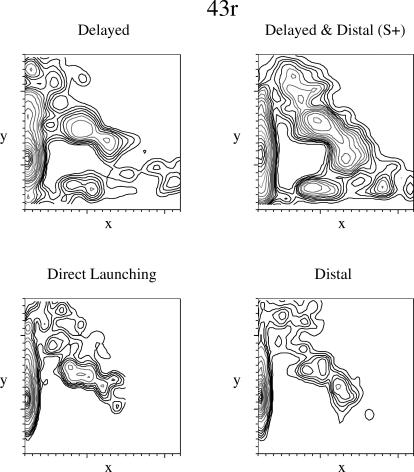
In order to focus on relative response location (effectively holding the rate of pecking constant), we created a nonparametric density plot that generated a smooth surface to describe how dense the pecks were at each location in the entire display. The plot adds a set of contour lines that identify the quantile contours (lowest 5%, lowest 10%, etc.). The plots can be read like a topographic map with height corresponding to peck density. As the number of tiers (5% quantile contours) between the flat background and an enclosed area increases, the higher the peak for the enclosed area (i.e., the higher the density of pecks within this region). Figure 6 illustrates the results for Pigeon 182w. If the pigeon was tracking the squares, then pecks should have predominated on the positive diagonal along which the objects moved. The relative density of the pecks along this diagonal also may reflect relative discriminative control by location. The density plots are for each of the training stimuli during the testing phase; there were too few pecks to the testing stimuli to generate coherent density plots.
Fig 6. Density plots for peck location for Pigeon 182w.
The x- and y-axes indicate the x- and y-coordinates on the display. See the text for additional details.
Pigeon 182w's pecks were located predominately along the part of the diagonal that traced the path of the red square and, also, especially near the point of contact between the squares (note the two density peaks in the middle of Figure 6). There are discernible differences in the four density plots. The spread in peck location appears wider in the three nonreinforced animations than in the reinforced animation, especially for those animations involving a spatial gap. The bubble chart (Figure 2) also reflected the distinctness of the direct launching.
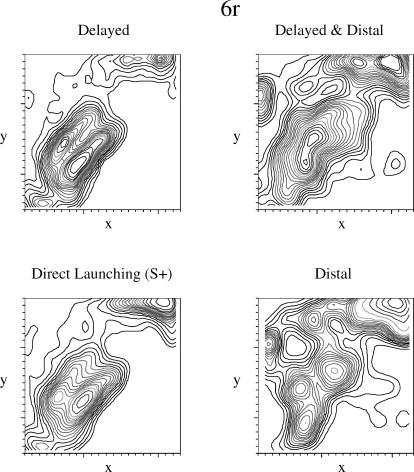
Similarly, Pigeon 6r's pecks (see Figure 7) were predominately located along the positive diagonal, with most of the pecks located along the path of the red square and at the termination point of the green square. The delayed animation produced a density plot that was similar to that for the reinforced direct launching. Pecking was more diffuse to the two distal animations. Although not evident in the density plots, an examination of the order in which the pecks were produced by Pigeon 6r showed clear tracking of the objects as they moved. The similarity in the density plots for the reinforced direct launching animation and the delayed animation was reflected in the peck rates for Pigeon 6r (see Figure 3).
Fig 7. Density plots for peck location for Pigeon 6r.
The x- and y-axes indicate the x- and y-coordinates on the display. See the text for additional details.
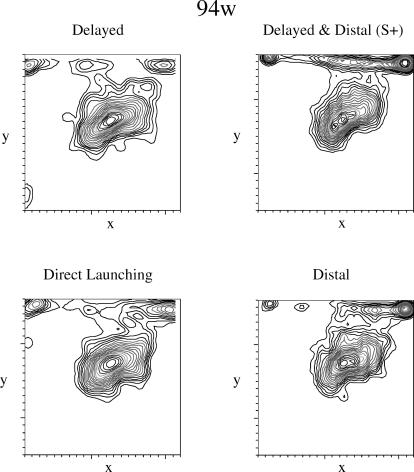
Pigeon 94w's pecks predominated at the initial location of the green square and at the terminus of its movement, especially for the distal & delayed animation and, to a lesser extent, the distal animation (see Figure 8). The density plots are similar for the four animations except in the density of pecks at the terminus. The similarity in the density plots for the reinforced distal & delayed animation and the distal animation was likewise reflected in the peck rates for this pigeon (see Figure 4).
Fig 8. Density plots for peck location for Pigeon 94w.
The x- and y-axes indicate the x- and y-coordinates on the display. See the text for additional details.
Unlike the density plots of the three other pigeons, Pigeon 43r's pecks did not occur along the path of movement, but instead were heavily distributed along the left edge of the display window (see Figure 9). Previous research in our laboratory had revealed a similar pattern in pigeons trained to discriminate among static stimuli, but it was unusual for this experiment. Interestingly, this pigeon was also the poorest performer during training and never discriminated delayed from immediate launches. The densities for the distal & delayed animation and the distal animation were very similar (this similarity also was reflected in indistinguishable peck rates shown in Figure 5).
Fig 9. Density plots for peck location for Pigeon 43r.
The x- and y-axes indicate the x- and y-coordinates on the display. See the text for additional details.
In summary, the similarity in the peck location distributions among the four training animations paralleled the discriminability of the stimuli in the go/no-go task. There also appeared to be a discriminative performance advantage for the three pigeons that pecked along the path of the moving objects over the one pigeon that did not.
Discussion
One pigeon (182w) evidenced robust discrimination between causal and noncausal animations as a function of the delay and the spatial distance between the squares at the time of the launch. One pigeon (6r) discriminated delayed from immediate launches, but the gap versus no-gap discrimination was mediated by the starting position of the launching object, not the presence or absence of the gap. One pigeon (94w) discriminated distal from direct launches, but the delay versus no-delay discrimination was mediated by the overall passage of time of the animation. Finally, one pigeon (43r) discriminated distal from direct launches but not delay. Three of the pigeons' pecking predominated along the diagonal on which the squares moved, whereas the fourth pigeon (43r) pecked predominately along the left edge of the display; interestingly, this last pigeon also failed to master the discrimination in the training phase.
The pigeons had considerable difficulty learning to discriminate animations that appear quite distinct to the adult human eye. During the testing phase, the pigeons often attended to features of the animations that typically are deemed irrelevant by adult human observers, namely, the initial location of the launching object and the duration of movement (cf. Goto & Lea, 2003, “pigeons often make use of cues other than those the experimenter had intended”, p. 41). Although these features of the testing stimuli were confounded with the original gap and delay manipulations, the considerable length of time (more than 6 months) required to learn the discrimination in the training phase suggests that these features did not overshadow the causal features of spatial and temporal contiguity; the pigeons found these animations difficult to distinguish on the basis of any and all features. In an unpublished study, Lea (1998, July) also tried to train pigeons to discriminate causal from noncausal interactions with little success. He began by trying to produce a more generalized discrimination by varying features like the direction of motion and the color of the squares across trials. When the procedures failed to show any stimulus control, more specific training produced better initial discrimination but weak generalization and thus confirms the general results reported here.
The failure of Pigeon 43r to learn the discrimination, coupled with its unique density plot, suggests that certain pecking patterns may have differential efficacy in learning the discrimination in the first place. This observation suggests that it might be useful to train a pigeon to track moving objects before requiring it to discriminate causality in the movements of multiple objects. More effective tracking of the objects might allow the pigeon's own behavior to acquire discriminative control. For example, tracking objects in a distal launch procedure would require a significant jump in peck locations in order to achieve effective tracking. Tracking objects in a delayed launch procedure would necessitate either a pause in pecking or continued pecking at the stationary object until the delay ended.
The variation among subjects in the control exerted by the spatial gap and temporal delay is not unique to pigeons. In a recent study by Young, Rogers, and Beckmann (2005), humans showed equally diverse attention to temporal and spatial contiguity when they were asked to judge the degree of causation in launching effect interactions. Of the 42 participants, 11 produced high ratings for direct causation only, 4 did so only when the objects touched (that is, temporal delay was ignored), 17 produced ratings that were strongly influenced by the length of the temporal delay (spatial gap had a much weaker influence), and 10 produced ratings that were strongly influenced by the size of the spatial gap (temporal delay had a much weaker influence). Thus, when asked to judge causality in a launching interaction, people exhibited little consensus in the factors to which causality was attributed. It is not yet known whether people would show similar disparities in a discrimination task like that faced by the pigeons.
These results raise both theoretical and methodological issues. Do pigeons discriminate causal from noncausal interactions in the wild? Our results suggest not, but this tentative conclusion must be qualified. First, we required the pigeons to learn discriminations between the interactions of objects. It is possible that pigeons would more readily discriminate causal from noncausal interactions involving distal and delayed consequences of their own actions (Cook & Katz, 1999; Killeen, 1981) rather than those of inanimate objects. Second, we manipulated spatial distance and temporal delay. The pigeon may be more attuned to contingency rather than contiguity as a cue for causation. Third, the interaction was patently artificial, involving green and red squares moving on a computer monitor. Responding might be different if the movement of the objects was smoother (higher frame rate for the animation), if the objects themselves were already familiar, if the interaction was one that occurred in the wild, or if the interaction involved real 3D objects rather than 2D objects presented on a computer monitor (cf. Cabe, 1976). Although prior research suggests that pigeons might discriminate dynamic objects that appear on a computer monitor as 3D (Cook & Katz, 1999), our results clearly demonstrate that pigeons and humans show substantial behavioral differences under these conditions. If the pigeon is able to discriminate causal from noncausal interactions, then this ability may be more constrained than it is for humans, who perceive causality in launching interactions involving 2D colored squares and circles, computer-rendered balls with shading cues, and real-world objects.
The present results also have implications for the published studies on human infants' perception of causality. It is possible that infants might discriminate among launching events by using stimulus features like those that controlled our pigeons' behavior: the overall duration of the interaction, the rate of object motion, or the initial or ending positions of the interacting objects (also see Oakes & Cohen, 1990). Discrimination tests similar to those in the present study typically are not included in studies of infants' perception of causality. For this reason, it is easy to assume that infants are functioning like little adults and that pigeons are not. But, it is quite possible that the developing child is still learning which features have utility and which do not in discriminating causal interactions; infants thus could be attending to a variety of irrelevant but diagnostic cues like those attended to by our pigeons (e.g., Ausubel & Schiff, 1954; Siegler, 1975).
Indeed, it still is not clear precisely which stimulus features actually control adult humans' judgments of causality. Although contingency, temporal priority, temporal and spatial contiguity, and prior experience all affect causal learning and judgment (for a review see Young, 1995), disagreements persist as to whether these results are the byproduct of associative learning mechanisms (Allan, 1993; Shanks & Dickinson, 1987; Wasserman, 1990), higher cognitive mechanisms like Bayes nets (e.g., Glymour, 2001; Gopnik et al., 2004; Pearl, 2000), or stimulus features that are highly correlated with causality (e.g., predictability, Young et al., 2005). Indeed, predictability and causality are so highly correlated in the natural environment that these two dimensions may be more integral than separable in the same sense that color hue and saturation are visually integrated (Garner & Felfoldy, 1970; Shepard, 1991).
It is unlikely that pigeons and infants are engaging in higher cognitive reasoning; after all, human adults, too, may fail to do so in everyday situations. The environment affords myriad cues that different species could exploit to various degrees in order to discern the all-important causal relations of the niche that each species inhabits. Each species' use of these cues is at least partially dictated by the structure of its environment, its sensory apparatus, and its neural cognitive mechanisms. There is obviously much to learn about the perception and judgment of causality as a function of ontogenetics and phylogenetics; observations like those reported here will continue to change the way that we judge our own insight into causality.
Acknowledgments
We thank Jessie Peissig for her assistance in conducting the experiments.
References
- Allan L.G. Human contingency judgments: Rule based or associative? Psychological Bulletin. 1993;114:435–448. doi: 10.1037/0033-2909.114.3.435. [DOI] [PubMed] [Google Scholar]
- Ausubel D.P, Schiff H.M. The effect of incidental and experimentally induced experience in the learning of relevant and irrelevant causal relationships by children. Journal of Genetic Psychology. 1954;84:109–123. doi: 10.1080/08856559.1954.10533670. [DOI] [PubMed] [Google Scholar]
- Bargh J.A, Ferguson M.J. Beyond behaviorism: On the automaticity of higher mental processes. Psychological Bulletin. 2000;126:925–945. doi: 10.1037/0033-2909.126.6.925. [DOI] [PubMed] [Google Scholar]
- Cabe P.A. Transfer of discrimination from solid objects to pictures by pigeons: A test of theoretical models of pictorial perception. Perception and Psychophysics. 1976;19:545–550. [Google Scholar]
- Cook R.G, Katz J.S. Dynamic object perception by pigeons. Journal of Experimental Psychology: Animal Behavior Processes. 1999;25:194–210. doi: 10.1037//0097-7403.25.2.194. [DOI] [PubMed] [Google Scholar]
- Dittrich W.H, Lea S.E.G, Barrett J, Gurr P.R. Categorization of natural movements by pigeons: Visual concept discrimination and biological motion. Journal of the Experimental Analysis of Behavior. 1998;70:281–299. doi: 10.1901/jeab.1998.70-281. [DOI] [PMC free article] [PubMed] [Google Scholar]
- Garner W.R, Felfoldy G.L. Integrality of stimulus dimensions in various types of information processing. Cognitive Psychology. 1970;1:225–229. [Google Scholar]
- Gigerenzer G, Goldstein D.G. Reasoning the fast and frugal way: Models of bounded rationality. Psychological Review. 1996;103:650–669. doi: 10.1037/0033-295x.103.4.650. [DOI] [PubMed] [Google Scholar]
- Glymour C. The mind's arrows. Cambridge, MA: MIT Press; 2001. [Google Scholar]
- Gopnik A, Glymour C, Sobel D.M, Schulz L.E, Kushnir T, Danks D. A theory of causal learning in children: Causal maps and Bayes nets. Psychological Review. 2004;111:3–32. doi: 10.1037/0033-295X.111.1.3. [DOI] [PubMed] [Google Scholar]
- Goto K, Lea S.E.G. Discrimination of direction of movements in pigeons following previous experience of motion/static discrimination. Journal of the Experimental Analysis of Behavior. 2003;80:29–42. doi: 10.1901/jeab.2003.80-29. [DOI] [PMC free article] [PubMed] [Google Scholar]
- Greenwald A.G. New Look 3: Reclaiming unconscious cognition. American Psychologist. 1992;47:766–779. doi: 10.1037/0003-066x.47.6.766. [DOI] [PubMed] [Google Scholar]
- Killeen P.R. Learning as causal inference. In: Commons M.L, Nevin J.L, editors. Quantitative analyses of behavior: Vol. 1. Discriminative properties of reinforcement schedules. Cambridge, MA: Ballinger; 1981. pp. 89–112. In. eds. [Google Scholar]
- Lea S.E. Pigeons and the Michotte launch effect: Discrimination, but not of causality. York, UK: Paper presented at the Experimental Psychology Society; 1998. Jul, [Google Scholar]
- Leslie A.M, Keeble S. Do six-month old infants perceive causality? Cognition. 1987;25:265–288. doi: 10.1016/s0010-0277(87)80006-9. [DOI] [PubMed] [Google Scholar]
- Lewicki P, Hill T, Czyzewska M. Hidden covariation detection: A fundamental and ubiquitous phenomenon. Journal of Experimental Psychology: Learning, Memory, and Cognition. 1997;23:221–228. doi: 10.1037//0278-7393.23.1.221. [DOI] [PubMed] [Google Scholar]
- Michotte A. The perception of causality (T. R. Miles & E. Miles, Trans.) London: Methuen; 19461963. [Google Scholar]
- Nisbett R.E, Wilson T.D. Telling more than we can know: Verbal reports on mental processes. Psychological Review. 1977;84:231–259. [Google Scholar]
- Oakes L.M, Cohen L.B. Infant perception of a causal event. Cognitive Development. 1990;5:193–207. [Google Scholar]
- Pearl J. Causality: Models, reasoning, and inference. Cambridge, MA: Cambridge University Press; 2000. [Google Scholar]
- Ploger D, Wilson M. Statistical reasoning: What is the role of inferential rule training? Comment on Fong and Nisbett. Journal of Experimental Psychology: General. 1991;120:213–214. doi: 10.1037//0096-3445.120.1.34. [DOI] [PubMed] [Google Scholar]
- Shanks D.R, Dickinson A. Associative accounts of causality judgment. In: Bower G.H, editor. The psychology of learning and motivation (Vol. 21, pp. 229–261) San Diego, CA: Academic Press; 1987. In. ed. [Google Scholar]
- Shepard R.N. Integrality versus separability of stimulus dimensions: From an early convergence of evidence to a proposed theoretical basis. In: Lockhead G.R, Pomerantz J.R, editors. The perception of structure: Essays in honor of Wendell R. Garner. Washington, DC: American Psychological Association; 1991. pp. 53–71. In. eds. [Google Scholar]
- Siegel R.K. Apparent movement detection in the pigeon. Journal of the Experimental Analysis of Behavior. 1970;14:93–97. doi: 10.1901/jeab.1970.14-93. [DOI] [PMC free article] [PubMed] [Google Scholar]
- Siegler R.S. Defining the locus of developmental differences in children's causal reasoning. Journal of Experimental Child Psychology. 1975;20:512–525. [Google Scholar]
- Sloman S.A. The empirical case for two systems of reasoning. Psychological Bulletin. 1996;119:3–22. [Google Scholar]
- Wasserman E.A. Detecting response-outcome relations: Toward an understanding of the causal structure of the environment. In: Bower G.H, editor. The psychology of learning and motivation (Vol. 26, pp. 27–82) San Diego, CA: Academic Press; 1990. In. ed. [Google Scholar]
- Wegner D.M. The illusion of conscious will. Cambridge, MA: MIT Press; 2002. [Google Scholar]
- Young M.E. On the origin of personal causal knowledge. Psychonomic Bulletin and Review. 1995;2:83–104. doi: 10.3758/BF03214413. [DOI] [PubMed] [Google Scholar]
- Young M.E, Rogers E.T, Beckmann J.S. Causal impressions: Predicting when, not just whether. Memory and Cognition. 2005;33:320–331. doi: 10.3758/bf03195320. [DOI] [PubMed] [Google Scholar]


