
Figure 1.
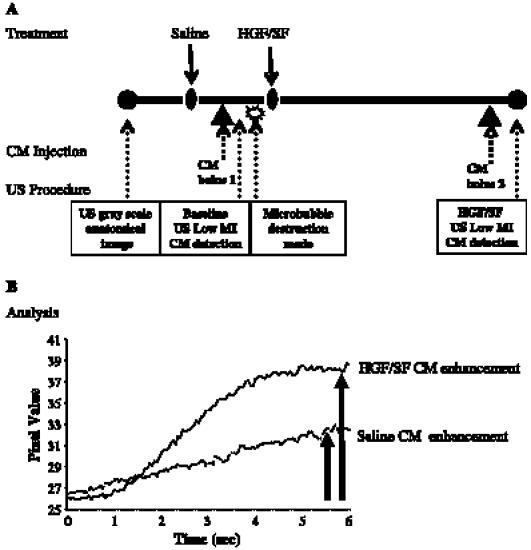
High-temporal-resolution FMI of Met: experimental layout and image analysis. (A) Experimental layout: to localize tumor boundaries and basal blood flow, color Doppler ultrasound was performed. Baseline CM enhancement: mice were injected intravenously with 150 µl of saline and, later, with 150 µl of CM (15 µg/mouse; 5 minutes after the injection of saline), followed by a microbubble destruction mode that was necessary for additional CM imaging. HGF/SF CM enhancement: CM imaging was performed by intravenous injection of 150 µl of HGF/SF (1024 U/mouse purified human HGF/SF) [38] and, 20 minutes later, with 150 µl of CM (15 µg/mouse). (B) Image analysis: the effect of HGF/SF on tumor contrast enhancement was calculated by analyzing the average maximal SI (percentage) on the pixels of the designated ROI before HGF/SF treatment (baseline) and after HGF/SF treatment.