Abstract
The purpose of this manuscript is to discuss fluorogenic real-time quantitative polymerase chain reaction (qPCR) inhibition and to introduce/define a novel Microsoft Excel-based file system which provides a way to detect and avoid inhibition, and enables investigators to consistently design dynamically-sound, truly LOG-linear qPCR reactions very quickly. The qPCR problems this invention solves are universal to all qPCR reactions, and it performs all necessary qPCR set-up calculations in about 52 seconds (using a pentium 4 processor) for up to seven qPCR targets and seventy-two samples at a time – calculations that commonly take capable investigators days to finish. We have named this custom Excel-based file system "FocusField2-6GallupqPCRSet-upTool-001" (FF2-6-001 qPCR set-up tool), and are in the process of transforming it into professional qPCR set-up software to be made available in 2007. The current prototype is already fully functional.
Keywords: Reverse Transcription; DNA, Complementary
Preface
Bearing in mind that it is not possible to state with absolute certainty the exact causes of qPCR inhibitory phenomena, and since more than one kind of inhibition may be present at the same time, we begin this communication by creating a list of the top five most likely sources of such inhibition – two of which (inhibition Types 2 and 3) are inherently a function of one another. We propose that all five affect either the activity of reverse transcriptase enzymes, Taq DNA polymerases, or both. In order to avoid using sample RNA (or cDNA) at dilutions permissive of or conducive to real-time qPCR inhibitory phenomena (regardless of the type of inhibition), we have created the FF2-6-001 qPCR set-up tool which is used to analyze preliminary qPCR Test Plate data generated by up to seven qPCR targets from serial progressive dilutions of representative (Stock I) RNA or cDNA mixtures all used in fluorogenic hydrolysis probe-based qPCR. Once Test Plate threshold cycle (CT) values are obtained for each target on any given Test Plate, they are entered into the TestPlateResultsAnalysis2006.xls portions of the FF2-6-001 qPCR set-up tool which the user interacts with in order to quickly and precisely identify the useful RNA dilution ranges for each qPCR target – within these ranges which each target can be expected to amplify without inhibition, with LOG-linearity and with high efficiency. The FF2-6-001 qPCR set-up tool then applies these ranges to final qPCR reaction designs allowing the investigator to formulate high-fidelity qPCR reactions every time since the FF2-6-001 file system ensures that each real-time qPCR reaction is carried out under the most dynamically sound conditions possible for each different genomic or transcriptomic target of interest. As a result, investigators are able to consistently attain credible real-time qPCR target and housekeeper CT values. The FF2-6-001 qPCR set-up tool is also universally adaptable to any master mix and qPCR reagent-use selection (e.g. SYBR Green, one-step and two-step, beacon, scorpion and hydrolysis probe methods) for both relative and absolute quantitative qPCR approaches. Since real-time qPCR is lauded by many as the most powerful tool in all of molecular biology for quantitative analysis of gene expression, and since it is still considered the tool of choice for validating micro-array data, any new ideas, methods or approaches that improve its precision in common practice represent important constructive advances furthering the responsible evolution of an already broadly-accepted scientific technique.
Introduction
A variety of problematic inhibitory phenomena have been reported that plague qPCR assays (1). Inhibition of the enzymatic reactions involved in generating real-time qPCR signals from specific cDNA templates using specific primers, fluorogenic probes, or combinations of primers and fluorogenic probes can severely impact the precision of absolute and relative gene expression quantitative analysis. Any factor, experimental, user-introduced, environmental or otherwise, that has an impact on the activity of RT (reverse transcriptase) enzyme and/or Taq polymerase used in any one-step real-time qPCR reaction will invariably affect the results generated. In worst-case scenarios, these deficiencies go unnoticed and remain unaddressed. Recently, others have suggested that many as-yet unidentified sample-specific substances (or impurities) are often carried over as a result of different RNA isolation methods (preceding real-time qPCR of any variety) which cause RT enzyme or Taq DNA polymerase-based qPCR inhibition (1, 2). Exogenous contaminants such as glove powder and phenolic compounds from the extraction process and plastic-ware (pipette tips, tubes and plates) can also have an inhibiting effect. With regard to tissue-specific inhibition of DNA amplification, tissue type was found to be the largest source of variance of inhibitory phenomena while primer sequences appeared to have the least affect. In other words, tissue type from which total RNA was extracted had the most significant effect on PCR kinetics, thus on final threshold cycle (CT) values (1, 4). This is thought to be caused by different kinds and amounts of cellular debris present in samples after RNA extraction (2, 3). Endogenous contaminants such as blood or fat are thought to play an important role in affecting both the PCR as well as the preceding reverse transcription reaction. Other inhibitory contaminants are thought to be hemoglobin, heme, porphyrin, heparin (from peritoneal mast cells), glycogen, polysaccharides and proteins, cell constituents, Ca2+, DNA or RNA concentration, and DNA (and possibly RNA) binding proteins (5-12). MicroRNA (miRNA) is not thought to be a contributing factor to qPCR inhibition since high thermocylcing temperatures (94-95°C) most likely prevent the formation of stable RNA-binding complexes which might otherwise associate with template RNA (Ambion technical support information).
Types of qPCR inhibition
Because of the severe impact inhibition can have on results, we feel it is important to address it and attempt to identify the possible form(s) that may be present or active throughout real-time pPCR procedures (37). Toward this end, based on experimental observations of the dynamics of numerous real-time qPCR reactions, we have organized qPCR inhibitory phenomena into five semi-distinct categories; Types 1 through 5 (Figs. 1-6). We describe them as: inhibition of reverse transcriptase (RT) enzyme(s) and/or Taq DNA polymerase(s) by excessive rRNA and possibly tRNA in concentrated RNA samples (sample concentration-related template inhibition; Type 1 inhibition); inhibition from method of RNA isolation due to the carryover of inhibitory biological components or molecules (RNA isolation method-related inhibition; Type 2 inhibition); inhibition arising from the type of tissue or cell that sample RNA has been isolated from (sample-specific inhibition; Type 3 inhibition); inhibition arising as a result of the interaction of a specific qPCR target template with sub-optimal concentrations, designs or any other thermodynamic factors concerning its specific probe and/or primer(s) (target-specific kinetic inhibition; Type 4 inhibition); and inhibition caused by compounds such as EDTA, GIT, TRIS, glycogen (sometimes used as a carrier agent during RNA isolation; inhibition of RT enzyme has been observed when glycogen is present in excess of 4 mg/ml during reverse transcription), (13, 14), or other user-introduced reagents (chemical inhibition; Type 5 inhibition). Although the reality of Type 6 inhibition (connoting all other as-yet unknown causes of qPCR inhibition) looms large, for the purposes of this paper, only proposed inhibition Types 1 through 5 are addressed.
Fig. 1. qPCR amplification of 18S ribosomal RNA using Trizol®-isolated RNA from H441 cells (with 1.8-2.0 RNA purity ratios observed) appear to demonstrate inhibition Types 1, 2 and 3 with the 1:38.46 dilution and inhibition Types 1 (and presumably 4) with the 1:200 and 1:400 dilutions shown here.
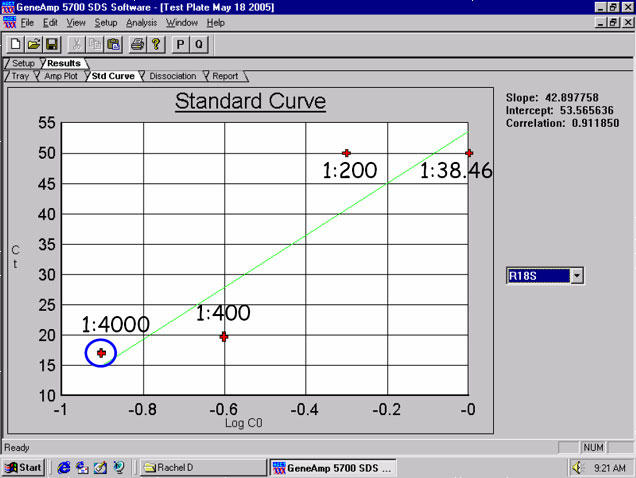
Trizol® was used for RNA isolation from H441 cells (1.8-2.0 RNA purity ratios observed). Whole lung tissue total RNA isolates show the same sample-related inhibition threshold for 18S ribosomal RNA to be ~ 1:4,000 as well – and this is seen commonly with the hyper-abundantly expressed target, ribosomal 18S RNA when sample RNA has been isolated using Trizol®.
Fig. 6. Typical results obtained using FF2-6-001 qPCR set-up tool which first calculated the Test Plate set-up, then processed the Test Plate data for Gallinacin 1 (G1), Gallinacin 2 (G2), and Gallus gallus ribosomal 18S RNA (used as the housekeeping gene) and, in turn, the FF2-6-001 qPCR set-up tool additionally used that information to calculate the optimal dynamic set-up for each target on each of the final qPCR experimental plates (including sample RNA dilutions for each target, inter-plate calibrator dilutions of Stock I for each target, dilutions of Stock I to create all the standards for each target, and all master mix calculations for all Sample Plates and an NRC Plate).
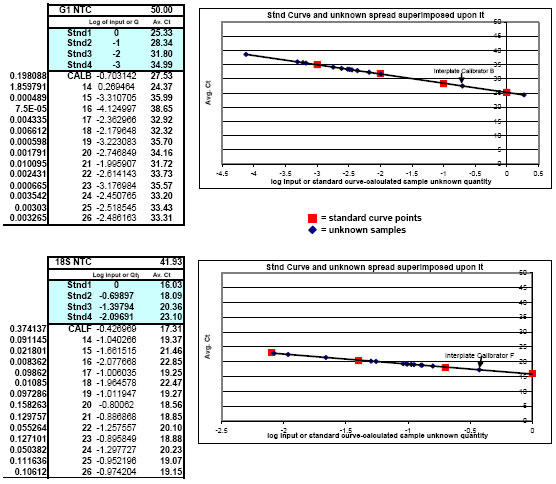
Notice how all unknowns fell within the trustworthy portion of the standard curves for G1 and its corresponding ribosomal 18S RNA housekeeper. The same was found for G2 and its corresponding ribosomal 18S RNA housekeeper (graphs not shown). NRC results from this study showed that all contaminating (genomic DNA) target signals were greater than 14 cycles away from the genuine housekeeper CT values – presenting no consequence whatsoever during data analysis. The fact that 14 different tissue types were used in this study speaks well for the ability of the FF2-6-001 qPCR set-up tool to be able to work with and solve for a variety of potentially variant qPCR-inhibitory features from a myriad of tissue types. 26 total normal tissues were evaluated here; 13 from a male chicken and 13 from a female chicken: bone marrow, jejunum, crop, testes (male chicken) oviduct (female chicken), lung, skin, spleen, liver, kidney, bursa, trachea, conjunctiva and tongue. After identifying the optimal RNA dilution ranges for each target, fluorogenic real-time one-step qPCR was successfully carried out under absolutely LOG-linear conditions exhibiting virtually 100% efficiency for each target in the total absence of inhibition of any variety using saturating concentrations of primers (1 ?M) and probes (150 nM) for all three targets (Brockus-Harmon-Gallup-Ackermann, 2005 unpublished).
Type 1 inhibition of reverse transcriptase (and possibly Taq DNA Polymerase) due to rRNA and tRNA is yet poorly understood, but it has been acknowledged and referred to in product literature as being of serious concern (15). Understandably, inhibition Types 2 and 3 will invariably be a function of one another since method of RNA isolation and tissue or cell type from which RNA is isolated will always affect one another distinctly, while all types of qPCR inhibition are diminished (and eventually eliminated) by sheer dilution of the RNA samples. Indeed, diluting RNA out too far can obviously result in the generation of weak or absent qPCR signals from lower abundance mRNAs in any transcriptome. Inhibition types 4 and 5 are more generally understood as they have been familiar concerns in the conventional PCR world since its inception in 1983. Since the qPCR studies used as examples in this paper involve the sole use of the TaqMan® (hydrolysis) probe method (which includes the use of sequence-specific forward and reverse primers), we discuss here only observations gathered by this approach using total tissue or cellular RNA in single-plex fluorogenic one-step real-time qPCR (Fig. 7). All reactions were run in an Applied Biosystems Incorporated (ABI) GeneAmp 5700® Sequence Detection System unless otherwise stated (in one case, a Stratagene Mx3005P real-time qPCR machine was employed – using ABI TaqMan® One-Step RT-PCR Master Mix Reagents Kit). Any experimental results shown in this paper are meant to illustrate the unique prowess of the FF2-6-001 qPCR set-up tool and to aid in discussing the concepts of qPCR inhibition and optimal qPCR target dynamic range; they are not intended to represent a complete scientific study per se.
Fig. 7.
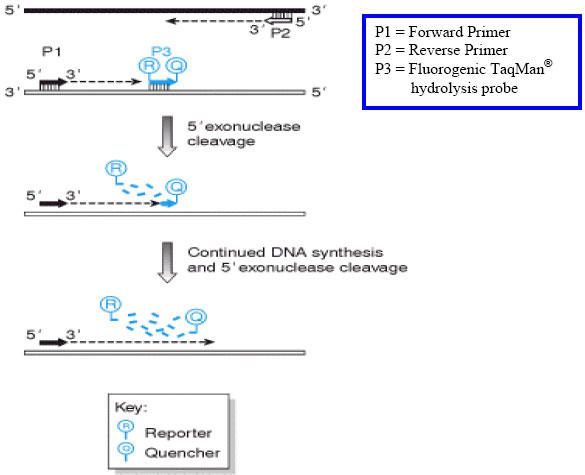
The TaqMan® 5’ exonuclease assay. In addition to two conventional PCR primers, P1 and P2, which are specific for the target sequence, a third primer, P3 (called the ‘probe’), is designed to bind specifically to a site on the target sequence downstream of the forward primer binding site. The probe is labelled with two fluorophores, a reporter dye (R) is attached at the 5’ end while a quencher dye (D), which has a different emission wavelength to the reporter dye, is attached at its 3’ end. Because the 3’ end is blocked, the probe cannot by itself prime any new DNA synthesis. During the PCR reaction, Taq DNA polymerase synthesizes a new DNA strand primed by the forward primer, and as the enzyme approaches the probe, its 5’ to 3’ exonuclease activity progressively degrades the probe from its 5’ end. The end result is that the nascent DNA strand extends beyond the probe binding site and the reporter and quencher dyes are no longer bound to the same molecule. As the reporter dye is no longer in close proximity to the quencher, the resulting increase in reporter emission intensity becomes easily detectable. This all occurs in “real time” as monitored by the photomultiplier tube(s) in the instrument.
Inhibition encountered in experimental assays
By examining the results from numerous one-step real-time qPCR studies using total RNA isolated from mammalian tissue or mammalian cell cultures either by Trizol® (14), or a column purification method (Rapid Total RNA Purification System, Cat. No. 11502-050, Marligen), we found that a direct relationship existed between the severity of qPCR inhibition and the method used to isolate sample total RNA. This was a clear example to us that qPCR inhibition Types 2 and 3 were interrelated. Most Trizol®-isolated total RNA, when used in one-step real-time qPCR, showed inhibition until a final post-DNase, in-well (See Appendix 1) RNA dilution of ~1:150. At 1:200 final (post-DNase, in-well) RNA dilutions and beyond, most targets (i.e. SBD-1, ovTTF-1, ovSP-A, ovSP-D, ovICAM-1, SMAP29, bRSV and ovRPS15; see Appendix 14) showed lack of inhibition and began to behave as classic real-time qPCR templates. The only exception to this was hRIBO18S RNA, which did not exhibit normal real-time qPCR template behavior until a dilution of ~1:4,000 and higher (Fig. 2). Significantly less qPCR inhibition was observed with RNA samples that were isolated using the Marligen column-based method (Clark-Sponseller equine studies, 2005-2006 unpublished). Inhibition for all samples disappeared at final (post-DNase, in-well) RNA dilutions of 1:50 and higher for equine targets IL-10, IL-12p35, IL-12p40 and GA3PDH (Figs. 3, 4 and Appendix 14). Equine RIBO18S RNA was not studied, so the effect of Marligen column isolation on this target is unknown. Final, in-well RNA concentrations were never greater than 0.5 ng/?l in any of these qPCR studies (~0.3 ng/?l seemed to work the best), so inhibition of RT enzyme and/or Taq DNA polymerase by excess RNA in the reaction wells (Type 1 inhibition) was reasonably eliminated as a source of any of the inhibition phenomena witnessed (since by the time most samples reached this final in-well concentration, they had already incurred dilutions of 1:3,000 or greater – certainly outside the range where most forms of inhibition would be reasonably expected, with the possible exception of inhibition Type 4) (See Appendix 2).
Fig. 2. Housekeeper hRPS15 amplifications using Trizol®-isolated RNA from H441 cells (with 1.8-2.0 RNA purity ratios observed) appear to demonstrate inhibition Types 1, 2 and 3 with the 1:38.46 dilution shown here.
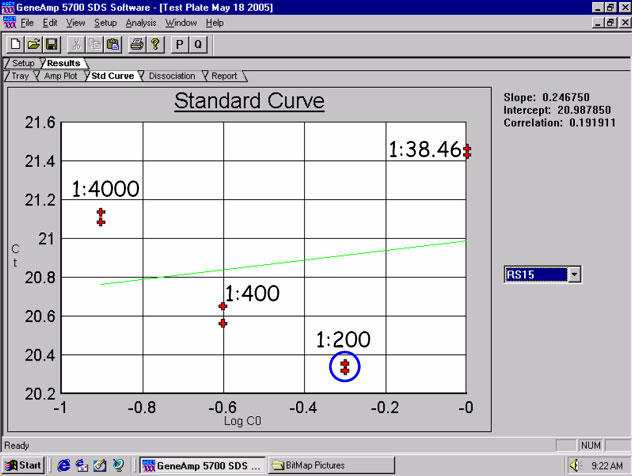
Whole lung tissue total RNA isolates show the same sample-related inhibition threshold to be ~1:200 as well – and this is seen with most intermediately-abundant targets when sample RNA has been isolated using Trizol®. Human ribosomal protein S15 (hRPS15) primers and probe were used here at 1 ?M and 150 nM, respectively.
Fig. 3. (Marligen) column-isolated/purified RNA exhibits a lower threshold of qPCR inhibition.
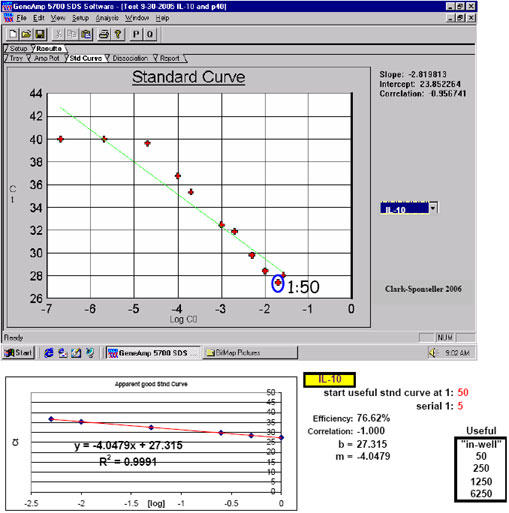
Inhibition Types 1, 2 and 3 are presumably demonstrated with the first dilution point shown here. Marligen Rapid Total RNA Purification System RNA isolation from equine dendritic cells: inhibitory phenomena are not apparent beyond a dilution of 1:50 using RNA isolated by this method. Rare qPCR targets often exhibit lower amplification efficiencies.
Fig. 4. (Marligen) column-isolated/purified RNA exhibits a lower threshold of qPCR inhibition.
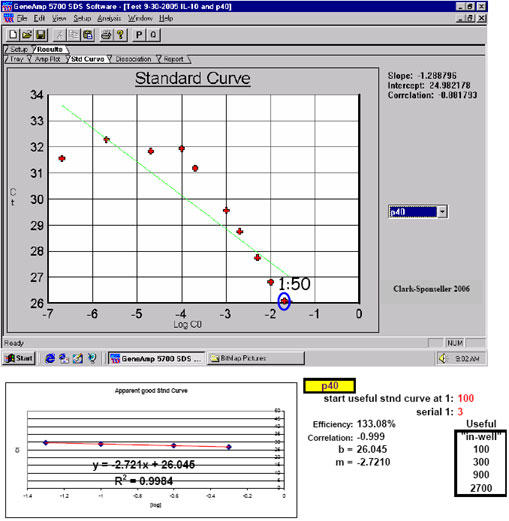
Inhibition Types 1, 2 and 3 are presumably demonstrated with the first dilution point again shown here. Marligen Rapid Total RNA Purification System RNA isolation from equine dendritic cells: inhibition is slightly apparent beyond a dilution of 1:50 using RNA isolated by this method; an amplification efficiency of 133.08% here indicates possibly lingering inhibition of the first point(s) of the apparent optimal standard curve RNA sample dilution region for equine IL-12p40. However, since singlet samples were run here, this observation is useful as a warning only to a certain extent; successful, uninhibited qPCR was carried out for this target using the RNA dilution range selected here.
We further make the assumption that our one-step qPCR reactions are safely outside the realm where Type 1 inhibition might be expected. This is based on product literature and guidelines from ABI and others that 10 picograms to 100,000 picograms of total RNA per each 50 ?l one-step real-time qPCR reaction is generally considered to be the normal range within which one-step qPCR amplifications can be expected to exhibit favorable LOG-linear kinetics (2, 28, 29, 31, 39). Routinely, we design our final 25 ?l qPCR reactions to contain no less than 0.005 pg of total RNA per 25 ?l reaction (e.g. for the last point of typical standard curves for the hyper-abundant housekeeper, 18S ribosomal RNA) and no more than 12,500 pg of total RNA per 25 ?l reaction mixture (i.e. for often rarely-expressed targets such as SBD-1, IL-10, IL-8 and TNF-?). Above 12,500 pg total RNA per 25 ?l reaction, we begin to observe problematic qPCR inhibitory phenomena (with Trizol®-isolated tissue total RNA) of Type 1, Type 2, Type 3 (and presumably Type 4) varieties. Interestingly, at first, the qPCR inhibition we observed seemed to be either a byproduct of Turbo-DNase (Ambion) treatment (Type 5 inhibition), or rRNA and tRNA inhibition of the RT enzyme during reverse transcription (Type 1 inhibition). But, then it became apparent that this inhibition was more likely due to the method of total RNA isolation (our final Turbo-DNase treated RNA samples never comprised more than 26% of each final one-step real-time qPCR reaction volume; an amount that is safely within Ambion product literature guidelines regarding the proper use of Turbo DNase-treated RNA in qPCR reactions). In our studies, Trizol® RNA isolation (which we used for 15 different sheep tissues, 14 different chicken tissues, JS7 ovine lung cell and H441 human adenocarcinoma cell cultures) and Marligen column-based RNA isolation procedures (used for equine dendritic and macrophage cell cultures (Clark-Sponseller, 2005-2006, Iowa State University)) were both followed by identical Turbo-DNase treatments. But, Trizol®-isolated RNA always showed a greater degree of qPCR inhibitory characteristics than Marligen column-isolated RNA samples. Since all conditions were identical for these samples except method of RNA isolation, this indicated to us that qPCR inhibition Types 2 and Type 3 were a function of one another. Further, in our studies, the possibility that Type 4 inhibition (target-specific kinetic inhibition) is a source of RT enzyme and/or qPCR (e.g. Taq DNA polymerase) inhibition seemed to be most probable only with the hyper-abundant 18S ribosomal RNA target, whereas inhibition of RT enzyme by rRNA (and possibly tRNA) and chemical inhibition seem to mainly affect those targets which are only able to elicit ample qPCR signals when using more concentrated RNA during qPCR. In our previous work, Type 5 inhibition was clearly demonstrated with LCM RNA samples that received EDTA during DNase-treatment preceding fluorogenic one-step real-time qPCR; the ABI one-step master mix used was especially prone to even very small exogenously-introduced amounts of EDTA (which of course forms a chelate with divalent metal ions such as Mg2+ – keeping them from participating as crucial co-factors in enzymatic reactions such as reverse transcription and PCR) (16).
All 5 proposed types of inhibition present themselves during two-step qPCR as well (using cDNA synthesized separately, prior to subsequent qPCR procedures), but to a much smaller degree than is seen during one-step qPCR for the identical target. The differences here can be largely ascribed to the amount of template present and available for qPCR since cDNAs synthesized prior to qPCR are often 20 ng/?l or less and have already incurred enough dilution in most cases (since template RNA isolation) to have minimized or eliminated the chances that any of the five currently-proposed causes of qPCR inhibition would be present. Corresponding RNA samples in the same regard are often 200-1,000 ng/?l before use. Quite logically, the more concentrated one must use RNA samples during one-step qPCR in effort to find “quieter” target signals of interest, the higher the risk there is of allowing qPCR inhibitory phenomena of any variety to manifest itself. Since our studies have expanded to the use of total RNA isolated from ovine lung, nasal turbinate, trachea, rumen, abomasum, jejunum, ileum, spiral colon, rectum, liver, gall bladder, urinary bladder, kidney, uterus (adult) and placenta (fetus) tissue, and chicken bone marrow, jejunum, crop, testes, oviduct, lung, skin, spleen, liver, kidney, bursa, trachea, conjunctiva, tongue, ovine and human lung cell cultures, and equine macrophage and dendritic cell cultures (courtesy of Dr. Brett Sponseller and Sandra K. Clark), we have witnessed and have successfully dealt with numerous different qPCR inhibitory profiles (using the FF2-6-001 qPCR set-up tool). Others have acknowledged the importance of this battle as well (1, 3-12, 39). With regard to Trizol® versus Marligen column-based RNA isolation, it is clear that inhibitory artifacts of RNA isolation can be augmented or diminished according to the method of RNA isolation employed, and by the extent of dilution RNA samples undergo prior to their use in qPCR.
On account of the inability of investigators to find an RNA isolation method which will not introduce one-step real-time qPCR inhibition at some point, of some kind to some degree, we found it an absolute necessity to create a tool (FF2-6-001) that could quickly reveal the dilution ranges within which each real-time qPCR target of interest amplified without inhibition. Our approach emphasizes (as do methodologies offered of most companies that provide the world with qPCR technology) the importance of performing preliminary qPCR RNA template dilution studies for all targets every time RNA samples are isolated for the purpose of gene expression analysis. What ABI describes as a "validation" plate, we call a "Test Plate" (Figs. 18, 22 and 28).
Fig. 18. The FF2-6-001 qPCR set-up tool TestPlateDepiction.xls file – used to show the general Test Plate parameters and which is equationally linked to other key FF2-6-001 qPCR set-up tool files.
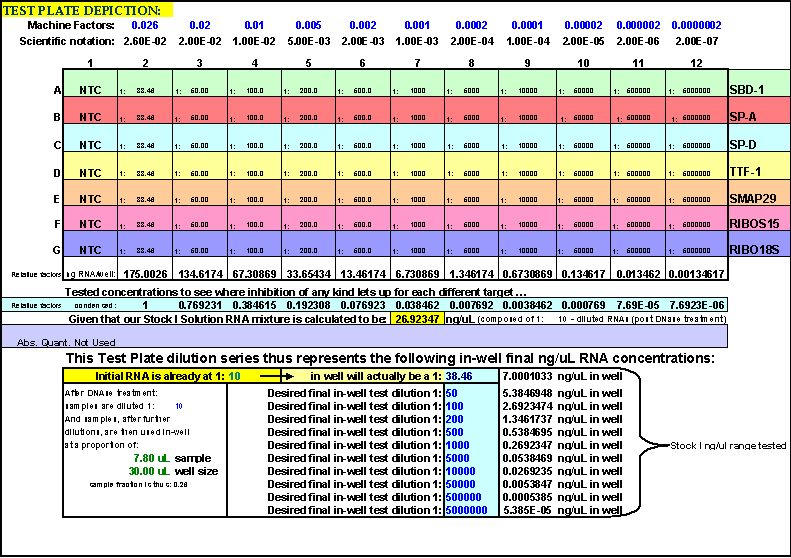
Fig. 22. FF2-6-001 qPCR set-up tool MasterEntrySheet.xls file (Sheet 2) showing the final automatically-calculated Test Plate parameters and set up for seven targets.
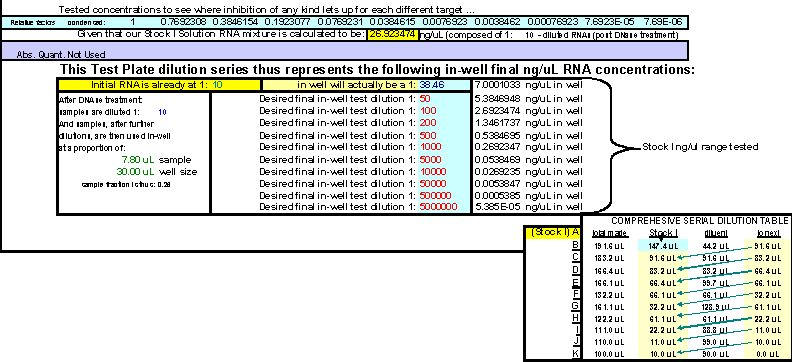
This page is printed out and used as a guide for machine programming and Stock I sample dilutions. The term "reagent" in the dilution table above connotes Stock I as the solution used in the light blue-highlighted cell.
Fig. 28. Depiction of a six-target Test Plate profile.
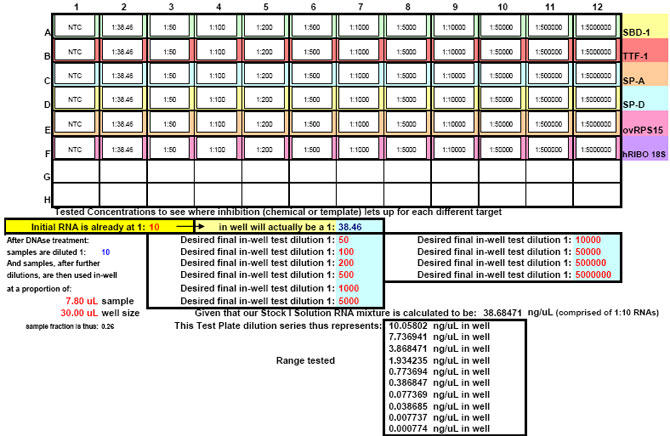
After running the plate, the CT results are fed into FF2-6-001 qPCR set-up tool TestPlateResultsAnalysis2006.xls and TestPlateResultsAnalysis2006b.xls files to identify the dilution ranges for each target which allow each target to amplify with desirable efficiency undaunted by inhibition of any kind. A slope of -3.3219 or (-1/LOG102) represents 100% efficiency when CT values are plotted against the LOG10 of template input dilution factors. In our approach, CT values are generated from a standard set of eleven serial progressive dilutions of Stock I resulting in 'dilution,' 'calibration' or 'standard' curves for each target. Analyzing Test Plate CT values allows the investigator to identify the RNA sample dilution ranges for each target within which each target remains uninfluenced by inhibitory phenomena and is allowed to achieve acceptable amplification reaction efficiency somewhere along the RNA dilution profile. Dilution curve slopes ranging from -4.11 to -3.01 (or a reaction efficiency range of 75 to 115%, respectively) are considered to be acceptable in most real-time qPCR assays. The Test Plate-attained slopes for the above six targets are shown in Figure 27.
Experimental Procedures
Fluorogenic real-time qPCR; one-step versus two-step
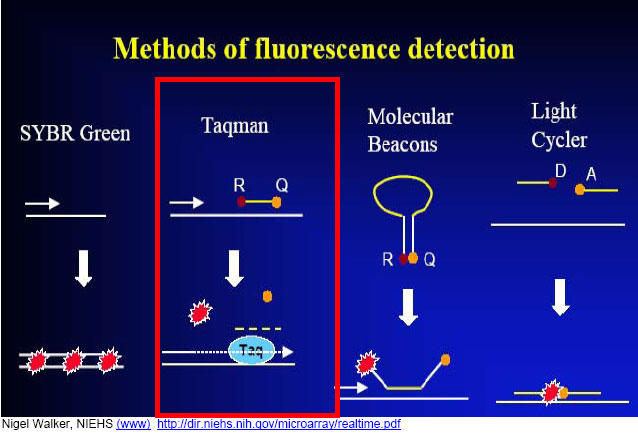
Fluorogenic one-step (for final relative quantitative target analyses) and two-step real-time qPCR (for initial target primer-probe optimizations; primers and probes designed using ABI Prism Primer Express™ version 2.0) were carried out as described previously (16-24). The fluorogenic 5' nuclease assay (TaqMan® hydrolysis probe method) is a convenient, self-contained process which uses a fluorogenic probe consisting of an oligonucleotide to which a reporter dye and a quencher dye are attached. During PCR, the probe anneals to the target of interest between the forward and reverse primer sites. During extension, the probe is cleaved by the 5' nuclease activity of the DNA polymerase. This separates the reporter dye from the quencher dye, generating an increase in the reporter dye's fluorescence intensity. Once separated from the quencher, the reporter dye emits its characteristic fluorescence (Figs. 7 and 8). The threshold cycle, or CT value, is the cycle at which a significant increase in normalized reporter fluorescence, ?Rn, is first detected (See Appendix 3); where ?Rn is calculated from Rn + and Rn -, where Rn + is the Rn value of a reaction containing all components, and Rn - is the Rn value of an un-reacted sample (the baseline value or the value detected in the no-template control, NTC). ?Rn is thus the difference between Rn + and Rn - and it is an indicator of the magnitude of the signal generated only by the fluorogenic PCR (25). For fluorogenic hydrolysis probe designs, we use 'C-probes' instead of 'G-probes' whenever possible since empirical data from ABI has shown that use of TAMRA-quenched probes containing more Cs than Gs improves the overall magnitude of fluorescent signal generated (i.e. greater overall ?Rn is observed). Primer-probe sets were also designed to span genomic introns whenever feasible; especially probe sequences. However, when deciding whether to use the sense or anti-sense probe sequence in each case, we were careful to avoid using C-probes which contained a G on the 5’ end (immediately adjacent to the reporter dye) – a feature that should be strictly avoided since Guanine is a potent inhibitor of reporter dye fluorescence. It is important to note here, however, that the "C-probe versus G-probe" rationale does not apply to minor groove-binding non-fluorescent quencher (MBGNFQ)-based probes. The ABI GeneAmp® 5700 Sequence Detection System measures the increase in the reporter dye’s fluorescence during the thermal cycling of the PCR, and this data is then used by the sequence detection software to generate CT values for each target which we finish processing and interpreting using custom Excel files. We feel strongly that being able to process one’s own CT values into final quantitative results is paramount since qPCR machines of all varieties cannot discern between erroneous (either user- or machine-introduced) signals and legitimate signals 100% of the time. Additionally, processing one’s own data (rather than allowing qPCR machine processing) not only acquaints one directly with the interesting mathematical terrain associated with qPCR, it also exposes one first-hand to some of the fascinating intricacies and nuances associated with qPCR that are often not readily apparent to the user – all things which allow one to garner additional stratagems to apply to future troubleshooting and qPCR assay optimization endeavors.
Fig. 8. Different approaches to fluorogenic qPCR; we use the highlighted TaqMan® hydrolysis probe-based real-time qPCR method.
All primers and probes are optimized and validated according to ABI procedural guidelines (31) using all-target-inclusive (Stock I) cDNA prepared from Turbo DNase-treated total RNA isolated (using Trizol®) from whole tissue homogenates as described previously (17-20). Our optimization approach is a very common/well-known procedure whereby one first studies different combinations of primer concentrations in the range of 50 nM-900 nM while keeping the probe at a constant 200 or 225 nM, after which the probe is studied by challenging it from 25 nM to 225 nM while primers are used at their optimal concentrations. All samples are performed in triplicate or quadruplicate during these evaluations to bolster significance of final evaluations. After optimization, a 'validation plate' or Test Plate is performed on up to eleven serial dilutions of the same cDNA or RNA (starting with full-strength cDNA or RNA which is assigned a relative dilution strength value of "1") using the optimal primer and probe concentrations established during optimization for each target. The highest Rn (normalized reporter fluorescence) value achieved using the lowest primer concentrations is the indicator by which one selects the appropriate optimal primer concentrations in each case; the higher the Rn, the higher the magnitude of real-time fluorescent signal. Once the Rn value no longer increases with increasing primer concentrations, one has effectively attained the useful optimal primer concentrations. CT values (not Rn values) are evaluated during probe optimizations, and the lowest CT (threshold cycle) value with the lowest probe concentration is the criteria by which one chooses optimal probe concentrations. Once CT values no longer decrease with increasing probe concentration, one has effectively attained the useful optimal probe concentration. Little known is the fact that most real-time target signals can be found with greater than 75% amplification efficiency simply using 'saturating concentrations' of primers (1 ?M) and probes (150 nM) in most experimental situations if optimal RNA dilution ranges are established for each target and inhibition is entirely avoided (unpublished multiple observations from our lab, 2001-2006).
One-step real-time qPCR
Fluorogenic one-step real-time qPCR differs from fluorogenic two-step real-time qPCR in three major regards: 1.) in a one-step approach, RNA is added directly as the nucleic acid template in qPCR reactions instead of cDNA, 2.) reverse primer concentrations have to be increased for use in one-step analyses due to first-strand synthesis requirements and, 3.) a different master mix is employed for one-step as opposed to two-step qPCR. One-step reactions typically contain both reverse transcriptase and Taq DNA polymerase enzymes and are subjected to thermocycler programs which address both enzymes in turn. For one-step real-time qPCR, we use ABI Cat. No. 4309169, TaqMan® One-Step RT-PCR Master Mix Reagents Kit. In this kit, 250 ?l of Multiscribe™ (MuLV) RT enzyme (10 U/?l) arrives already pre-mixed with RNase inhibitor (40 U/?l) as a 40X solution. The one-step RT-PCR master mix in the kit (containing AmpliTaq Gold® hot-start DNA Polymerase, undisclosed amounts of MgCl2, A, C and G dNTPs and dUTP, 300 nM ROX passive internal reference molecule, other ABI-proprietary buffer components, but no AmpErase® UNG enzyme) arrives as a separate 2X solution (5 ml total). Each of our final 25 ?l one-step real-time qPCR reactions contains: 12.5 ?l one-step master mix, 0.25 U/?l Multiscribe™ RT enzyme, 0.4 U/?l RNase inhibitor, optimal forward primer and fluorogenic probe concentrations (as previously established for each target by two-step real-time qPCR according to classic ABI protocol, (25)), reverse primer concentrations adjusted for one-step use (See Appendix 4), nuclease-free water, and 6.5 ?l of each RNA sample/template. Before use, all solutions are gently vortexed and spun down, then allowed to undergo fluorogenic one-step qPCR reactions using the following thermocycler conditions: 35 minutes at 48°C (for reverse transcription; normally 30 minutes; ABI), 10 minutes at 95°C (for AmpliTaq Gold® DNA polymerase hot-start activation), and 50 cycles of: 15 seconds at 95°C (for duplex melting), 1 minute at 58°C (for annealing and extension; normally 60°C; ABI). For pipetting accuracy purposes, we always prepare enough of each reaction mixture to accommodate 30 ?l reaction sizes but, in the end, use only 25 ?l of each in the final reaction wells in 96-well qPCR reaction plates.
Two-step real-time qPCR
Our use of fluorogenic two-step real-time qPCR is now limited only to performing preliminary optimization and validation plates for brand-new target primers and probes since it is generally less expensive than the corresponding one-step procedure. Toward this end, for two-step qPCR, we use ABI Cat. No. 4304437 TaqMan® Universal PCR Master Mix 2X which contains AmpliTaq Gold® (hot-start) DNA Polymerase, undisclosed amounts of MgCl2, A, C and G dNTPs and dUTP (in order for the AmpErase® UNG system to work), AmpErase® UNG Enzyme, 300 nM ROX passive internal reference molecule, a PCR product carryover correction component and other proprietary buffer components. Primer optimization plates are run in a GeneAmp® 5700 real-time PCR machine (GeneAmp® 5700 Sequence Detection System, ABI) using the following thermocycler conditions (a specific thermocylcer program created and optimized by ABI to be used specifically with the TaqMan® Universal PCR Master Mix 2X, and two or three other related ABI 2X Master Mix reagents): Hold for 2 minutes @ 50°C to activate the AmpErase® UNG enzyme (See Appendix 5), Hold for 10 minutes @ 95°C (to "hot-start" activate the AmpliTaq Gold® DNA polymerase) and then 50 cycles of 15 seconds @ 95°C (for duplex melting) followed by 1 minute @ 60°C (to accomplish the annealing and extension phases of the PCR). Each 50-cycle run lasts 2 hours and 14 minutes, after which the GeneAmp® 5700 sequence detection system software and custom Microsoft Excel files are used in conjunction with one another to analyze and interpret the resultant fluorogenic qPCR Rn or CT values. For all optimization trials, each sample is analyzed in either triplicate or quadruplicate. On the primer-optimization plate for each target, primer amounts that, upon analysis, provide the highest Rn value with the lowest primer concentration(s) are identified as the optimal concentrations for each primer pair for each of the respective qPCR targets of interest. To test each probe for optimal efficacy, a second plate is designed for each target to enable the testing of various concentrations of each probe ranging from 25 nM to 225 nM in the presence of optimal primer concentrations (as already established by the primer-optimization plate in each case). For each probe, in each well, each 25 ?l PCR reaction contains the [two-step]-identified optimal concentrations of each primer for each target, 2.5 ?l of 1:5 or 1:10-diluted Stock I cDNA (See Appendix 6), 12.5 ?l of the ABI commercial master mix (mentioned above) and nuclease-free water. For the purpose of providing real-life examples for this paper, we address several targets of interest to us including: sheep beta-defensin-1 (SBD-1), ovine thyroid transcription factor-1 (ovTTF-1), ovine surfactant protein A (ovSP-A), ovine surfactant protein D (ovSP-D), and housekeepers ovine ribosomal protein S15 (ovRPS15) and human 18S ribosomal RNA (hRIBO18S) (Figs. 22, 23, 27, 28 and Appendix 14). For these targets, we found optimal primer [two-step] concentrations in each case to be 300 nM and 900 nM for SBD-1, 1 ?M and 1 ?M for ovTTF-1, 300 nM and 300 nM for ovSP-A, 300 nM and 300 nM for ovSP-D, 1 ?M and 1 ?M for ovRPS15, and 50 nM and 50 nM for hRIBO18S forward and reverse primer concentrations, respectively. For one-step analyses, (for reasons already discussed above regarding the partial use of reverse primers due to first-strand syntheses), these same primer sets were used at 500 nM and 1 ?M for SBD-1, 1 ?M and 1 ?M for ovTTF-1, 500 nM and 500 nM for ovSP-A, 500 nM and 500 nM for ovSP-D, 1 ?M and 1 ?M for ovRPS15, and 50 nM and 50 nM for hRIBO18S RNA forward and reverse primer concentrations, again respectively. Each reaction mixture on each optimization plate for each target was run in triplicate or quadruplicate in order to bolster the statistical significance of sample assessments. In all cases, replicate sample well CT values never deviated more than 0.5% from one another, lending high credence to the technique's consistency, stability and reproducibility (Figs. 9 and 10). Probe-optimization plates were also run in the GeneAmp® 5700 sequence detection system using the same thermocycler program as used for the primer-optimization plates. For analysis of the data from probe-optimization plates, the combination of reactants that yielded the lowest CT values with the lowest probe concentrations were chosen as the optimal fluorogenic probe concentration in each case (which we found to be 150 nM, 150 nM, 50 nM, 100 nM, 150 nM and 200 nM for SBD-1, ovTTF-1, ovSP-A, ovSP-D, ovRPS15 and hRIBO18S RNA probes, respectively – and we used these same probe concentrations for one-step qPCR as well). Next, as a validation test that target and endogenous reference (housekeeper) cDNA amplification reactions were all proceeding at acceptable efficiencies across a spectrum of Stock I cDNA concentrations, a third plate (the validation Test Plate) was designed to enable the testing of various concentrations of cDNA ranging from full-strength Stock I cDNA to a 1:15,625 (e.g. the seventh in a series of progressive 1:5 dilutions) dilution of Stock I cDNA. In each well, constant (optimal) concentrations of forward and reverse primers and constant (optimal) concentrations of probe were used along with 12.5 ?l of ABI (Cat No. 4304437) master mix, 2.5 ?l of sequentially-diluted Stock I cDNA and nuclease-free water. Also included on this plate, were wells identical to the ones just described, but instead of ovine target primers and probe, they contained either the endogenous reference/housekeeper (hRIBO18S RNA) forward and reverse primers and probe at their optimal real-time concentrations (50 nM primers and 200 nM probe; as established by ABI for this target) or ovRPS15 forward and reverse primers and probe at their optimal concentrations. Validation plates included all samples in triplicate and were run in the GeneAmp® 5700 sequence detection system using the same universal thermocycler protocol as used for the primer-probe optimization plates, and resulting CT values were subsequently analyzed using custom Excel files (16, 19).
Fig. 23. FF2-6-001 qPCR set-up tool TestPlateResultsAnalysis2006.xls file; Test Plate final CT entry area (shown in red font).
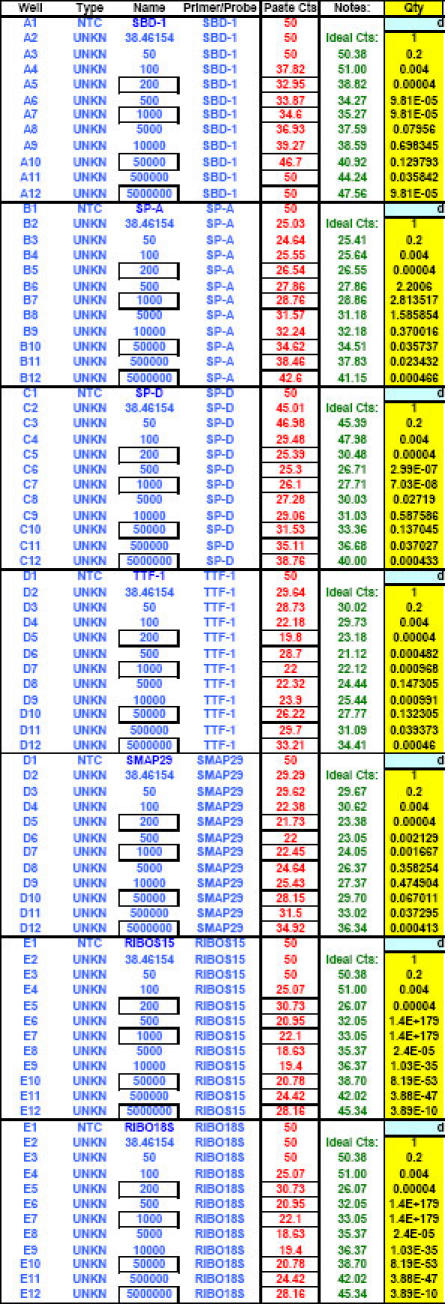
Fig. 27. Additional example of optimal ranges identified for a different group of qPCR targets.
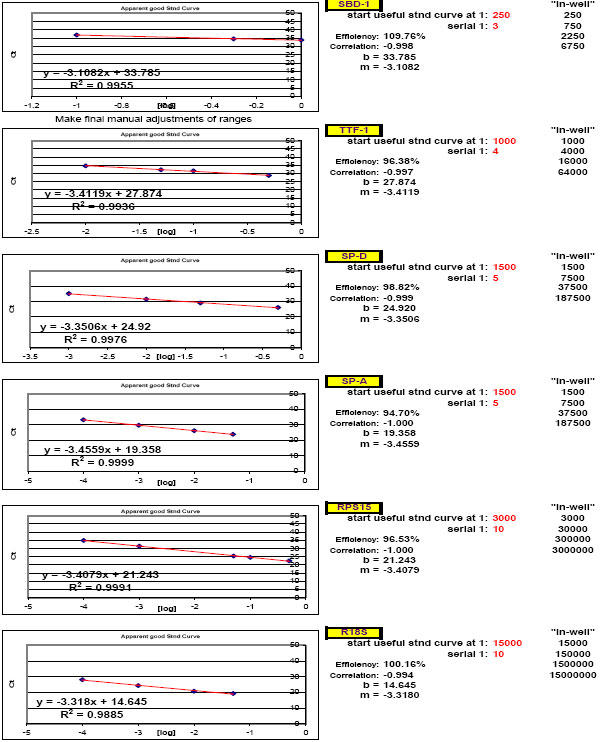
Again, reaction efficiencies (or 'efficacies') and slopes were calculated from Test Plate CT values for each qPCR target dilution to ascertain the optimal RNA dilution ranges for each of the targets. (Early prototype versions of FF2-6-001 qPCR set-up tool TestPlateResultsAnalysis2006.xls and TestPlateResultsAnalysis2006b.xls files were used to make the determinations shown here).
Fig. 9. Example of the consistency of data generated under favorable/optimal conditions by qPCR (compare this to the results shown in Fig.
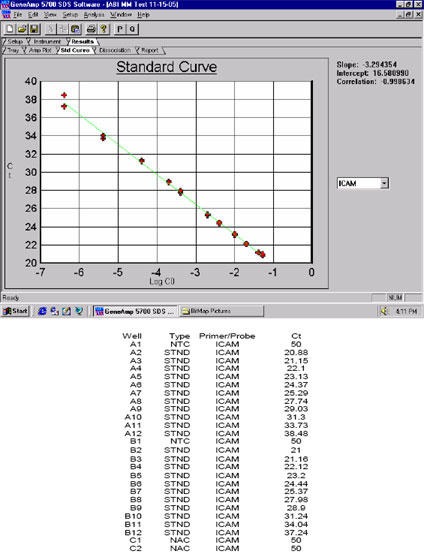
10). ABI Cat. No. 4309169, TaqMan® One-Step RT-PCR Master Mix Reagents Kit and the ABI GeneAmp® 5700 Sequence Detection System were used.
Fig. 10. Amplification plots of the same samples (as in Fig.
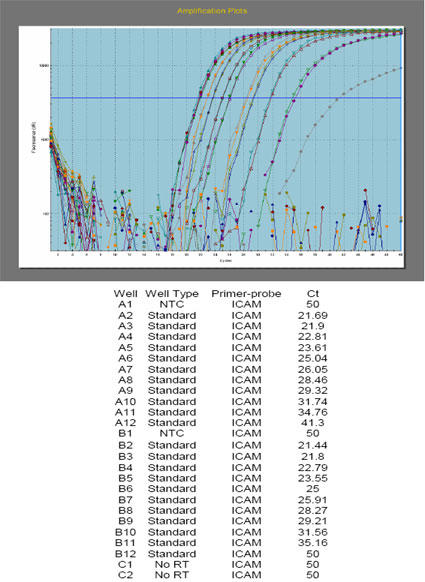
9above) run on a Stratagene Mx3005P real-time qPCR machine. Note the consistency in relative CT values between results from the two different machines referred to in Figure 9 and this Figure. This bodes very well for highly-optimized qPCR in general. ABI Cat. No. 4309169, TaqMan® One-Step RT-PCR Master Mix Reagents Kit was used.
RNA isolation and cDNA synthesis
RNA isolation from whole tissue samples
Briefly, entire tissue samples (1-2 grams of each in cryovials stored at -80°C immediately post-necropsy) are carefully weighed, placed immediately into 3 ml of Trizol® reagent inside nuclease-free 50 ml conical centrifuge tubes (Greiner-USA Scientific) and homogenized for 30 seconds using a TH OMNI Homogenizer (OMNI International, Inc.) to obtain Trizol®-tissue pre-homogenates. Measured amounts of Trizol® are then added to calculated portions of each pre-homogenate to obtain 0.091 mg tissue per ml. This makes each tissue homogenate as experimentally similar as possible and ensures that the RNA extraction capabilities of Trizol® itself are not exceeded (as per manufacturer’s guidelines). After brief vortexing, 1.1 ml of each final Trizol®-adjusted homogenate is transferred to a nuclease-free 1.5 ml vial (USA-Scientific) and allowed to sit for 5 minutes at room temperature. 200 ?l nuclease-free chloroform (Fisher Scientific) is added to each and tubes are shaken vigorously for 15 seconds. Samples are allowed to sit for 3 minutes at room temperature then microfuged at 12,000 × g for 10 minutes at 4°C. Top aqueous layers are carefully removed and transferred into new nuclease-free 1.5 ml vials, and 500 ?l nuclease-free 2-propanol (Fisher Scientific) is added to each. Samples are briefly vortexed, allowed to stand at room temperature for 10 minutes, then microfuged at 12,000 × g for 10 minutes at 4°C. Large white pellets are visible at the bottom of each sample tube at this point and the 2-propanol is subsequently dumped from each tube followed by three washes with pre-cooled (-20°C) 75% nuclease-free ethanol prepared with nuclease-free water (Sigma-Aldrich, Ambion). The first two of these washes are carefully dumped off, while the third wash is vortexed until each pellet is swirling in solution to more fully wash any lingering guanidine isothiocyante (GIT) or other salts out from underneath each pellet – salts which might otherwise inhibit subsequent procedures. Next, all samples are microfuged at 15,300 × g for 5 minutes at 4°C, the final 75% ethanol supernatant is carefully dumped off, and samples are air-dried for approximately 35 minutes under a fume hood. 170 ?l of nuclease-free 0.1 mM EDTA (Sigma) prepared in HPLC-grade water (Fisher) and adjusted to pH 6.75 is added to each pellet (See Appendix 7), each sample is vortexed briefly, heated to 65°C for 5 minutes (to aid in RNA pellet resolubilization), vortexed briefly again, then stored at 4°C. RNA isolates are then assessed at 1:50 dilution for quantity and purity by spectrophotometry at 260nm and 280nm followed immediately by DNase treatment with TURBO DNase (TURBO DNA-free kit, Ambion). Each DNase treatment reaction consists of 60 to 70 ?l RNA isolate, 8 to 18 ?l nuclease-free water, 10 ?l 10X TURBO DNase Buffer and 12 ?l TURBO DNase enzyme. Reaction mixtures (100 ?l each) are placed into an Applied Biosystems Incorporated GeneAmp® 2400 thermocycler (Perkin Elmer/ABI) for 30 minutes at 37°C. 1 ?l DNase Inactivation Reagent per 10 ?l solution is added to each tube. The tubes are incubated for 2 minutes at room temperature with intermittent vortexing every 10 to 15 seconds, and then centrifuged at 10,000 × g for 3 minutes to pellet the Inactivation Reagent. Next, if RNA is to be used directly in one-step qPCR applications, 80 ?l is carefully recovered from each DNase-treatment reaction; the upper transparent layer containing the RNA is transferred to a new tube (care is taken to avoid ~15-25% of the solution on the bottom of each tube – which is the pelleted Ambion DNase Inactivation Reagent polymer complex that can inhibit PCR reactions) and diluted 1:10 with nuclease-free water (Ambion) resulting in 800 ?l of each RNA isolate to use for [FF2-6-001-calibrated] real-time qPCR analyses. However, for one-step qPCR analyses, it is important to note two things at this point: 1.) even at 1:10 dilution post DNase treatment, the RNA samples are still too concentrated to generate uninhibited qPCR target signals, and 2.) we never freeze the RNA samples from this point on before their use in qPCR; they are stored at 4°C in nuclease-free 1.5 ml vials. Age-matched samples and Stock I solution-derived standards are run on the final qPCR plates. Prior to isolating total RNA from cultured cells, we collect cells from culture flasks by standard methods, pre-homogenize them in 1 or 2 ml of Trizol® by hand-pipetting, then store the resulting cell pellet-Trizol® pre-homogenates at -80°C until they are needed for total RNA isolation.
To freeze or not to freeze RNA samples
A controversial maneuver we perform is to never freeze our RNA isolates before use. One can freeze RNA isolates and use them later – but, we prefer to use them immediately to avoid any potential issues that might arise from freeze-thawing RNA. In order to minimize the potential effects of RNA degradation on qPCR results, we use only 'age-matched' RNA samples (RNAs isolated, DNase-treated and stored at 4°C on the same day) and corresponding standards (prepared from age-matched Stock I solutions) during final one-step qPCR analyses. In the event that Stock I solutions are out of date with newer sample unknowns, previously-generated age-matched standard curves are used for quantitative analysis. A major reason we currently avoid freezing RNA is based on our observations of shifts in target CT values after using freeze-thawed total RNA Trizol®-isolated from whole sheep lung in qPCR applications. These shifts, curiously, are often to lower CT values – indicating either improved reverse transcription efficiency (presumably due to less, or different secondary structures on shorter transcripts) (See Appendix 8) or possibly due to less reactants being used up during first-strand synthesis (during reverse transcription) on account of there being shorter freeze-fractured/truncated transcripts to work with; leaving more reactants available during the fluorogenic PCR phase, thereby improving the 'voracity' of the PCR. But, no matter the reason, this was troubling enough that we have since avoided freezing tissue and cell culture RNA isolates entirely. However, we have indeed observed that rarer targets (i.e. IL-10) in Stock I solutions tend to exhibit steadily weaker qPCR signals over a three month period, but it is not clear yet if this indicates degradation of RNA stored at 4°C, or if it is the result of using primers and probes that have been repetitively freeze-thawed. One of the features of a closed system is that it eventually breaks down; so we advise investigators to use their RNA samples and Stock I preparations as quickly as possible (when using real-time one-step qPCR). Two-step real-time qPCR has the added advantage that cDNA is more stable, but, even with one-step real-time qPCR; transcriptomic profiles are skewed to some degree always in direct accordance with the method of reverse transcription used.
Laser capture microdissection (LCM)-derived RNA sample isolates
We have developed a different line of reasoning altogether to handle RNA obtained by laser capture microdissection (LCM). Because there is precious little RNA in most LCM-acquired RNA isolates, we have not studied the behavior of LCM RNA samples under as many different conditions as we would like to. In addition, the fact that LCM-derived RNA samples are often tiny to begin with (e.g. 25 cells worth of RNA-containing total cell isolate) also means that it cannot withstand some of the immense dilutions spoken of elsewhere in this paper. But, we have used unfrozen and once-frozen LCM-derived total cell extracts directly in real-time one-step qPCR without noticeable differences in final results as long as samples were isolated from sections less than 8 days old in each case (16). In addition, given the different methodologies involved, there is no reason to think that the same rules would apply to LCM-derived RNA as apply to the relatively abundant RNA we get from tissues and cell cultures; extraction methods are different, carryover of potentially inhibitory biological material during RNA isolation is minimal, and sample component composition during qPCR is different (See Appendix 9). Truly, one of the great features of real-time qPCR is that it relies on very small sequence regions for successful amplification (~150 bases or less typically). The law of averages would seem to favor the notion that the very small real-time qPCR regions of amplification will be left intact after multiple sample freeze-thaws and even outright RNA degradation – which is the very reason that real-time qPCR still yields spectacular results on highly-abused nucleic acid samples. In fact, we have demonstrated that extensively-freeze-thawed, five-year-old whole lung tissue Trizol®-isolated total RNA used in one-step real-time fluorogenic qPCR generated nearly identical CT values for several targets as it did on the first day of its isolation (RNA sample from ewe 265, Caverly-Grubor-Gallup-Ackermann, 2002 unpublished). Because of this, we believe real-time qPCR will remain one of the most important, reliable tools for genetically analyzing very old and degraded RNA and DNA samples given its extreme sensitivity and modest requirement that only very small stretches of nucleic acid sequences within samples need remain intact.
cDNA synthesis using SuperScript™ III and a custom reverse transcription buffer
When two-step qPCR is to be run, instead of diluting RNA isolates 1:10 post-DNase treatment, they are each diluted to 59.4 ng/µl and used as templates for complementary deoxyribonucleic acid (cDNA) synthesis (for use as samples or Stock I cDNAs in two-step qPCR), we use SuperScript™ III RT enzyme (Invitrogen) for reverse transcription. We prepare and use our own 10X reverse transcription buffer formulation (300 mM TRIS:HCl, 625 mM KCl, pH 8.3) in order that the ionic strength of our resulting cDNA solutions is similar to the ionic strength of the two-step master mix we use (TaqMan® Universal PCR Master Mix 2X, ABI). Briefly, reverse transcription master mix containing 3.38% nuclease-free water, 31.17 mM TRIS, 64.94 mM KCl, 5.71 mM MgCl2, 2.08 mM dNTP mix, 2.6 ?M random hexamers and 0.0222 ?g/?l TURBO DNase-treated RNA is heated for 5 minutes at 65°C then snap-cooled on ice for at least 1 minute. We pre-dilute our TURBO DNase-treated RNA samples such that adding 36 ?l of each RNA to each final 100 ?l reverse transcription reaction results in all reactions containing 2.1389 ?g total RNA. Two to four such 100 ?l reactions are created from the same original reverse transcription master mix for all samples. Samples are spun down, and RNAse inhibitor (20 U/?l, ABI) and SuperScript™ III RT enzyme (200 U/?l, Invitrogen) are finally added to each cooled sample reverse transcription mixture (now 200 to 400 ?l each). The final concentrations attained of each reverse transcription component are: 3.25% nuclease-free water, 30 mM TRIS, 62.5 mM KCl, 5.5 mM MgCl2, 2 mM dNTPs (0.5 mM each of dATP, dCTP, dTTP and dGTP), 2.5 ?M random hexamers, 3.5 U/?l SuperScript™ III RT enzyme, 0.4 U/?l RNAse inhibitor and 0.021389 ?g/?l TURBO DNase-treated RNA. These reagents are vortexed gently, split into 100 ?l amounts into nuclease-free 0.2 ml tubes (Midwest Scientific), and the tubes are placed into the GeneAmp® 2400 thermocycler (which only accepts samples of 100 ?l or less) for reverse transcription using thermocycler conditions of: 5 minutes at 25°C, 45 minutes at 53°C, 15 minutes at 70°C, followed by a safety hold at 4°C.
Concerns over the use of cDNA in two-step fluorogenic real-time qPCR
For those who prefer to make their own cDNAs beforehand in pursuit of two-step real-time qPCR as the relative quantitative tool of choice, it is interesting to note that cDNAs, when reverse transcribed from Trizol®-isolated RNAs showing original sample o.d.260nm readings (at 1:50 dilution) of 0.011 to 0.022 and higher are (by the time they are synthesized and diluted i.e. 1:10 before use in qPCR) already safely outside the dilution range where most qPCR inhibition would exist. For column-isolated RNAs, the lowest acceptable original o.d.260nm value at 1:50 dilution for each RNA isolate can be calculated to be about 0.00275 to 0.0055 in the same regard. These observations apply to fairly standard reverse transcription reactions wherein 2 ?g of RNA is used per each 100 ?l reverse transcription reaction for cDNA synthesis (according to standard ABI practice) whereas 1 ?g of RNA is used per each 100 ?l reverse transcription reaction during Invitrogen SuperScript™ II reverse transcription reactions. Additionally, to improve the overall yield of cDNA synthesis reactions, it has been recently noted that priming reverse transcription reactions with random pentadecamers (as opposed to random hexamers or other primers) boosts cDNA yields by 2-fold while increasing the number of detectable transcripts by 11-fold (26) (See Appendix 10). In our experience, qPCR inhibition is still evident with the most concentrated cDNA standards or samples examined for the presence of the frequently-used housekeeping gene, 18S ribosomal RNA, so care should be taken to dilute all similarly destined cDNAs at least 500 to 1,000-fold further before trustworthy CT values can be generated from such robustly-abundant target transcripts (See Appendix 11). An additional caveat to note regarding two-step real-time qPCR is that rare targets are often not amplified as efficiently by two-step as they are by one-step real-time qPCR. This, we have concluded, is the very result of cDNA templates already having suffered considerably more dilution along the way from RNA isolation, through reverse transcription reactions and any additional dilutions before qPCR takes place. We have found our strongest qPCR signals from rare targets using one-step as opposed to two-step real-time qPCR. Further, by setting up one-step real-time qPCR plates in strict accordance with what the FF2-6-001 qPCR set-up tool (see Figs. 11 through 39 for depictions and descriptions of the different portions of the FF2-6-001 file system) reveals to us about the proper dynamic range of each target, we avoid diluting our RNA samples too much or too little and are therefore able to preserve maximal qPCR signal strength from each target amplification of interest while at the same time avoiding all qPCR inhibitory phenomena. Real-time signal (either target or housekeeper-derived) contributions generated from genomic DNA-contaminated samples during qPCR can be mathematically addressed by custom files as well (Fig. 42).
Fig. 11. Portion of FF2-6-001 qPCR set-up tool MasterEntrySheet.xls file (Sheet 1) which the user fills out to tell the system target and housekeeper names and what concentrations of primers and probes will be used for each different target.
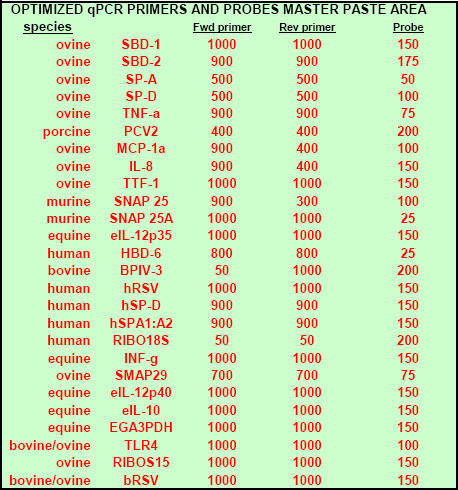
Extra room is provided here (and elsewhere in the MasterEntrySheet.xls file) for additional targets.
Fig. 39. 'Sample aiming device' portion of FF2-6-001 qPCR set-up tool MasterEntrySheet.xls file which allows the investigator to manually pre-select where all qPCR signals will most likely appear within the respective Test Plate-determined LOG-linear standard curve ranges for each different target and housekeeper evaluated.
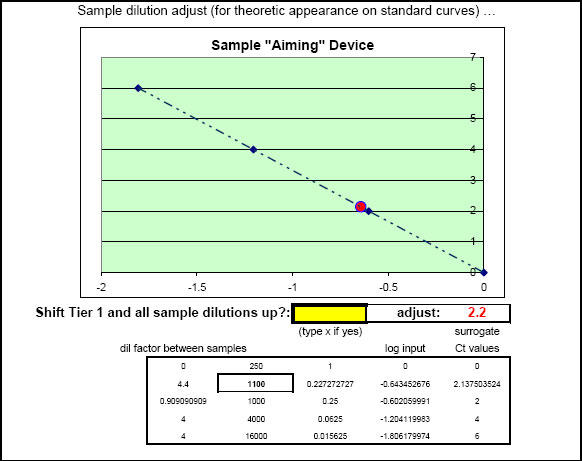
Fig. 42. Depiction of the custom Excel file we use to examine the results of NRC plates to determine whether or not DNA contamination in RNA samples contributes significantly to sample target and/or housekeeper signals and, if they do, this file can be used to mathematically correct for it.

Typically, signals elicited from NRC reactions that amplify across threshold greater than 5 cycles away from genuine qPCR signals have very little impact on final qPCR quantitation calculations. In our studies, NRC signals are typically 13 cycles or more away from genuine qPCR signals.
Housekeeping gene considerations
Another area of concern has been choosing appropriate housekeepers for qPCR, and most recently it appears that ubiquitin, transcription and elongation factors, transferrin receptor and several ribosomal protein mRNAs are among the most stable housekeeping signals, whereas GA3PDH, ?-actin, ?-tubulin and even 18S ribosomal RNA have been given progressively more negative and mixed reviews in this regard. Since 18S rRNA is a more globular structural form of RNA (and therefore likely subject to different degradative stresses or processes than mRNA), it is being increasingly thought of as a poor representative of linear transcripts in general (comment by Jim Wicks, Ph.D., PrimerDesign Ltd). It is also possible that the same housekeeper's usefulness may vary from tissue to tissue, but Ubiquitin still seems to be quite stable in this regard (1, 2). However, in vivo (endogenous) housekeepers may become a thing of the past as more investigators explore the use of in vitro synthetic constructs or transcripts from highly disparate species (which exhibit no homology with the genome of the species being studied) – e.g. a jellyfish photoprotein (aequorin; GenBank accession number L29571) cRNA was successfully used as a ‘reference gene’ (as an externally-introduced 'housekeeping' gene) in recent murine studies at the University of Bonn, in Bonn, Germany. The foreign reference jellyfish cRNA was found to be just as reliable as three other endogenous murine housekeeping genes (?-actin, GA3PDH and HPRT1) in that study (29). Normalization of gene expression using expressed Alu repeat elements is also currently being proposed (40), which will be highly useful for primate RNA samples. In addition, RNA samples taken from other mammalian genomes (for the purposes of qPCR) which house similarly unique (species-specific) repetitive genetic elements (many of which, like Alu sequences, are found within the untranslated regions of numerous mRNAs throughout the transcriptome), (41), might also take advantage of this approach, while RNA samples from animals with indigenously fewer unique repeats, such as birds, may benefit little from it (42).
Review of basic real-time qPCR math
Crucial to the proper interpretation of any real-time qPCR data is a clear understanding of the mathematical principles underlying generation of the data. Though it is not the intent of this manuscript to promulgate the entire possible range of the math involved, it is nonetheless important to touch on the most relevant equations and concepts; some of which are likely generally familiar and accepted, and one or two of which may be unique. In brief, the ideal slope (m) of the dilution curve for any real-time qPCR target is invariably -1/LOG10(2) or the value "-3.3219..." etc. Such a slope indicates a reaction Efficiency or 'Efficacy' (E) of 1 (or 100% Efficiency), which correlates to an Exponential Amplification (EAMP ) value of 2 (indicating a perfect doubling of template every cycle). When efficacy of template doubling per cycle is sub-optimal, E <1 and EAMP <2, e.g. if E = 0.83, then EAMP = 1.83 since the expressions for E and EAMP are [10(-1/m)– 1] and 10(-1/m) , respectively. When E is not known, the expression, "2?? " (or "2-??Ct ") can sometimes be used to compute the approximate fold change in gene expression between control and treated samples (or normal vs. abnormal, diseased vs. non-diseased, or any sample vs. an appropriately-selected "calibrator" sample, etc.), but this expression is simplistic in that it entirely ignores the impact that E has on the target and housekeeper reactions in each case (36). When E is known for targets and housekeepers, the 2-??Ct expression can be expanded into: Fold increase = (2 x E)??Ct where the term "??CT" =[(CT target,control -CT housekeeper,control )-(CT target,treated -CT housekeeper,treated )] (27). This ("expanded 2??Ct ") equation generates similar (though not identical) results to the "Pfaffl Equation" (28) and the "ISU Equation" (see below) only when the term "(2 x E)" is replaced by the more precise term "(1 + E)" to yield the corrected "expanded 2??Ct " equation: Fold increase = (1 + E)??Ct . Use of the term "(1 + E)" here is more appropriate since it is in direct keeping with the original universal expression for all PCR amplifications: "Xn= Xo(2)n ," which, for less-than-100%-efficient reactions, by necessity becomes: "Xn= Xo(1+E)n ." In this equation, "Xo " represents the initial number of target copies, "n" represents the number of cycles elapsed, "Xn " represents the number of target amplicons generated after "n" cycles, and "E" = Efficiency ([10(-1/m) – 1]), (36). When the term "(2 x E)" is used (27), the "expanded 2??Ct equation" is prone to underestimating fold differences between samples, whereas using 2??Ct , by itself, consistently overestimates fold differences since it is inherently erroneous in that it assumes all qPCR reactions to be 100% efficient. 2??Ct is nonetheless a very helpful and informative approximation when efficiencies are unknown.
Efficiency of reaction versus exponential amplification
It is always important for one to differentiate between "E" and "EAMP " since the Pfaffl Equation uses "EAMP " instead of "E" when solving for relative quantitative and absolute quantitative gene expression results. These two terms are often confused in the literature and are mistakenly represented as interchangeable, which they are not. As a result, investigators can be thrown off course during the computation of their qPCR results. The Pfaffl Equation can be written as follows:
Ratio (or fold change) = (Etarget)?Ct target(control - treated) / (Ehousekeeper)?Ct housekeeper(control - treated)
where R = "ratio" or calculated fold change in a specific target gene's presence or expression level when comparing RNA isolated from a treated (or infected) plant or animal tissue or cell type to RNA from the corresponding normal, control or calibrator RNA samples (28). The value often written as "E" in the Pfaffl Equation is indeed "EAMP "; 10(-1/m) , and should not be confused with the symbol "E" which connotes amplification reaction efficiency; [10(-1/m) – 1]. In addition to the Pfaffl Equation, there is another important partial equation that can be repetitively incorporated into a mathematical expression to form an equation (the ISU Equation) which generates values identical to that of the Pfaffl Equation. However, the ISU Equation makes room for the investigator to plug in the values of "m" and "b" from target and housekeeper standard curves and is derived from a partial equation indirectly alluded to in ABI User Bulletin #2 (31), namely: "Qty = 10((Ct-b)/m) ," where "Qty" = the relative calculated quantity for any target, CT = the observed CT generated for the particular target or housekeeper being evaluated, and "m" and "b" are the slope and y-intercept, respectively, of that target or housekeeper's standard curve (which are plots of LOG10 of the Stock I or sample dilution factors or "LOG10 input," versus CT). The expression "Qty = 10((Ct-b)/m) " can be directly assembled into the ISU Equation in the following way:
Ratio (or fold change) = [(Qtytreated ,[target])/(Qtytreated ,[housekeeper])] divided by: [(Qtycontrol ,[target])/(Qtycontrol ,[housekeeper])]
Notice that, implicit in the ISU Equation, are the Efficiency (E) values for housekeeper and target gene amplifications by virtue of the equation's direct inclusion of "m" and "b" values from the corresponding target and housekeeper standard curves. Although one finds that the Pfaffl and ISU equations both generate identical results, be aware that these values are not yet amenable to sound statistical analysis – the resulting values must be logarithmically transformed, using any logarithmic base (Figs. 40 and 41). We have chosen to transform to LOG base 2 values (LOG2) in accordance with Gilsbach et al. (29). In this form, qPCR (and PCR) data of any kind appropriately lends itself to correct parametric, t-test and/or box-plot statistical analyses (29, 30, 43 and Dr. Marcia de Macedo, 2004 unpublished). We LOG transform our qPCR data as soon as we have calculated our relative quantity values (either before or after division by housekeeper values). Subsequently, treatment group averages, standard deviations within treatment groups and standard error of the mean (s.e.m.) error bar ranges are all calculated from the LOG-transformed quantity values. Once this first stage of data processing is complete, control group averages are then directly subtracted from themselves and all related treatment group averages (so all control groups appear at "0" level expression), a maneuver which is supported by the law of logarithms wherein LOG A/B = (LOG A – LOG B), and finally, new standard error bars are recalculated using the equation:
Fig. 40. Graph showing the result of LOG2 and LOG10 transformation of any data set (original values are shown as the top, dark blue line).
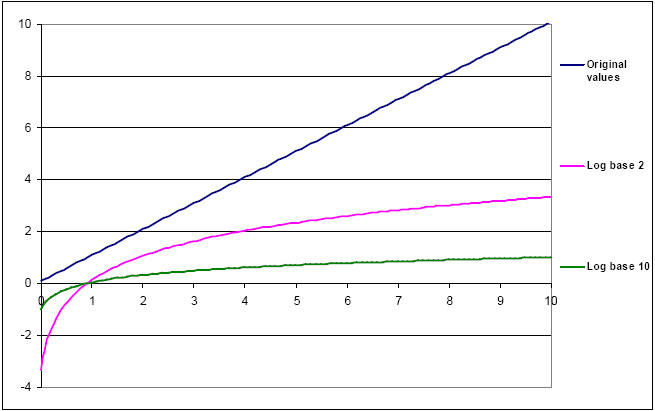
For PCR of any variety, it is absolutely necessary to LOG transform the data in order to compress the variance so that relevant parametric and t-test analyses may ensue (29, 30). LOGx transformation of qPCR data also exposes the Monte-Carlo effect, e.g. low-copy number targets which amplify across threshold after 40 cycles often exhibit statistically-unacceptable variance (2, 37).
Fig. 41. Graph showing the result of LOG2 transformation of a recent data set.
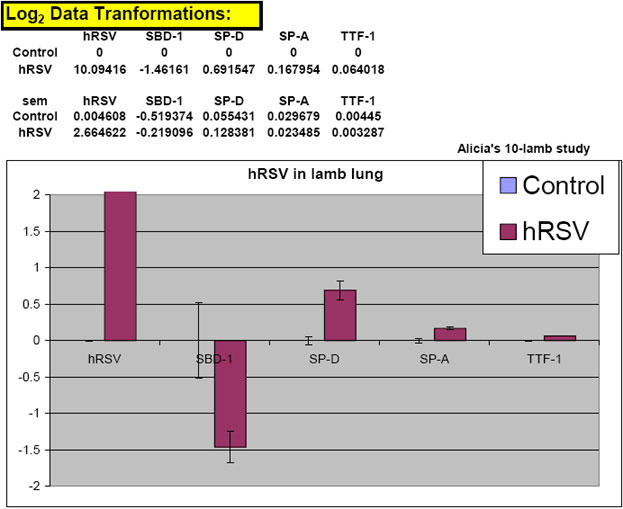
Notice how the "zero" value on the x-axis ends up being where "control" or "calibrator" target expression appears. This is a very user-friendly way to represent final real-time qPCR data as it shows which samples are expressing targets above and below that of control or calibrator levels in a visually easy-to-interpret fashion (Olivier-Gallup-Ackermann, 2006 unpublished results).

which can be derived through statistical variance equations. LOG transformation of PCR data of any kind is a necessity – it is the nature of PCR to show higher variability with lower mean quantity values due to the ever increasing Monte-Carlo effect with decreasing presence of target template in nucleic acid samples (2, 37). This reality is exposed only after LOG transforming quantitative qPCR data. If PCR data is not LOG transformed, one tends to see an opposite, counterintuitive trend: i.e. increasing variance with higher relative quantity means – which is definitely not true as many qPCR investigators can certainly attest to (2, 29, 30, 43). The trend most commonly observed in qPCR shows that final quantitative results generated from consistently lower CT values are generally more stable from replicate to replicate, from sample to sample (low variance), but once target or housekeeper CT values rise above 40, quantitative data begins to exhibit greater and greater degrees of statistically unacceptable variance due to the Monte-Carlo effect in addition to the background "noise" of the assay itself (resulting from the increasing accumulation of, and fluorescent signals from cleaved or displaced probe fluorogens and/or fluorescence-capable quenchers as the PCR proceeds) (32, 33). In our work, it has often been informative to additionally categorize qPCR targets according to the CT range within which we usually expect them to appear during qPCR. Since CT values are directly indicative of original target template abundance, we have created four categories into which most qPCR targets seem to fit, namely: 1.) rare transcripts; (CT range of 38-47), 2.) intermediate-abundant transcripts; (CT 26-37), 3.) abundant transcripts (housekeepers such as GA3PDH, ?-actin, ?-tubulin and RPS15); (CT 20-25), and 4.) hyper-abundant transcripts (i.e. 18S ribosomal RNA); (CT 12-19). It is within the latter portion of the "rare transcripts" CT range noted above that investigators can also expect to experience the Monte-Carlo and assay "noise" effects to some degree. This "rare transcript" status can result from target mRNA being either endogenously rare by nature, made rare by experimental treatment or disease, by sheer sample degradation, or by over-diluting template-containing RNA or cDNA samples during qPCR set ups.
qPCR sample dilution and CT relationships
To continue, the final important mathematical relationships which are essential to one’s understanding of the 'mathematical terrain' associated with qPCR include the following interesting expressions:
A.) 2?= f, where "?" = the ideal expected frequency of appearance of CT values for any dilution series between or among samples and "f" = the known dilution factor between or among samples. Expression A can be rearranged to give expression B:
B.) ?LOG10(2) = LOG10(f), which can be rearranged further into expression C:
C.) ? = LOG10(f)/LOG10(2), which can be rearranged to result in an interesting expression for Efficiency (not Exponential amplification) using the same variables:
D.) E = f(1/? ) - 1, or: E = f(1/?? ) - 1 (when "f" is known), and E = ?f(1/? ) - 1 (when "?" is known)
The utility of expressions A and C above become immediately obvious when one realizes, for instance, that a serial 1:2 progression of diluted standards should ideally generate curves crossing threshold (generating CT values) at a frequency of "LOG10(f)/LOG10(2)" or 1 cycle apart; since f = 2 in this case, the final expression here becomes "LOG10(2)/LOG10(2) = 1." If the serial progression were 1:7, CT values obtained from the corresponding amplification curves would be expected to be spaced "LOG10(7)/LOG10(2)" or 2.80973 cycles apart. When serial progressive dilutions of samples are 1:10, CT values from the amplification curves would be expected to be spaced "LOG10(10)/LOG10(2)" or 3.3219 cycles apart, and so on. On the other hand, when solving for "?," if for instance the observed CT values of a progressive target dilution series were observed to be about 2.3219 cycles apart, one can calculate that the progressive dilution series factor is "2?" or 22.3219 or "5" (indicating that the underlying dilution pattern was based on serial progressive 1:5 dilutions of the qPCR sample RNA, cDNA, Stock I, viral RNA or DNA, etc.). This 5-fold difference in initial target template amounts between samples reveals the utility of the expression, "2?CT ", or "2? ", in that 2? (target) divided by 2? (housekeeper) approximates the Pfaffl equation, and EAMP ? (target) divided by EAMP ? (housekeeper) is the Pfaffl equation. By additionally dividing the resulting value of the above expression, [2? (target) / 2 ? (housekeeper)], by the 2? value of a calibrator sample, one achieves efficiency-uncorrected "2??CT " (or "2-??CT ") analysis of qPCR data (36). On the other hand, dividing the resulting value of the expression, [EAMP ? (target) / EAMP? (housekeeper)], by the EAMP ? value of a calibrator sample, one achieves efficiency-corrected "EAMP ??CT " (or "EAMP -??CT ") analysis of qPCR data. Values generated by this latter equation are identical to results obtained from both Pfaffl and ISU equations. When fold change in gene expression is not calculated in comparison to a calibrator sample's target expression levels, the equations [2? (target) / 2 ? (housekeeper)] or [EAMP ? (target) / EAMP ? (housekeeper)] suffice to reveal fold differences in target gene expression between samples. But, in order to statistically assess the data generated by any of these equations correctly, LOG-transformation of quantity values is required beforehand (29, 30, 36). Any departures from expected CT frequencies (?) of course indicate departures from ideal amplification reaction efficiencies, and for dealing with non-ideal situations (which predominate in practice), we have developed the equation, -LOG10(f) x (1/LOG10(2) – ((1/LOG10(((10(1/((?Ct)/LOG10( f ))))))))), to predict CT appearances for any dilution factor between or among samples at any amplification reaction efficiency (E). The FF2-6-001 qPCR set-up tool is based on such equations.
Efficiency of target amplification concerns
It is important to note that the efficiencies of qPCR amplification reactions are initially only as good as primer and/or probe designs allow. But, equally important are the nucleic acid template dilutions used on a per-target basis. Greater than 100% efficiency (indicative of Type 1 inhibition in our experience) may be observed, and different primer-probe designs (even for the same target) will exhibit varying degrees of susceptibility (or be differentially prone) to each type of inhibition. These potentially confounding phenomena indeed present ongoing challenges to enzymologists and other scientists to further elucidate the molecular mechanisms underlying each particular form of qPCR-related inhibition. In general, the slope of a qPCR target standard curve is the best indicator of whether or not there are problems with one’s qPCR primer-probe designs or template dilutions. Further, after optimizing primers and probes and determining optimal template dilutions for each qPCR target, by running standard curves for all targets on each qPCR plate, one can logistically side-step two common qPCR pit-falls: 1.) since all qPCR reactions for each target on a plate can be assumed to be governed by the same target-specific reaction efficiency (or indeed, inefficiency), including standard curves on each plate (for each target) essentially controls for plate-specific variations for each qPCR target since all same-qPCR-target samples on any given qPCR plate will be judged on the same ‘kinetic playing-field’ as their standard curves (i.e. all sample targets and their corresponding standards on each plate can be thought to have experienced the same environment together throughout a qPCR amplification) and, 2.) ordering and testing multiple primer-probe sets for the same target is cost-prohibitive for many labs (unless one is willing to sacrifice time and target specificity by using SYBR Green-based real-time assays during optimization). Preparing standard curves for each different target on each plate provides a reliable way for investigators to get valid qPCR information even when using sub-optimal primer-probe designs as long as the Monte-Carlo effect is not present as an additional, confounding factor (2, 37). It is important to emphasize that these ideas appear to be most rigorous in the aftermath of running a proper Test Plate for all targets beforehand. It has been our experience almost 100% of the time, that when we design our real-time primer-probe qPCR sets using Primer Express v. 2.0, our resulting observed reaction efficiencies are consistently in the 90-110% range – but, again, only after we have responsibly performed the appropriate Test Plate(s) and analyzed the data using the FF2-6-001 qPCR set-up tool.
The high importance of running a Test Plate
On occasion, one may observe larger departures from ideal efficiencies among series of plates using the same standard curve template source, but, even then, efficiencies as low as 60% and as high as 140% can still be used to acquire credible data if the standards and samples on a single plate are weighed against one another for that plate alone and not cross-compared to results from other plates which have exhibited significantly different efficiencies for the same targets. However, when identical standards and/or inter-plate calibrators generate nearly identical CT values for the same target(s) from plate to plate, investigators can directly compare results among plates with confidence. Still, far and above any other single issue regarding one-step qPCR optimization, we are solidly convinced that the most powerful thing one can do to attain ideal (or near-ideal) efficiencies from any qPCR target amplification is run a Test Plate to physically determine which specific RNA dilution ranges work best for each different qPCR target. For a good example of this see Figures 5 and 6. The three (never-before-tried) primer and probe sets used in this particular study/example (Brockus-Harmon-Gallup-Ackermann, 2006 unpublished) were designed using Primer Express v.2.0, never (two-step)-optimized, and used directly at 'saturating concentrations' in each case (i.e. primers at 1 ?M, and probes at 150 nM). After running a Test Plate for all three targets to identify the optimal RNA dilution range for each, we were able to obtain virtually 100% efficiency from each target amplification in the final qPCR study. Since we have repeated this approach successfully numerous times with other genes, we are confident that it is template dilution that affects the efficiency of real-time qPCR reactions to the greatest degree – barring any obvious thermodynamic flaws in real-time qPCR primer/probe designs or reaction formulations. Again, any qPCR RNA sample’s ability to inhibit qPCR reactions can be diminished and eventually eliminated entirely the further one dilutes RNA samples in effort to attain the useful ranges for each target (as dictated by what one discovers by appropriate Test Plate analyses). There is indeed a "happy sample dilution range" for each qPCR target.
Fig. 5. Demonstration of typical inhibitory qPCR profiles exhibited on qPCR Test Plates by the more concentrated RNA samples (on the right hand side of each graph) in a progressive dilution series.
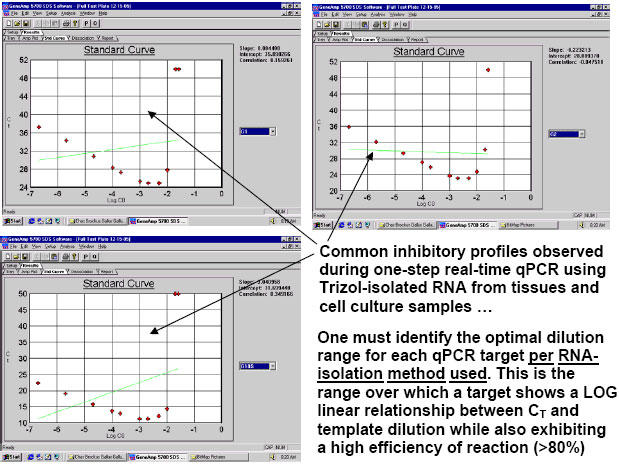
Targets here were Gallus gallus Gallinacin 1, Gallinacin 2 and Gallus gallus 18S ribosomal RNA (the single housekeeper). Stock I here was an equivolumetric mixture of the 26 total tissue RNA samples used in this study: just after their isolation by Trizol method, each RNA pellet was resolubilized in 150 ?l of 0.1 mM EDTA pH 6.75, warmed to 65°C for 5 minutes, and their 260nm and 260nm/280nm measurements at 1:50 were taken. 70 ?l of each resolubilized RNA was then Turbo-DNAse treated [70 ?l RNA isolate + 10 ?l 10X Turbo DNase Buffer + 20 ?l Turbo DNase enzyme (40 Units); and finally 10 ?l Inactivation Reagent] and 80 ?l of each was then diluted 1:10 with nuclease-free water. Subsequently, 50 ?l of each of these 1:10 RNA isolates was mixed together into a single tube attaining a final volume of 1,300 ?l. This was the Stock I RNA solution from which all standards and inter-plate calibrators were prepared. It was also the mixture which served as the source of the serially-diluted template samples for the Test Plate which we ran early on to identify the best RNA dilution ranges for each of the 3 targets. All calculations for this study were quickly performed by the FF2-6-001 qPCR set-up tool.
The effect(s) of sheer sample dilution
In most cases, useful RNA dilution ranges are so dilute (with respect to the originally-isolated RNA samples themselves) that most qPCR inhibitory phenomena has already been eliminated by the time the reactions are run. Factors known and unknown (which would normally bring about real-time qPCR inhibition when more concentrated sample RNAs are used) present no threat to qPCR reaction kinetics whatsoever after ample RNA sample dilution has occurred. Once ideal qPCR template dilution ranges are established for each different target, intended real-time qPCR reactions are allowed to proceed undaunted by inhibition of any kind. In this way, one can use the sensitivity of the real-time qPCR technique itself in its own favor since most targets can be detected – even when RNA is diluted extensively (e.g. most housekeepers still give robust qPCR signals even when diluted out beyond 1:1,000,000!) (See Appendices 11 and 12). Template dilutions thus serve a two-fold purpose: 1.) they achieve optimal template concentrations for each qPCR target of interest, and, 2.) they aid in greatly reducing and eliminating all potential forms of qPCR inhibition. Real-time qPCR inhibition can indeed be muted and even eliminated merely by RNA sample dilution in most cases, therefore leaving all nucleic acid target templates within each RNA sample genuinely available to participate in highly efficient (and-therefore-quantitatively-accurate) qPCR amplifications. Once rendered non-existent by dilution, it simply doesn't matter what type of sample-related inhibition could have had the potential to manifest itself during qPCR using more concentrated RNA; once it is carefully and premeditatedly eliminated by dilution, it is no longer of any consequence. Clearly, preliminary qPCR Test Plates serve to verify where each target reaction's optimal, non-inhibitory RNA dilution range is by examining an RNA sample (or mixture of RNA samples, i.e. Stock I) that is truly representative of all RNA samples examined in each particular qPCR study. In the event that the optimal dilution of an RNA sample for a rare-but-present qPCR target impinges on that target's ability to amplify, further purification of sample RNA may be necessary to minimize its inhibitory characteristics (2). Toward addressing and attaining each of these important objectives, the FF2-6-001 qPCR set-up tool is well suited since it enables investigators to entirely avoid over- or under-diluting RNA and DNA samples.
Finding optimal dilution ranges for each qPCR target by running a Test Plate
Before a qPCR Test Plate procedure can be correctly performed, it is often helpful that all qPCR primers and probes have already been optimized on cDNA template (by two-step qPCR) weeks or months prior to using them in hydrolysis probe-based fluorogenic one-step qPCR reactions. Or, if optimization is not affordable cost or time-wise, one may simply use saturating concentrations of primers (1 ?M) and probes (150 nM) for all targets. Additionally, if two-step optimizations have already been carried out, reverse primer concentrations should all be increased at least 200 nM in each case (for use in one-step qPCR) unless saturating concentrations are already being used. Reverse primers are more highly exhausted by one-step than two-step qPCR on account of their being incorporated into the amplicons during first-strand synthesis (16). By running a preliminary, universally-useful qPCR template dilution Test Plate (Figs. 18 and 22) for all targets in a one-step real-time qPCR assay over a (post-DNase, in-well) dilution range spanning from 1:38.46 to 1:5,000,000) of a representative RNA sample or RNA mixture (See Appendix 13), we quickly identify the useful dilution ranges for each particular qPCR target by using FF2-6-001 custom Excel files TestPlateResultsAnalysis2006.xls and TestPlateResultsAnalysis2006b.xls (Figs. 22-29 and 34). In all cases, immediately after Turbo-DNase treating our RNAs, we dilute them 1:10 with nuclease-free water and place the RNAs at 4°C for safe-keeping (never -80°C); we never freeze our isolated RNAs before use. The CT values obtained from the Test Plate are entered into the TestPlateResultsAnalysis2006.xls file, the user then selects points for each target dilution study which give the best efficiency for each target and activates the appropriate pre-programmed macros which function to accept the user's modifications and serve to help identify the optimal/useful RNA sample dilution ranges for each qPCR target. After the investigator has selected the dilution points for each qPCR target which demonstrate lack of qPCR inhibition, high reaction efficiency (generally accepted to be efficiencies between 80 and 110%) and LOG-linear behavior, the FF2-6-001 qPCR set-up tool quickly calculates the appropriate progressive dilution series for each target's optimal sample dilution, optimal standard curve range and standard dilution series, all serial dilutions required of the Stock I solution and RNA samples, and all master mix/primer and probe amounts to complete the entire qPCR set-up. As a general rule, it is always wise for the investigator to include standard curves for each different target on every plate since this (in theory) allows qPCR studies to tolerate lower amplification efficiencies without unacceptably compromising relative target expression CT analyses. Since all samples on a plate are subjected to the same environment, lower efficiency target reactions analyzed on plates including the corresponding standard curves (at least 3-point standard curves indicating efficiencies no lower than 60%) still yield results that are truly reflective of relative target expression. The FF2-6-001 qPCR set-up tool-determined dilution ranges additionally represent the useful standard curve dilution ranges for each target – within which sample unknowns and calibrators are specifically diluted so they will most likely appear between the first two standards of each Test-Plate-data-determined useful dilution curve for each different qPCR target (based on Stock I Test Plate analysis). A "sample aiming device" feature additionally allows the user to globally adjust this latter parameter as well (Fig. 39). The FF2-6-001 qPCR set-up tool’s TestPlateResultsAnalysis2006.xls and TestPlateResultsAnalysis2006b.xls files are also used to make sure that real-time qPCR signals from each target remain sufficiently strong at the outer (most dilute) region of each assay by revealing the limit of 'signal exhaustibility' for each target. This information is used to ensure that each sample RNA’s highest-but-useable dilution retains enough qPCR signal strength to allow them to remain useful as qPCR samples (e.g. as the most dilute target or housekeeper standard, etc.). The FF2-6-001 qPCR set-up tool saves time by automatically performing numerous and necessary calculations and it is a goal of ours to transform it into user-friendly software that can either be obtained on CD, or downloaded by visiting the link: http://www.dna.iastate.edu/frame_qpcr_res.html in the near future.
Fig. 29. Portion of the FF2-6-001 qPCR set-up tool TestPlateResultsAnalysis2006b file which the user can manually adjust to determine how far above and below the proven LOG-linear range one wishes the standard curve for each target to include.
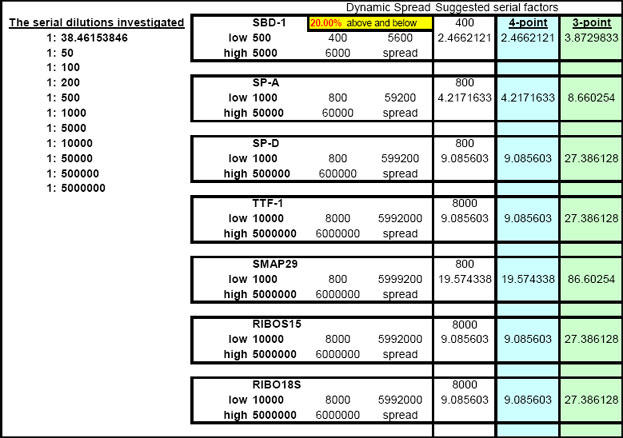
The file default is set at 20% above and 20% below the highest and lowest points of the proven target LOG-linear range in each case. User-access to this parameter is useful in cases where one is confident that the qPCR targets studied exhibit linearity further than the default 20% above and 20% below the calculated optimal dilution profile/range for each target. Elongation of the dynamic range of qPCR target standard curves serves to provide more room within which sample unknowns can appear and therefore be assessed with greater confidence.
Fig. 34. Portion of FF2-6-001 qPCR set-up tool MasterEntrySheet.xls file (Sheet 2) which shows the automatically-calculated NRC master mix set-ups.
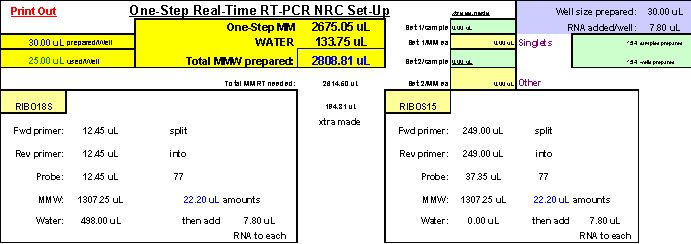
ABI Cat. No. 4309169, TaqMan® One-Step RT-PCR Master Mix Reagents Kit and the ABI GeneAmp® 5700 Sequence Detection System were used here. Note that only housekeeper targets are tested for DNA contamination by NRC (no reverse transcription) analyses since they are the targets which will most likely reveal whether or not DNA contamination exists - given their endogenous genetic abundance in most samples. All master mix calculation files automatically figure in safe extra amounts so the user will not run short on final volumes or run into bubbles at the bottom of sample preparation tubes.
MasterEntrySheet.xls user interface portion of the FF2-6-001 qPCR set-up tool
The MasterEntrySheet.xls portion of the FF2-6-001 qPCR set-up tool is the main user interface wherein the investigator can enter RNA sample o.d.260nm and o.d.260nm/280nm readings and the dilution factor at which o.d.260nm and o.d.260nm/280nm readings were taken. This interface is also used to tell the FF2-6-001 qPCR set-up tool the method of RNA isolation, DNase treatment conditions, which samples will be included in the Stock I mixture, how much of each sample and standard are desired to complete the entire study, all Test Plate, Sample Plate and NRC (no reverse transcription control) Plate requirements, sample use, inter-plate calibrator and NTC usages (Figs. 11-17 and 20). The Stock I dilution profile for the Test Plate can also be adjusted to more fully interrogate the signal dynamics of any RNA or cDNA dilution range of interest, but, in order to save on precious RNA or cDNA samples, we suggest using the default file settings for Test Plate runs in the vast majority of all real-time qPCR situations. Instructions on how to use the FF2-6-001 qPCR set-up tool will be included either within the tool files themselves, or in an accompanying manual. The MasterEntrySheet.xls user interface file is connected (by equations and Visual Basic macros) to 22 other Excel files which make up the entire FF2-6-001 device. Each file is a unique tool in and of itself which has been carefully designed to perform numerous specific calculations within thousands of active cells. The results of one file are used by multiple other files in sequence to carry out extensively layered algorithms. Appropriate "error" messages and other reminders also appear within the files to inform the investigator when mathematically impossible demands have been entered into the system. The FF2-6-001 qPCR set-up tool also automatically identifies samples with problematically low RNA or cDNA concentrations and tells the user which samples will be expected to exhibit qPCR inhibition. After one global macro has been activated and allowed to run, Sheet 2 within the MasterEntrySheet.xls file provides all the printable information investigators will need to set-up everything for each entire qPCR study (Figs. 19, 22, 31-35).
Fig. 17. Close-up of a portion of FF2-6-001 set-up tool MasterEntrySheet.xls file (Sheet 1): Test Plate parameter adjustment area (as also shown in Fig.
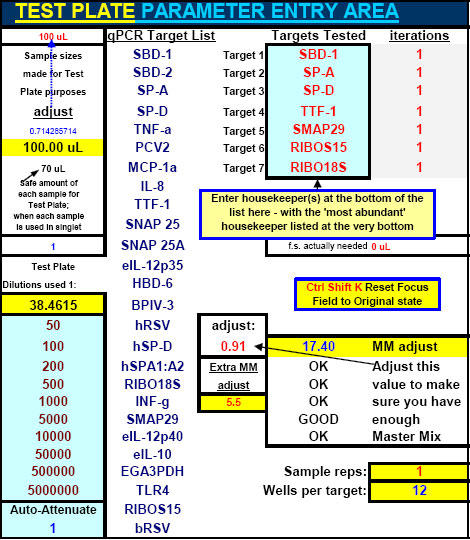
16).
Fig. 20. Close up of the portion of FF2-6-001 qPCR set-up tool MasterEntrySheet.xls file (Sheet 1) used for adjusting final Sample Plate parameters (as also shown in Fig.
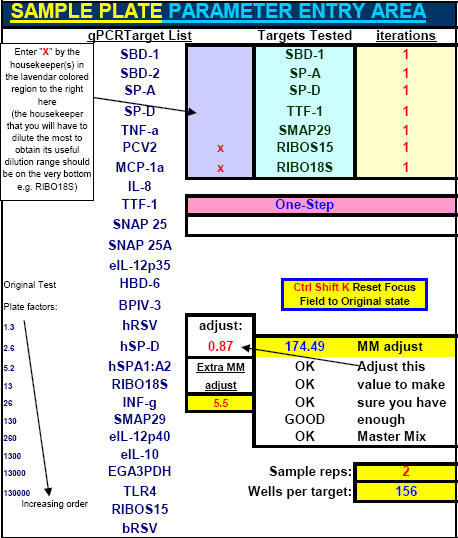
16).
Fig. 19. Portion of FF2-6-001 qPCR set-up tool MasterEntrySheet.xls file (Sheet 2) which shows the automatically-calculated master mix preparations needed to perform the user-designed Test Plate.
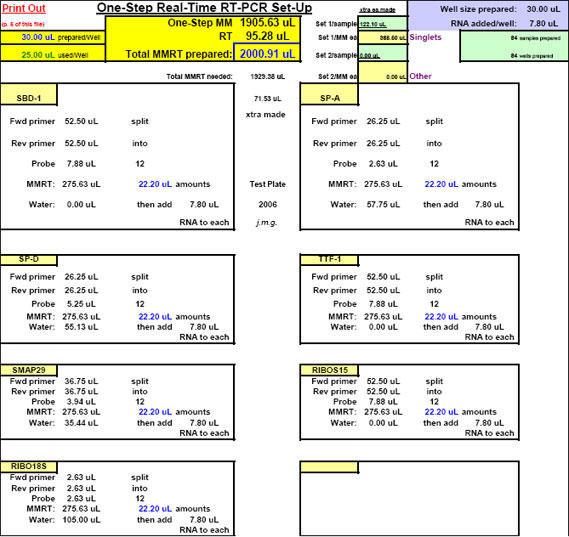
All master mix calculation files automatically figure in safe extra preparative amounts to safeguard the user from running short on final volumes or running into bubbles at the bottom of time-intensive sample preparation tubes.
Fig. 31. Portion of the FF2-6-001 qPCR set-up tool MasterEntrySheet.xls file (Sheet 2) which shows the automatically-calculated serial dilutions the user will perform to obtain the appropriately and differentially diluted RNA samples that have already been calculated to be optimal for each qPCR target (seventy-two RNA samples are shown here).

Notice how (after the Tier 1 dilutions have been performed) all subsequent sample volume transfers from row to row are repetitive and therefore directly amenable to liquid-handling robot technologies (see Fig. 45).
Fig. 35. Portion of FF2-6-001 set-up tool MasterEntrySheet.xls file (Sheet 2) which shows the user the amounts needed to make all the serial dilutions of Stock I which result in the simultaneous progressive creation of all optimally-calculated standard and "inter-plate calibrator" (or extra standard) samples for all qPCR targets tested in any given study.
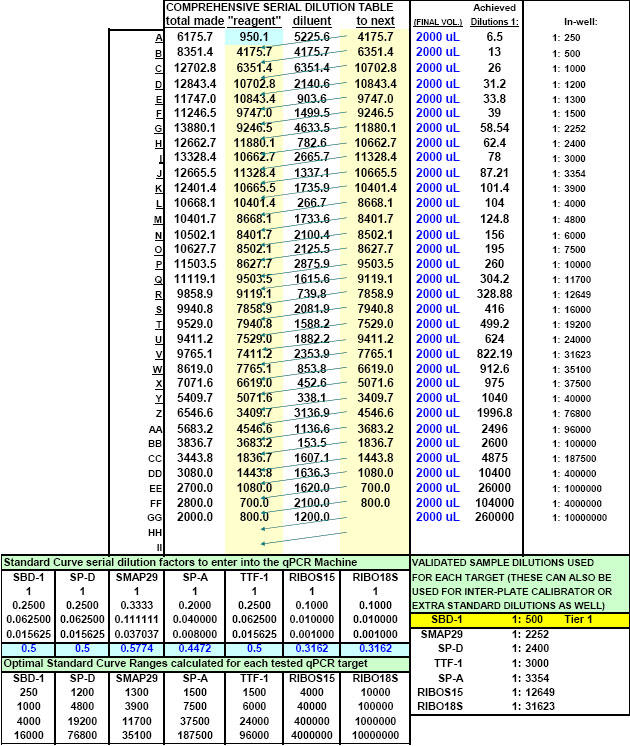
Discussion
Given the meticulous nature of real-time qPCR, it is clear to many who perform this technique that any time-saving device during design and set-up is highly valuable (Figs. 43 and 44). Our own use of the FF2-6-001 tool has saved incredible amounts of time during qPCR set-ups. The development of such a tool became an absolute necessity for us after frequently dealing with as many as sixty samples and seven qPCR targets at a time – for which well-rendered preliminary targets tests and set-up calculations often took several days. With the advent of liquid-handling robot technology (Fig. 45), a marriage between such machines and the FF2-6-001 qPCR set-up tool would be most helpful and indeed welcome in the qPCR world. Addressing qPCR inhibition is of utmost importance toward attaining accurate quantitative data, and it is necessary for all qPCR investigators to be able to clearly demonstrate that they are using their qPCR samples at non-inhibitory concentrations (no matter what the cause of inhibition is). Manuscripts lacking such proof yet espousing accurate qPCR results should be read with caution since qPCR inhibition, in particular, is perhaps the most problematic feature of the assay, and we feel it has not yet been addressed as much as it really should be. We hope that this manuscript serves a role in that regard. As a case in point, what if RNA sample-related one-step real-time qPCR inhibition were to remain uncorrected or unaddressed during routine analysis for H5N1 in infected duck tissues for example (Fig. 46) and, what if studies using Northern analyses to assess gene expression or viral presence produced data which indicated a much higher fold gene expression or viral presence than correlate real-time qPCR studies showed? Such scenarios could be explained on the troubling basis that sample RNA (or cDNA) was not responsibly ascertained to be non-inhibitory to the qPCR assay itself beforehand. This is why it is so important to run a Test Plate using a mixture of some or all of the DNase-treated RNAs (or cDNAs) in an experiment as a Stock I RNA (or cDNA) solution – and test this Stock I for each target (up to 7 targets in our designs) in singlet (to save on master mix) along a dilution profile typically ranging from 1:10-diluted Stock I, on out to 1:1,300,000-diluted Stock I (which translates into a range of 1:38.46 to 1:5,000,000 final in-well sample dilutions). Keeping track of the approximate nanograms of RNA or cDNA per ?l for each sample throughout all procedures (by taking into account all dilutions incurred by each sample since original o.d.260nm readings were performed for each individual RNA) becomes important when trying to identify possible causes of observed inhibitory phenomena based on final in-well sample RNA or cDNA concentrations. In cases where one is using extremely small amounts of total RNA in-well (e.g. as with many housekeeping targets), one has already eliminated inhibition Types 1, 2, 3 and 5 by dilution alone, but, one has not eliminated the possibility that sequence-specific interactions with specific primers and probe for each qPCR target could still be causal agents of inhibition (38). This is complex and has been discussed recently as being tissue-specific as well (1, 2). As yet unknown or unidentified causes of qPCR inhibition (i.e. "Type 6") may indeed abound.
Fig. 43. Typical master mix reaction tube set-up illustrating the often extensive nature of hands-on real-time qPCR.
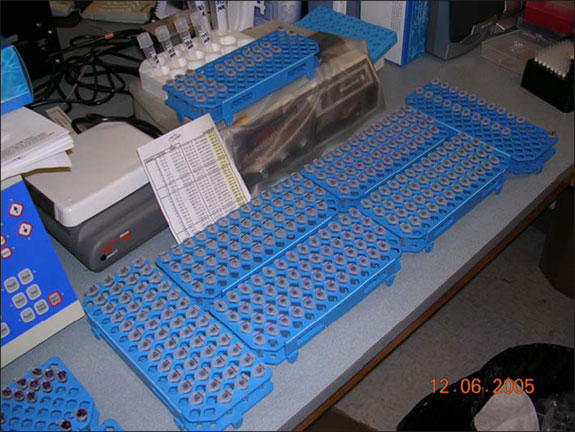
Approximately 260 tubes containing optimally-diluted sample RNAs are not shown here. All tube set-ups were quickly defined by the FF2-6-001 qPCR set-up tool.
Fig. 44. Typical storage of fluorogenic one-step real-time qPCR plates at 4°C before being run.
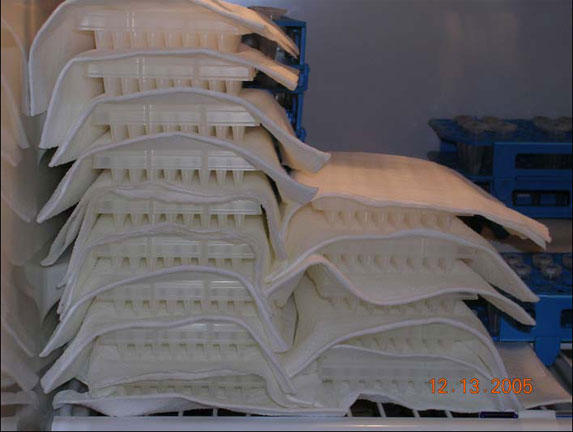
In the example shown here, it took one person 42 hours to run all 14 plates back-to-back. Liquid-handling robot technology has been welcomed in many labs on account of the elaborate, time-consuming set-ups that frequently accompany truly interrogative qPCR. Electronic pipettes can be used otherwise to help shorten set-up time.
Fig. 45. Liquid handling robots represent a god-send to those who would normally set up all qPCR-related tubes and plates by hand.
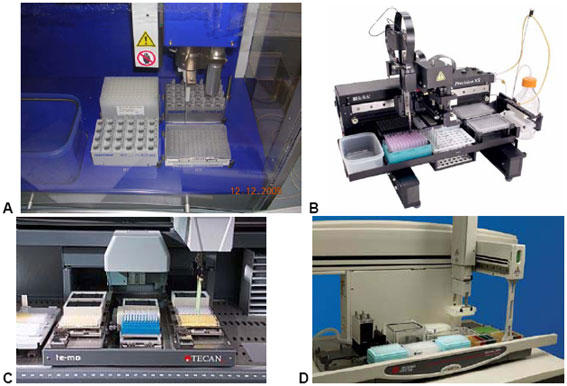
The Eppendorf 5070 (shown) and 5075 (not shown) liquid-handling robots (A), BioTek's PrecisionXSSilo (B), Tecan's Freedom EVO® (C) and Beckman Coulter's Biomek 3000 (D) are all perfect for this application. In the absence of such technology, investigators are urged to at least employ the use of electronic/digital pipettes to make qPCR set-ups less demanding.
Fig. 46. Important example of how viral load in infected samples can be severely underestimated if qPCR inhibition is present but remains unaddressed.
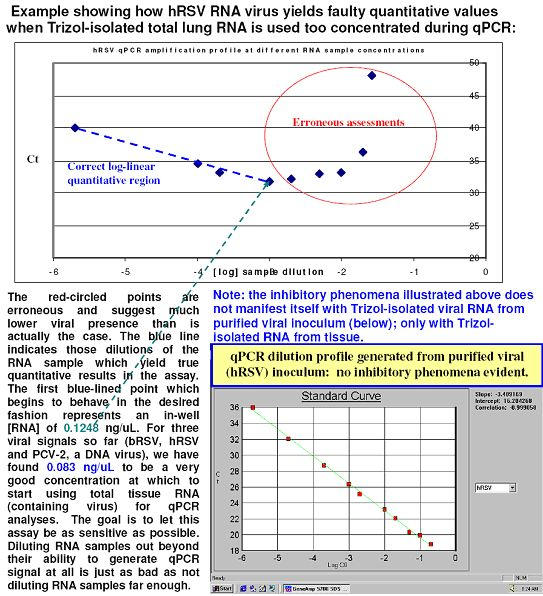
Imagine if the virus in this diagram were a deadly variety of H5N1. The parameters shown above we defined for hRSV using the FF2-6-001 qPCR set-up tool.
Conclusions
In closing, it is important to note that we have crafted the FF2-6-001 qPCR set-up tool to address as many features of qPCR as possible in order that users are able to swiftly attain precise qPCR set-ups specifically tailored to each experiment's unique dynamics. Investigators can speed things along toward meaningful real-time qPCR results in other crucial ways as well by: 1.) using primers and probes that have already been optimized on cDNA and have been shown to be able to generate reliable, high efficiency dilution/calibration/standard curves days or weeks in advance (or one may use 1 ?M primers and 150 nM probe in all cases where primer-probe optimizations have not yet been performed), 2.) identifying the best, sample-specific RNA isolation technique which yields RNA isolates that exhibit the least amount of inhibitory phenomena during qPCR; and sticking with that method while bearing in mind that Trizol® isolation is still the cheapest way to go, 3.) running a Test Plate for all targets of interest using a representative sample or mixture of samples (e.g. Stock I), 4.) analyzing Test Plate results to identify the target-specific dilution ranges within which each different target generates a near-ideal slope (e.g. -3.3219) while exhibiting LOG-linear behavior, then, diluting all samples into these multiple ideal ranges so they can be used for each different target within each target’s confirmed useful dilution range. This not only improves confidence in targets being able to amplify within the proven useful range of their respective standard curves, but also ensures that inhibition of any variety is absent and that high fidelity reactions can be consistently expected – all things which the FF2-6-001 qPCR set-up tool quickly and faithfully calculates, 5.) identifying, validating and using at least two reliable sample-specific housekeepers in each qPCR study, 6.) making sure all nucleic acid samples are treated identically before qPCR (i.e. DNase-treatment conditions, etc.) – including the RNA or DNA used to generate absolute or relative standard curves, and 7.) running standard curves on each and every plate for each target tested – never forget that it is always correct to run standard curves on every plate – for this way, samples and standards both suffer the same degree of reaction efficiency or inefficiency – whichever the case may be, thus allowing one to obtain more precise relative data. For fluorogenic real-time qPCR, our own bias is toward using the hydrolysis probe method in a one-step approach exclusively in all situations since it has the added advantage of being able to use forward and reverse primers to further reinforce the specificity of the fluorogenic probe in target amplifications by acting as 'rooks [primers] guarding the fidelity of the [probe] king’ – making doubly sure that only a highly-specific reaction takes place – especially in cases where one, two, or all three of these players can be designed to span a genomic intron – or introns – or other strategically advantageous regions. MGBNFQ probes allow even more possibilities. And finally, fortunately, it is the nature of PCR to amplify extremely small amounts of starting nucleic acid template material, and our studies have all benefited from this classic feature in that all tissue RNAs isolated for all studies so far (and subsequently diluted appropriately on a target-by-target basis to each of their optimal non-inhibitory, LOG-linear ranges) have exhibited solid target signals. We contend that all Stock I solutions will be useful if they are comprised of the experimental samples involved in each qPCR study. Stock I solutions in and of themselves (by virtue of them being composed of either portions of all the samples in a study, or portions of those samples most expected to contain all qPCR targets of interest) represent self-mitigating/self-attenuating tools already tailored to the specific confines (known and unknown) of each particular qPCR study. A "closed system" is formed this way – a system that by default is allowed to establish its own characteristic dynamic(s) since, by design, it uses the very stuff it is made of in order to study itself.
Appendices
Appendix 1
Final, in-well dilution of sample RNA refers specifically to the dilution that each RNA sample incurs post DNase-treatment by the time it exists in the PCR plate reaction wells. In our lab, for Turbo DNase-treating RNA, we typically use 60 to 80 ?l of RNA sample in each 100 ?l DNase-treatment reaction, which, after inactivation reagent is added, each become 110 ?l – from which 80 ?l of each final DNase-treated RNA sample is recovered. The DNase-treated RNAs are then immediately diluted 1:10 with nuclease-free water (Ambion) and stored at 4°C (not -80°C as commonly suggested). After optimal dilutions for each target (as established by FF-2-6-001-based Test Plate analyses) have been carried out, 7.8 ?l of each optimally-diluted RNA sample is subsequently used in each final 30 ?l qPCR reaction mixture (of which 25 ?l is added to the final 96-well qPCR reaction plates). The in-well dilution of each RNA sample is thus 0.26 in each case. So the most concentrated RNA sample possible (post DNase-treatment, in-well) in our one-step real-time qPCR studies is a 1:38.46-diluted RNA sample (e.g. 0.1 [immediately post-DNase dilution factor] x 0.26 [in-well dilution factor]). But, this dilution is rarely useful as it consistently demonstrates severe qPCR inhibition; no amplification of target signals. Consequently, it is only useful as the sample on Test Plates which most clearly exhibits the stark reality of real-time qPCR inhibitory phenomena (possibly all five types). We routinely use all of our DNase-treated sample RNAs within 6 months and have found most of them to be stable (stored at 4°C) for over three years as real-time qPCR templates (which is highly contrary to the plethora of technical literature which warns against this). We have designed the FF2-6-001 qPCR set-up tool to keep track of all RNA sample dilutions at every step along the way throughout each entire qPCR procedure; from initial RNA spectrophotometer 260nm and 280nm readings on. This feature makes it possible for us to know the ng/?l in-well RNA concentrations for each final target qPCR reaction (see Figures 37 and 38).
Fig. 37. Portion of FF2-6-001 qPCR set-up tool MasterEntrySheet.xls file which shows the final volumes and relative dilutions achieved for all standards and inter-plate calibrators.
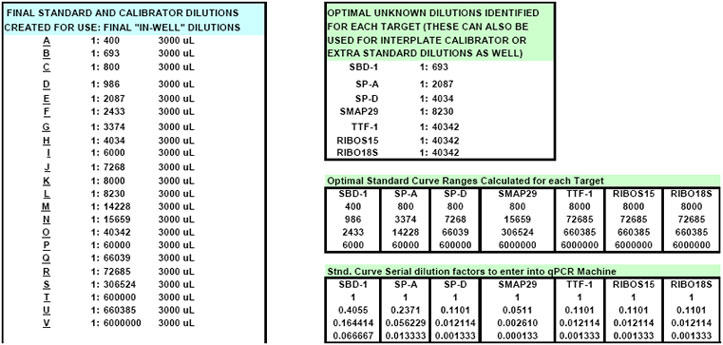
Inter-plate calibrator samples serve an added function as additional standards since they are specifically diluted in each case to appear either between the first two points on each target’s 3- or 4-point standard curve or at any other place within each standard curve (as can all sample unknowns) by using the ‘sample aiming device’ shown in Figure 39. This helps to further define each standard curve and lends more credence to final quantitative analyses. Also shown here are the values one enters directly into the qPCR machine so it knows what serial progressive dilution factors are being used to create each different standard curve.
Fig. 38. Portion of FF2-6-001 qPCR set-up tool MasterEntrySheet.xls file which shows the final in-well ng/?l total RNA concentrations achieved for each different qPCR target tested and how many picograms of total RNA are present in each final reaction well for each particular target.

Appendix 2
Type 4 inhibition is especially difficult to assess or identify when using commercial master mixes since such reagents are restrictive in that they are very rarely altered by investigators before use in qPCR. Mg2+ and dNTP concentrations, along with other corporately undisclosed proprietary components (including passive reference molecules such as "ROX") are assumed to be "optimal" as is – as purchased from the manufacturer. But, as most conventional PCR users know, adjusting Mg2+ concentrations, in particular, has profound effects on the efficacy of PCR reactions in general, and such adjustments to commercial master mixes would undoubtedly influence the kinetics of primer-probe interactions with qPCR target templates. Adjusting, for instance, ABI master mix Mg2+ concentration from 7.5 mM to 5.5 mM has been demonstrated be more appropriate for qPCR amplification of the ubiquitously-abundant 18S ribosomal RNA [housekeeping] transcript (34), but, in practice, most investigators find such adjustments too nebulous or laborious to pursue. The "high-throughput" philosophy of real-time qPCR relies heavily on the existence of immediately-available, ready-to-use, pre-optimized (yet notoriously expensive) reagents, and as a result, the impetus for investigators to manipulate [pre-made] master mix components in effort to study the finer thermodynamic details of primer-probe interactions with real-time qPCR target templates under different conditions (e.g. to more fully explore the nature of Type 4 qPCR inhibition) is diminished in many cases. The reality that many important proprietary components in key reagents can never be openly discussed (for fear of violating copyrights or company privacy policies) ultimately limits the rate at which such questions might be answered.
Appendix 3
Rn, or normalized reporter fluorescence, is the level of fluorescence detected during PCR. Rn is calculated by dividing the reporter signal by the passive internal reference dye, rhodamine-5-carboxy-X (ROX). During PCR, Rn increases as target nucleic acid is amplified until the reaction approaches a plateau. ROX is a proprietary passive internal reference dye that does not participate in the PCR reaction where the "X" in each form of ROX differs from company to company (which is why ROX from different sources does not work the same). ROX emits a constant background fluorescent signal throughout the reaction. If there is a change in the delivered volumes of PCR Master Mix due to pipetting errors or sample evaporation, there will be a change in the intensity of fluorescence produced from the ROX molecule. e.g. if a sample has slightly evaporated – the components in the mixture are more highly concentrated and thus would give off more fluorescent signal per unit volume; this is true not only for ROX, but your target and endogenous reference reactions as well. Most quantitative PCR machines automatically correct for these changes in sample volume by normalizing all signals to ROX. The emission intensity of the target fluorescence signal (the target gene, sequence or message, or endogenous reference signal you are looking for) is divided by the emission intensity of ROX. Theoretically, a perfect plate would contain equal amounts of ROX in every well – but in practice, even well-rendered/executed triplicates can show unacceptable variations in signal intensity, and if this problem is due to master mix addition discrepancies, ROX is used to correct for that (as well as non-PCR-related well-to-well fluctuations in fluorescence). ABI instruments absolutely require ROX to generate CT and Rn values correctly, while BIO-RAD fluorogenic real-time PCR instruments do not. In the absence of ROX, more inconsistent CT and Rn values are expected from the ABI GeneAmp® 5700 Sequence Detection System (according to technical support, ABI). The ability (of the ABI GeneAmp® 5700 Sequence Detection System) to use ROX to normalize for non-PCR-related, well-to-well fluctuations in fluorescence is achieved by using fluorescence readings taken at 95°C in the baseline region, and is apparently "essential" for reproducible results. However, the ABI GeneAmp® 5700 Sequence Detection System cannot differentiate between reporters, TAMRA or ROX dyes, as it uses a total reading of each well. Therefore, there is no normalization by ROX in the ABI GeneAmp® 5700 Sequence Detection System. "However, the background used to calculate the delta Rn value provides more reliable data because of ROX addition" (Justin Liao, ABI technical support). TAMRA-quenched probes do not require an internal reference dye; they can use TAMRA itself (in newer, post ABI GeneAmp® 5700 Sequence Detection System machines, i.e. ABI GeneAmp® Models 7300 and 7500). ROX, TAMRA, FAM, VIC etc., are all measured together on the ABI GeneAmp® 5700 Sequence Detection System; the ROX passive reference normalizing signal is not shown separately; only varying intensities of black and white are measured – not color. Since ABI master mixes contain 300 nM ROX, while Stratagene master mixes are formulated to contain 30 nM ROX (when ROX is used), it is important to note that investigators using ABI master mixes on Stratagene qPCR machines (Mx4000, Mx3000 and Mx3005P) cannot hope to use ROX as an agent for normalizing reporter fluorescence because the ABI ROX signal is simply too strong. This is due to the fact that different amounts [and perhaps kinds] of ROX are optimal for each of the two machines since a different technology is used to measure well to well fluorescence in Stratagene machines as opposed to the 'halogen flood lamp' method employed by ABI.
Appendix 4
It is important to note here that all reverse primer concentrations were increased by at least 200 nM in concentration for all one-step reactions (above what their apparent optimal concentrations were observed to be during initial two-step optimization evaluations; but never above 1 ?M). This is necessary since all reverse primers are utilized to unknown extents during first-strand synthesis in all one-step qPCR processes; the reverse transcription phase of such reactions are not primed by (i.e.) random hexamers, but instead by the sequence-specific reverse primers themselves – thereby limiting reverse primer presence to unknown extents during the final (PCR) phase of each target amplification reaction. In recent experience, we have found that boosting reverse primer concentrations (beyond what two-step primer-probe optimization trials initially indicated) preceding one-step qPCR analyses has improved the overall fidelity of all qPCR target reactions tested so far. Further, we find that using 'saturating concentrations' of primers (1 ?M each) and probe (150 nM) is suitable for all qPCR targets (abundant and rare), especially after responsible preliminary qPCR Test Plate analyses have been performed on all targets beforehand.
Appendix 5
To protect new qPCR assays from carryover contamination by amplicons generated from prior experiments in the same work area, many master mixes (including several ABI master mixes) contain dUTP instead of dTTP in order to take advantage of an enzyme known as "UNG" which destroys all uracil-containing amplicons left over from prior reactions in the same qPCR work area. AmpErase® UNG (ABI) is employed largely for two-step qPCR procedures but not for the particular one-step qPCR procedure we use. UNG cannot be used when one-step qPCR is performed using the TaqMan Gold RT-PCR Kit (ABI) or the TaqMan® One-Step RT-PCR Master Mix Reagents Kit (the master mix we use). UNG enzyme is active at the temperatures used for reverse transcription (48°C) so it would remove uracil bases that are incorporated into newly synthesized complementary DNA (cDNA) strands; all nascent transcripts would be immediately digested by UNG as they are synthesized. The Uracil DNA-Glycosylase enzyme (UDG) also known as 'UNG,' hydrolyzes uracil-glycosidic bonds on single and double stranded dU-containing DNA. Treating pipettes and reaction mixtures with AmpErase® UNG enzyme before each new PCR will destroy any old template containing uracil and therefore prevent re-amplification of carryover PCR products left over in the PCR room that may have drifted into new reaction tubes during set-up; in most cases, using AmpErase® UNG at 1 U/100 µl reaction is sufficient. However, AmpErase UNG can be used to remove prior amplicon contamination in one-step qPCR when using the TaqMan EZ RT-PCR Core Reagents (ABI). The rTth DNA Polymerase contained in the kit is thermally stable and is used at temperatures at which AmpErase® UNG is inactive. Because one-step EZ RT-PCR utilizes dUTP, amplicons generated during this reaction contain uridine residues. Since we cannot use UNG in our one-step master mix, we entirely avoid contaminating our work areas with prior amplicons by bleaching all surfaces before working, and by never pulling the plate cap strips off of any qPCR plates that have already been run.
Appendix 6
Stock I cDNA refers to a cDNA or mixture of selected cDNAs from which it is shown by preliminary, real-time qPCR tests to express positively for all targets of interest to the particular qPCR study at hand. The "1:5" or "1:10" dilutions refer to the chosen dilution of any "full-strength" Stock I cDNA whose original concentration is that which was obtained directly from reverse transcription reaction(s). Typical reverse transcription (or cDNA synthesis) reactions yield approximately 20 ng/?l cDNA when assuming each reaction to be 100% efficient.
Appendix 7
pH-ing RNA storage buffers to between 6.4 and 7.0 (e.g. Ambion Cat. No. 7000, 1 mM sodium citrate solution, ~pH 6.4) helps to minimize 2'-hydroxyl base-catalyzed self-hydrolysis of RNA molecules. DNA (or cDNA) storage buffers are safe at pH 8.0 (e.g. Ambion Cat. No. 9849, TE pH 8.0 or Cat. No. 9856, 1 M Tris, pH 8.0).
Appendix 8
That less secondary structures are allowed to form on shorter freeze-fractured templates, therefore allowing the reverse transcription phase to happen more efficiently, though speculative, is an additional possibility [comment by Dr. Brett Sponseller as relayed to us by Iowa State University Research Associate, Sandra K. Clark].
Appendix 9
In 2005, we assisted Invitrogen in the creation of a new master mix for use exclusively with very small RNA samples from cells – including LCM-derived RNA isolates used in one-step real-time qPCR. To answer questions as to whether or not LCM-derived RNA was stable after freeze-thawing, and whether or not directly-extracted total cellular contents could be used in one-step real-time qPCR applications, we were invited to help Invitrogen develop this master mix based on an already-existent product line of theirs: CellsDirect™. This endeavor consisted of an effort between us and key Invitrogen personnel: Sharon Lahn, Ginger Lucero M.F.S. and Dr. Wolfgang Kusser, and resulted in the formulation of the Invitrogen product: CellsDirect™ One-Step RT-PCR Kit, Part No. 46-7201 (16, 35, and see also Fig. 47).
Fig. 47. Chart showing the advantage of using the CellsDirect™ One-Step RT-PCR Kit, Cat. No. 46-7201 product instead of conventional column-based RNA purification methods.
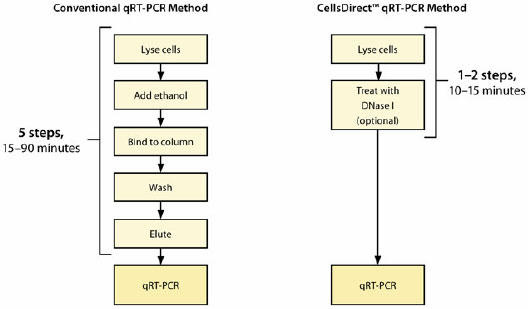
This [new] product adheres to the "high throughput" philosophy of real-time qPCR by shortening the time it takes investigators to obtain qPCR-compatible cell lysates. Real-time qPCR inhibition is effectively eliminated from LCM-derived samples isolated using this method.
Appendix 10
Use of pentadecamers (26) should now replace the use of random octamers (as suggested by Invitrogen) or random hexamers (as suggested by ABI) to prime reverse transcription reactions, especially reactions which aim to reverse transcribe 18S ribosomal RNA in addition to mRNA. Since 18S ribosomal RNA transcripts have no poly(A) tails (like histone-encoding mRNAs), it is summarily inappropriate for investigators to use poly(dT) constructs to prime reverse transcription reactions for it. Use of poly(dT) would not allow 18S ribosomal RNA transcripts to be effectively transcribed during reverse transcription (although a small amount will always be reverse transcribed into cDNA because of normal, expected low-level RT mis-priming events; Trish at ABI Technical Services). Further, improving cDNA yields from reverse transcription reactions can of course enhance qPCR detection of rare targets. Many companies (including Invitrogen, Stratagene and ABI) offer RT enzymes which function at temperatures above 48°C (i.e. from 50 up to 60°C). Higher reverse transcription temperatures serve to limit thermodynamically-favorable-yet-troublesome formations of common secondary RNA structures (e.g. hairpin loops, hammerhead formations, sticky complementary regions etc.) thereby making it easier for RT enzymes to stay on RNA transcripts longer in order to produce fuller-length cDNAs. 'RNase H status' of each different RT enzyme is also a feature which companies alter according to needs of investigators. The RNase H activity of RT enzymes functions to degrade sample RNA as soon as it is used as template for cDNA synthesis. But, since most qPCR amplicons average 100 bp, while an RNase H-RT enzyme (an RT enzyme lacking RNase H activity) can provide an advantage when synthesizing long cDNA products, it does not provide a similar advantage for the shorter amplicon regions such as those amplified by real-time qPCR. In fact, RNase H-RT can limit the sensitivity of qPCR detection. If RNA template is not degraded after first-strand cDNA synthesis, it can complementarily bind to the newly-synthesized cDNA and restrict its accessibility to complementary primers and probes during subsequent PCR amplification. RNase H+ mediated destruction of template RNA can prevent this problem and improve the sensitivity of qPCR analysis. On another front, Promega corporation reminds us that adding more units (U) of RT enzyme per unit volume reverse transcription reaction allows the reactions to be skewed in favor of reverse transcribing 'mRNAs' instead of the normally, dominantly-transcribed, 18S ribosomal RNA. Rarer targets can be more efficiently reverse transcribed into cDNA this way; Promega technical notes suggest the use of 3.125 U/?l for reverse transcription instead of 1.25 U/?l in this regard. Finally, it is important to keep in mind that any tampering with RNA isolates (including linear amplification, method of reverse transcription, freeze-thawing, etc.) always invites the risk of skewing original RNA profiles away from what they originally were. And this, in turn, can greatly affect real-time qPCR results.
Appendix 11
A little-known tertiary dynamic of qPCR is that normalization of target values by endogenous housekeeper values is most precise when the CT values for both appear within the same cycle range (Trish, ABI technical support). In other words, sample RNA and cDNA, when used to assess endogenous housekeeping transcripts by qPCR, should be diluted such that the resulting amplifications cross threshold (generate CT values) within the same region that the target amplifications do. The hyper-abundant endogenous housekeeper, 18S ribosomal RNA, often requires sample RNA or cDNA dilutions of 1:4,000 or higher (up to 1:10,000) before its CT values appear within (or at least much nearer) most other target CT ranges. Reducing amount of probe (and sometimes primers) for such strong signals reduces the voracity at which they amplify (a common practice in multiplex qPCR to prevent robustly-expressed target amplifications from exhausting master mix dNTPs before less abundant target transcript amplifications are able to use them) and provides another way for single-plex real-time qPCR users to influence CT values of any target or housekeeper. By reducing the amplification efficiency (E) of certain target or housekeeper amplifications (e.g. by limiting probe amounts) so that they yield CT values more in keeping with other target or housekeeper CT values, one theoretically obtains better relative quantitative qPCR data.
Appendix 12
Given the following assumptions that: 1.) typical eukaryotic cells contain about 20 pg of total RNA, that 2.) 83% of total cellular RNA is ribosomal RNA (28S, 18S, 5.8S and 5S rRNA), 15% is transfer (tRNA), 2% is messenger RNA (mRNA), that 3.) 24% of all rRNA is 18S rRNA, that 4.) the average eukaryotic mRNA size is ~2000 bases, and that 5.) the average nucleotide MW = 330 g/mole, one can calculate (using Avagadro's number as 6.02214199 x 10²³ transcripts/mole) that there are roughly 360,000 total mRNA transcripts per cell at any given moment. Further, if one assumes that ~25,000 differently-encoded mRNAs co-exist at any time, one can calculate that there are about 105.4 more 18S rRNA transcripts present than there are of any specific type of target mRNA (using a MW of 624 kDa for the human 18S rRNA transcript based on NCBI Accession #M10098). This clearly explains why 18S rRNA often generates real-time qPCR CT values up to 18 cycles earlier than most other mRNA targets, and why RNA samples must be diluted so extensively in order to measure 18S RNA signal appropriately by qPCR. Other endogenous redundantly-copied housekeeping genes also exhibit relatively earlier-appearing CT values, but none so dramatic as 18S rRNA.
Appendix 13
The representative RNA to be used as template on the Test Plate should be a mixture of only those sample RNAs in any given experiment which are reasonably expected to contain all the real-time targets of interest in the study. Including RNA samples which are not expected to contain one or all of the targets of interest serve only to dilute the RNA mixture away from its usefulness on the Test Plate. Using a mixture of the experimental (1:10 pre-diluted) RNAs themselves also controls for RNA sample preparation within the experiment itself – eliminating errors that can be introduced by using an experimentally exogenous source of Test Plate or standard curve RNA prepared differently from the way the experimental sample RNAs have been. We have found it to be extremely imperative that one use a mixture of the experimental sample RNAs themselves not only as template for the Test Plate, but also as the source of template from which all standard curves and inter-plate calibrators (inter-plate calibrators we use as an extra standard sample or as a sample placed on multiple plates in order to ascertain the fidelity of amplification among multiple plates in cases where data from one plate is to be compared with data from another) for the entire experiment are prepared. This illustrates the critical need for one to think ahead during extensive qPCR studies in order that one does not run short on such important template mixtures at some unforeseen point (the FF2-6-001 qPCR set-up tool calculates this parameter as well). We call such RNA mixtures "Stock I." Our typical Stock I RNA solutions vary in size from 600 ?l to 1,500 ?l depending on how many Test Plates, final qPCR sample plates (using standard curves and inter-plate calibrators), and NRC plates each study requires. We strongly advise investigators to create drawings of all the plates to be run in each qPCR study and use them to manually confirm how much Stock I RNA (or cDNA) and how much of each sample RNA (or cDNA) will be needed. These values are also calculated by the FF2-6-001 qPCR set-up tool, but it is always good for the investigator to cross-corroborate these calculations since it is easy for users to unknowingly introduce logistical mistakes during extensive qPCR set-ups.
Appendix 14
Table 1.
Successful primer and TaqMan® probe designs. Primer-probe sets which have yielded favorable qPCR amplifications using parameters identified by the FF2-6-001 qPCR set-up tool invention. 6FAM or VIC = 5' Fluorescent reporter dye, TAMRA = 3' Fluorescent quencher dye. MGBNFQ = 3' Minor groove binding non-fluorescent quencher.
| Ovine (Ovis aries) studies: Caverly-Grubor-Derscheid-Meyerholz-Lazic-Olivier-Gallup-Ackermann | ||
| SBD-1 | Fwd primer: 5'CCATAGGAATAAAGGCGTCTGTG Rev primer: 5'-CGCGACAGGTGCCAATCT |
Probe: 5'-6FAM-CCGAGCAGGTGCCCTAGACACATGA-TAMRA Designed by us using ABI Prism Primer Express™ v2.0 and accession #U75250 |
| ovTTF-1 | Fwd primer: 5’-TCCCAGGCGCAGGTGTAT Rev primer: 5’-CGGACAGGTACTTCTGCTGCTT |
Probe: 5’-6FAM- AGCTGGAGCGACGCT-MGBNFQ Designed by us using ABI Prism Primer Express™ v2.0 and accession #DQ010920 |
| ovSP-A | Fwd primer: 5’-TGACCCTTATGCTCCTCTGGAT Rev primer: 5'-GGGCTTCCAAGACAAACTTCCT |
Probe: 5’-6FAM-TGGCTTCTGGCCTCGAGTGCG-TAMRA Designed by us using ABI Prism Primer Express™ v2.0 and accession #AF076633 |
| ovSP-D | Fwd primer: 5’-ACGTTCTGCAGCTGAGAAT Rev primer: 5’-TCGGTCATGCTCAGGAAAGC |
Probe: 5’-6FAM-TTGACTCAGCTGGCCACAGCCCAGAACA-TAMRA Designed by us using ABI Prism Primer Express™ v2.0 and accession #AJ133002 |
| ovICAM-1 | Fwd primer: 5’-CAAGGGCTGGAACTCTTCCA Rev primer: 5’-GGTCGATGGCAGGACATAGG |
Probe: 5’-6FAM-CACCTCAGCCCCCAGGAAGCTCC-TAMRA Designed by us using ABI Prism Primer Express™ v2.0 and accession #NM001009731 |
| SMAP29 | Fwd primer: 5’- GGCCCAACTGTTCTCCGAAT Rev primer: 5’- GCAGACCCTTAGGACTCTTTCCT |
Probe: 5’-6FAM-ATCAGAATAGCTGGGTGAATTGTGGGCC-TAMRA Designed by us using ABI Prism Primer Express™ v2.0 and accession #L46854 |
| ovRPS15 | Fwd primer: 5’-CGAGATGGTGGGCAGCAT Rev primer: 5’-GCTTGATTTCCACCTGGTTGA |
Probe: 5’-VIC-CCGGCGTCTACAACGGCAAGACC-TAMRA Designed by us using ABI Prism Primer Express™ v2.0 on a sequence given to us courtesy of Dr. Sean W. Limesand, Dept. of Pediatrics, Univ. of Colorado Health Sciences Center, Perinatal Research Center, PO Box 6508, F441, Aurora, CO (see also refs. 16 and 19) |
| *hRIBO18S | Fwd primer: 5’-CGGCTACCACATCCAAGGAA Rev primer: 5’-GCTGGAATTACCGCGGCT |
Probe: 5’-VIC-TGCTGGCACCAGACTTGCCCTC-TAMRA Designed by ABI using accession #XO3205 *This primer-probe set is a theoretically faulty thermodynamic design, but it still works very well. See reference (34) for more information. |
| bRSV | Fwd primer: 5’- CAGTCAAGAATATTATGCTTGGTCATG Rev primer: 5’- CCTAACTTTTGTGCATATTCATAGACTTC |
Probe: 5’-6FAM-CAACCTGTTCCATTTCTGCTTGTACGCTG-TAMRA Designed by us using ABI Prism Primer Express™ v2.0 and accession #NC_001989 |
| hRPS15 | Fwd primer: 5’-CCTTCAACCAGGTGGAGATCA Rev primer: 5’-CATGCTTTACGGGCTTGTAGGT |
Probe: 5’-VIC-CCGAGATGATCGGCCACTACCTGG-TAMRA Designed by us using ABI Prism Primer Express™ v2.0 and accession #BC105810 |
| Equine (Equis caballus) studies: (Clark-Sponseller) | ||
| Equine IL-10 | Fwd primer: 5'-GATCTCCCAAATCCCATCCA Rev primer: 5'-AGGAGAGAGGTACCACAGGGTTT |
Probe: 5'-6FAM-CCAAGGAGCTGATTCAGCTCTCCCAGAA-TAMRA Designed by us using ABI Prism Primer Express™ v2.0 and accession #U38200 |
| Equine IL-12 p40 | Fwd primer: 5’-GGCCAGATCCGTGTCCAA Rev primer: 5’-GGATACGGATGCCCATTCG |
Probe: 5’-6FAM-CCAGGGACCGCTACTACAGCTCATCCT-TAMRA Designed by us using ABI Prism Primer Express™ v2.0 and accession #Y11129 |
| Equine GA3PDH | Fwd primer: 5’-CCCACCCCTAACGTGTCAGT Rev primer: 5’-TCTCATCGTATTTGGCAGCTTTC |
Probe: 5’-6FAM-TGGATCTGACCTGCCGCCTGG-TAMRA Designed by us using ABI Prism Primer Express™ v2.0 and accession #AF157626 |
| Chicken (Gallus gallus) studies: (Brockus-Harmon-Gallup-Ackermann) | ||
| Gallinacin 1 | Fwd primer: 5’- GGAAGGAAGTCAGATTGTTTTCGA Rev primer: 5’-GAGCATTTCCCACTGATGAGAGT |
Probe: 5’-6FAM-AGAGTGGCTTCTGTGCATTTCTGAAGTGC-TAMRA Designed by us using ABI Prism Primer Express™ v2.0 and accession #AF033335 |
| Gallinacin 2 | Fwd primer: 5’-GGAGGGTCCTGCCACTTTGRev primer: 5’-CGGAACCCGAAGCAGCTT | Probe: 5’-6FAM-AGGGTGTCCCAGCCATCTAATCAA-TAMRA Designed by us using ABI Prism Primer Express™ v2.0 and accession # AF033336 |
| Chicken 18S rRNA | Fwd primer: 5’- CCATGGTGACCACGGGTAACRev primer: 5’-GGATGTGGTAGCCGTTTCTCA | Probe: 5’-VIC-CCCTCTCCGGAATCGAACCCTGATT-TAMRA Designed by us using ABI Prism Primer Express™ v2.0 and accession #AF173612 |
Figures
Fig. 12. Portion of FF2-6-001 qPCR set-up tool MasterEntrySheet.xls file (Sheet 1) where the user enters all sample o.d.260nm readings and selects (using an "x") which samples are to be used in the creating the Stock I solution for the entire study.
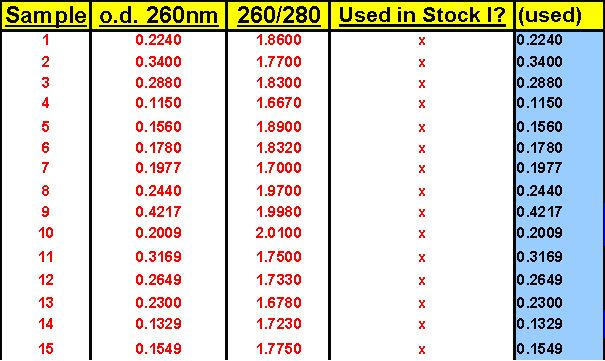
Fig. 13. Key portion of FF2-6-001 qPCR set-up tool MasterEntrySheet.xls file (Sheet 1) wherein the user enters numerous other numerically descriptive parameters which define the particular qPCR set-up and/or approach being pursued.
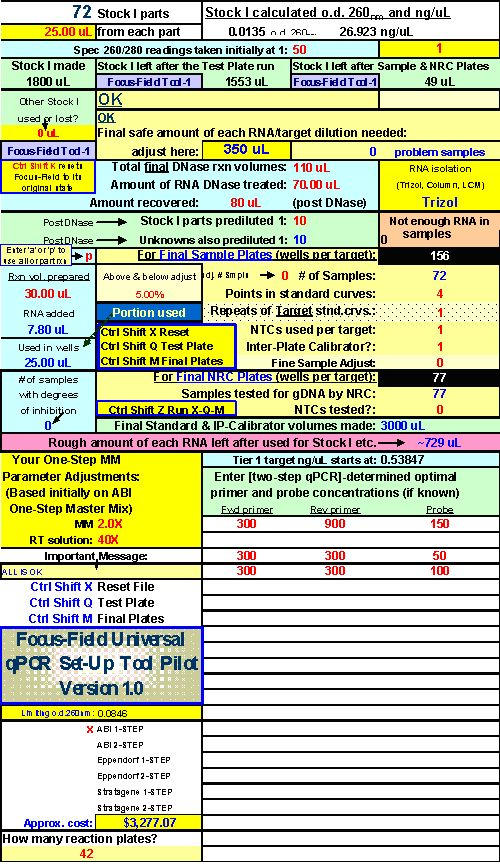
Fig. 14. Portion of FF2-6-001 qPCR set-up tool MasterEntrySheet.xls file (Sheet 2) wherein the file system can be used to help the user calculate how much of each standard, inter-plate calibrator and sample will be needed to successfully complete the entire study at hand without running out of one, some or all of them.
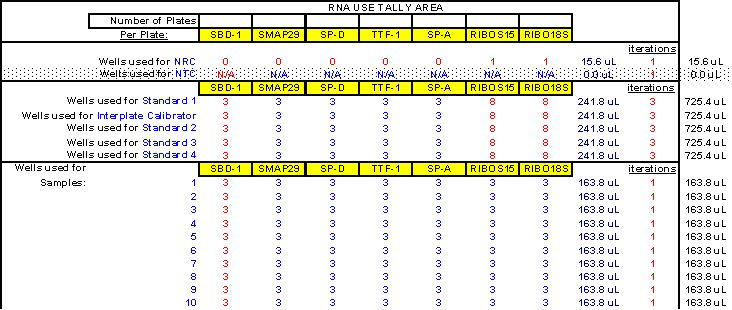
Fig. 15. Portion of FF2-6-001 qPCR set-up tool MasterEntrySheet.xls file (Sheet 3) which automatically calculates the required amounts needed of all samples, standards and inter-plate calibrators based on what the user has already entered in the portions of the MasterEntrySheet.xls file depicted in Figures .
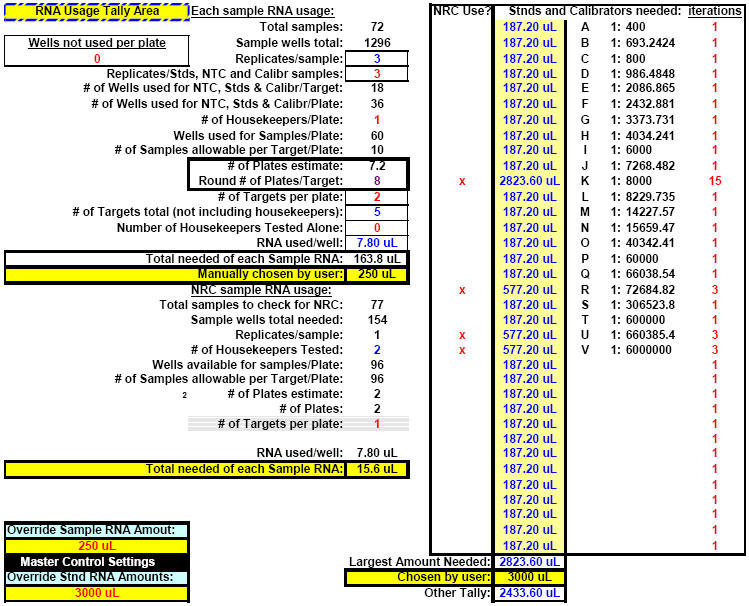
Fig. 16. Portion of FF2-6-001 qPCR set-up tool MasterEntrySheet.xls file (Sheet 1) which allows the user to define Test Plate parameters (and correct master mix usage), Sample Plate parameters (and correct master mix usage), and NRC Plate parameters (and correct master mix usage).
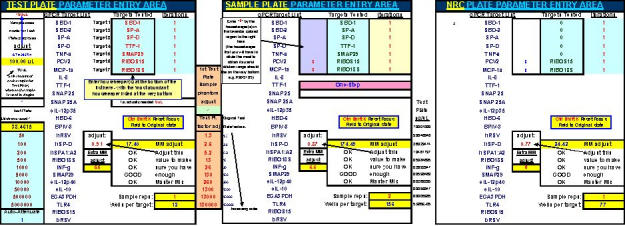
Fig. 21. Close up of the portion of FF2-6-001 qPCR set-up tool MasterEntrySheet.xls file (Sheet 1) used for adjusting final NRC Plate parameters (as also shown in Fig.
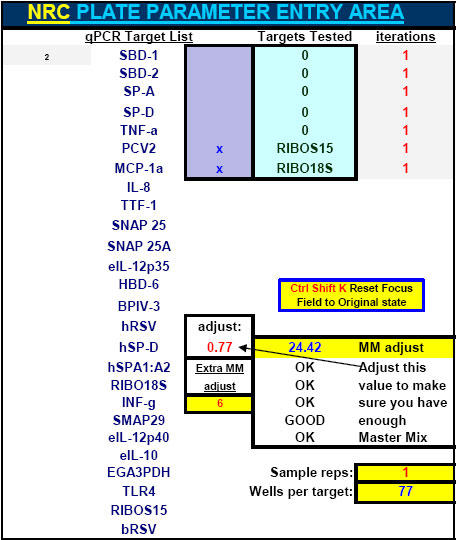
16).
Fig. 24. FF2-6-001 qPCR set-up tool TestPlateResultsAnalysis2006.xls file just after Test Plate CT values have been entered and preliminary macros have been run.
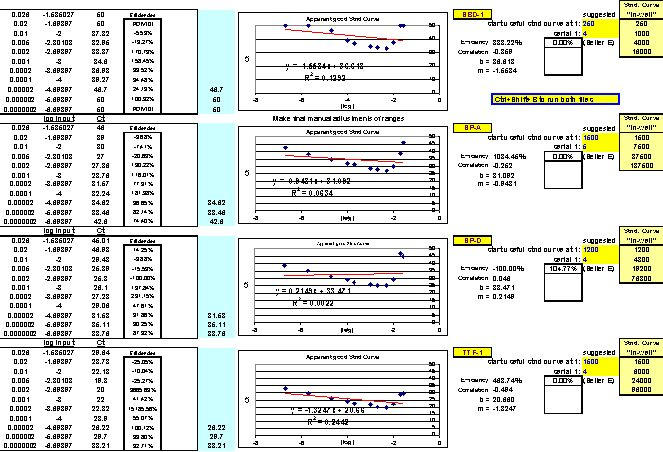
Notice how the regions of qPCR inhibition are clearly exposed for each qPCR target at the right hand side of each target's dilution profile (LOG10 of Stock I dilution vs. CT) graph. The most concentrated RNA samples in each case are the samples which exhibit the most qPCR inhibitory phenomena.
Fig. 25. Optimal ranges identified for all targets using the FF2-6-001 qPCR set-up tool TestPlateResultsAnalysis2006.xls file (which is connected by Visual Basic macros and equations to its "twin" file, TestPlateResultsAnalysis2006b.xls, which is used to fine-tune the parameters revealed by this file).
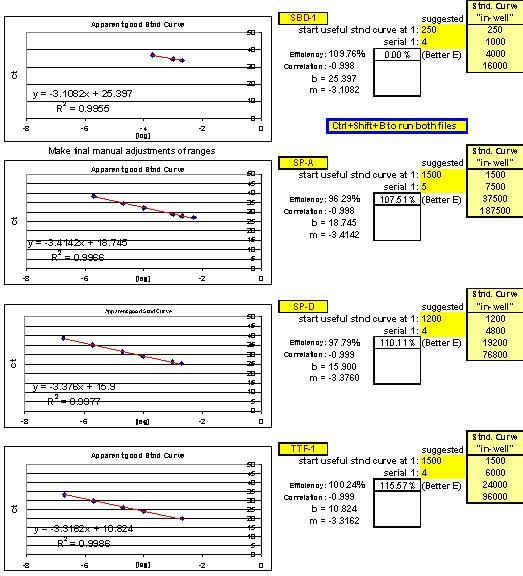
Efficiencies and slopes for each target are calculated from Test Plate CT values for each qPCR target as the user manually selects different points on each graph in effort to ascertain the optimal RNA dilution ranges for each target.
Fig. 26. Close up of a region of the FF2-6-001 qPCR set-up tool TestPlateAnalysis2006.xls file which is used to detect qPCR inhibition, dial in a target's optimal RNA dilution range, and find the Stock I RNA dilution range which yields the highest efficiency reaction for each qPCR target.

Here, qPCR target SMAP29 has been assessed.
Fig. 30. Portion of the FF2-6-001 qPCR set-up tool TestPlateResultsAnalysis2006b file which allows the user to fine-tune the parameters already established by "twin" file TestPlateResultsAnalysis2006.
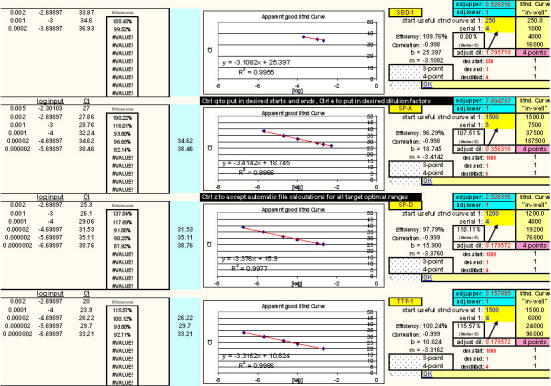
In this file, the user manually adjusts standard curve dilution factors, standard curve start and end points (or chooses to accept file default calculations for those parameters), and activates pre-programmed macros to quickly hone in on the final optimal RNA dilution range to be used for each target – all of which exhibit LOG-linear behavior, lack of qPCR inhibition and high amplification reaction efficiencies; all based on Test Plate CT analyses.
Fig. 32. Portion of FF2-6-001 qPCR set-up tool MasterEntrySheet.xls file (Sheet 2) which confirms for the user how much of each RNA dilution will be prepared for each optimal dilution range for each target investigated.

Fig. 33. Portion of FF2-6-001 qPCR set-up tool MasterEntrySheet.xls file (Sheet 2) which shows the automatically-calculated master mix set-ups for all final target Sample Plates.
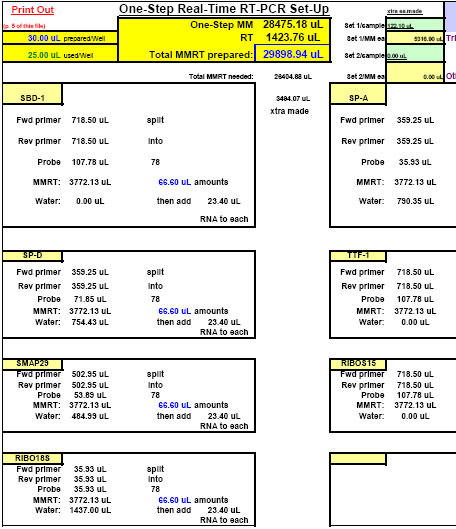
ABI Cat. No. 4309169, TaqMan® One-Step RT-PCR Master Mix Reagents Kit and the ABI GeneAmp® 5700 Sequence Detection System were used here. All master mix calculation files automatically figure in safe extra preparative amounts so the user will not run short on final volumes or run into bubbles at the bottom of sample tubes.
Fig. 36. Portion of FF2-6-001 qPCR set-up tool MasterEntrySheet.xls file which informs the user of the qPCR dynamic range tested and whether or not inhibition can be expected of RNA samples during amplification.
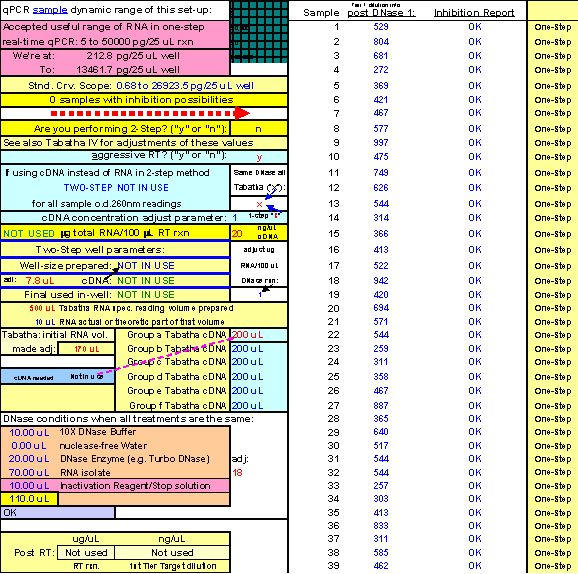
This is also the region where investigators tell the system whether two-step or one-step real-time qPCR is being performed. In two-step real-time qPCR applications, ten other Excel files are activated which all function to correctly handle cDNA preparation and its subsequent use in qPCR as managed by the FF2-6-001 qPCR set-up tool. These ten other files (known collectively as "Tabatha IV") are not discussed in this manuscript.
Acknowledgments
This work was supported by NIH NIAID Awards 5R01AI062787-02 and 5K08AI055499-03, USDA/CSREES/NRI-CGP 2003-35204-13492, and the J.G. Salsbury Endowment. The authors would like to thank James M. Gallup for his invaluable parallel insights from a keen design/engineering perspective regarding the philosophy of invention, logical protocol and the nature of closed systems. A well-spring of long-overdue thanks goes out to Mary Hull and Nancy Hanna for their professional support and their expert assistance in finalizing the ordering of the reagents and machines for all projects (including this one) undertaken by our department over the past two decades. At the helm of support for us is Dr. Claire B. Andreasen who has been the guiding human force which has enabled our particular department to remain intact and highly productive under her chairwomanship. We also thank Sandra K. Clark for allowing us to gain more insight into the behavior of real-time qPCR assays which use column-isolated RNA from macrophages and dendritic cells; we as well thank Dr. Brett Sponseller for creating and funding that important work. We thank Dr. Branka Grubor for her previous work with us on these very things, her expertise, her positive support of all individuals involved, and for bringing to us Tatjana Lazic (and therefore Dr. Milan Matic) to help our innate immunity research group. We thank Tatjana Lazic for providing us with additionally valuable sheep tissue and cell culture samples. We extend a special thank you to the very gracious Dr. Milan Matic for spanning the oceans to lend us his expertise and his unselfish love for the arts of surgery and medicine. We thank Dr. David K. Meyerholz for his insightful research, his medical, surgical and pioneering academic gifts, and for providing us with many of the experimental samples we have used in our studies. We additionally thank Alicia Olivier for her work on real-time one-step qPCR for hRSV. We also thank Pam Knake, Jennifer S. Christensen, James A. DeGraaff and Kari Loehndorf for their assistance with crucial IHC and qPCR lab procedures. We sincerely thank Dr. Douglas E. Jones, Dr. Jeffrey K. Beetham, Dr. Gary Polking and Jon Mlocek for providing us with the qPCR machines on which we have generated our data. We would also like to thank Invitrogen, Applied Biosystems, Stratagene (Lisa Thompson and Dr. Daniel Schoeffner), Eppendorf (Jason Lockefeer), Ambion and Arcturus for providing such excellent products and technical support throughout our studies over the past several years. Most of all, we thank our parents, our wives, and our children.
References
- Tichopad A, Didier A, Pfaffl MW. Inhibition of real-time RT–PCR quantification due to tissue-specific contaminants. Molecular Cellular Probes. 2004;18:45–50. doi: 10.1016/j.mcp.2003.09.001. [DOI] [PubMed] [Google Scholar]
- Bustin SA. A-Z of Quantitative PCR. Bustin SA, editor. (IUL Biotechnology, No. 5), 1st ed. International University Line; August 2004. 882 pages.
- Wilson IG, Gilmour A, Cooper JE. Detection of toxigenic microorganisms in foods by PCR. In: Kroll RG, Gilmour A, Sussman M, editors. New Techniques in Food and Beverage Microbiology. London: Blackwell; 1993. pp. 163-172.
- Starnbach MN, Falkow S, Tomkins SL. Species-specific detection of Legionella pneumophila in water by DNA amplification and hybridization. Journal of Clinical Microbiology. 1989;27:1257–1261. doi: 10.1128/jcm.27.6.1257-1261.1989. [DOI] [PMC free article] [PubMed] [Google Scholar]
- Wilson IG. Inhibition and facilitation of nucleic acid amplification. Applied and Environmental Microbiology. 1997;63:3741–3751. doi: 10.1128/aem.63.10.3741-3751.1997. [DOI] [PMC free article] [PubMed] [Google Scholar]
- Rossen L, Norskov P, Holmstrom K, Rasmussen FO. Inhibition of PCR by components of food sample, microbial diagnostic assay and DNA-extraction solutions. International Journal of Food Microbiology. 1992;17:37–45. doi: 10.1016/0168-1605(92)90017-W. [DOI] [PubMed] [Google Scholar]
- Tichopad A, Pfaffl MW, Didier A. Tissue-specific expression pattern of bovine prion: quantification using real-time RT–PCR. Molecular and Cellular Probes. 2003;17:5–10. doi: 10.1016/S0890-8508(02)00114-7. [DOI] [PubMed] [Google Scholar]
- Pfaffl MW, Lange IG, Daxenberger A, Meyer HH. Tissue-specific expression pattern of estrogen receptors (ER): quantification of ER alpha and ER beta mRNA with real-time RT–PCR. Acta Pathologica Microbiologica et Immunologica Scandinavica. 2001;109:345–355. doi: 10.1034/j.1600-0463.2001.090503.x. [DOI] [PubMed] [Google Scholar]
- Rijpens NP, Jannes G, Van Asbroeck M, Rossau R, Herman LMF. Direct detection of Brucella spp. In raw milk by PCR and reverse hybridization with 16S–23S rRNA spacer probes. Applied Environmental Microbiology. 1996;62:1683–1688. doi: 10.1128/aem.62.5.1683-1688.1996. [DOI] [PMC free article] [PubMed] [Google Scholar]
- Thellin O, Zorzi W, Lakaye B, De Borman B, Coumans B, Hennen G, Grisar T, Igout A, Heinen E. Housekeeping genes as internal standards: use and limits. Journal of Biotechnology. 1999;75:291–295. doi: 10.1016/S0168-1656(99)00163-7. [DOI] [PubMed] [Google Scholar]
- Schmittgen TD, Zakrajsek BA. Effect of experimental treatment on housekeeping gene expression: validation by real-time, quantitative RT–PCR. Journal of Biochemical and Biophysical Methods. 2000;20:69–81. doi: 10.1016/S0165-022X(00)00129-9. [DOI] [PubMed] [Google Scholar]
- Suzuki T, Higgins PJ, Crawford DR. Control selection for RNA quantitation. BioTechniques. 2000;29:332–337. doi: 10.2144/00292rv02. [DOI] [PubMed] [Google Scholar]
- Lee J, Duncan A, Warrick S. Techniques for optimizing RT-PCR reactions. PharmaGenomics. 2003;JANUARY:50–55. [Google Scholar]
- Invitrogen Life Technologies TRIzol® Reagent product literature/insert. Cat. No. 15596-026, Form No. 18057N.
- Invitrogen Life Technologies Instruction Manual. SuperScript III CellsDirect cDNA Synthesis System (for Catalog Nos. 18080-200 and 18080-300) Version B, 25-0731 18 April 2005; 2. & Instruction Manual: SuperScript™ III CellsDirect, cDNA Synthesis System Catalog Nos. 18080-200 and 18080-300, Version A, 14 May 2004, 25-0731, page vi).
- Gallup JM, Kawashima K, Lucero G, Ackermann MR. New quick method for isolating RNA from laser captured cells stained by immunofluorescent immunohistochemistry; RNA suitable for direct use in fluorogenic TaqMan one-step real-time RT-PCR. Biol Proced Online. 2005;7:70–92. doi: 10.1251/bpo107. [DOI] [PMC free article] [PubMed] [Google Scholar]
- Caverly JM, Diamond G, Gallup JM, Brogden KA, Dixon RA, Ackermann MR. Coordinated Expression of Tracheal Antimicrobial Peptide and Inflammatory Response Elements in the Lungs of Neonatal Calves and with Acute Bacterial Pneumonia. Inf Immun. 2003;71(5):2950–2955. doi: 10.1128/IAI.71.5.2950-2955.2003. [DOI] [PMC free article] [PubMed] [Google Scholar]
- Meyerholz DK, Gallup JM, Grubor BM, Evans RB, Tack BF, McCray PB Jr, Ackermann MR. Developmental expression and distribution of sheep b-defensin-2. Dev Comp Immun. 2004;28:171–178. doi: 10.1016/S0145-305X(03)00105-8. [DOI] [PubMed] [Google Scholar]
- Grubor BM, Gallup JM, Meyerholz DK, Crouch EC, Evans RB, Brogden KA, Lehmkuhl HD, Ackermann MR. Enhanced Surfactant Protein and Defensin mRNA Levels and Reduced Viral Replication during Parainfluenza Virus Type 3 Pneumonia in Neonatal Lambs. CDLI. 2004;11(3):599–607. doi: 10.1128/CDLI.11.3.599-607.2004. [DOI] [PMC free article] [PubMed] [Google Scholar]
- Ackermann MR, Gallup JM, Zabner J, Evans RB, Brockus CW, Meyerholz DK, Grubor B, Brogden KA. Differential expression of sheep beta-defensin-1 and -2 and interleukin 8 during acute Mannheimia haemolytica pneumonia. Microbial Pathogenesis. 2004;37:21–27. doi: 10.1016/j.micpath.2004.04.003. [DOI] [PubMed] [Google Scholar]
- Meyerholz DK, Grubor B, Fach SJ, Sacco RE, Lehmkuhl HD, Gallup JM, Ackermann MR. Reduced Clearance of Respiratory Syncytial Virus in a Preterm Lamb Model. Microbes and Infection. 2004;6(14):1312–1319. doi: 10.1016/j.micinf.2004.08.006. [DOI] [PMC free article] [PubMed] [Google Scholar]
- Meyerholz DK, Grubor B, Gallup JM, Lehmkuhl HD, Anderson RD, Lazic T, Ackermann MR. Adenovirus-Mediated Gene Therapy Enhances Parainfluenza Virus 3 Infection in Neonatal Lambs. J Clin Micro. 2004;42(10):4780–4787. doi: 10.1128/JCM.42.10.4780-4787.2004. [DOI] [PMC free article] [PubMed] [Google Scholar]
- Kawashima K, Meyerholz DK, Gallup JM, Grubor B, Lazic T, Lehmkuhl HD, Ackermann MR. Differential expression of ovine innate immune genes by preterm and neonatal lung epithelia infected with respiratory syncytial virus. Viral Immunology. 2006;19:316–323. doi: 10.1089/vim.2006.19.316. [DOI] [PMC free article] [PubMed] [Google Scholar]
- Meyerholz DK, Kawashima K, Gallup JM, Grubor B, Ackermann MR. Expression of select immune genes (surfactant proteins A and D, sheep beta defensin, and toll-like receptor 4) by respiratory epithelia is developmentally regulated in the preterm neonatal lamb. Dev Comp Immunol. 2006;30(11):1060–1069. doi: 10.1016/j.dci.2006.01.001. [DOI] [PMC free article] [PubMed] [Google Scholar]
- TaqMan® Universal PCR Master Mix Protocol. Applied Biosystems, 2002, Printed in the USA, 04/2002, Part Number 4304449 Rev. C.
- Stangegaard M, Hufva IH, Dufva M. Reverse transcription using random pentadecamer primers increases yield and quality of resulting cDNA. BioTechniques. 2006;40(5):649–657. doi: 10.2144/000112153. [DOI] [PubMed] [Google Scholar]
- Dussault A-A, Pouliot M. Rapid and simple comparison of messenger RNA levels using real-time PCR. Biol Proced Online. 2006;8(1):1–10. doi: 10.1251/bpo114. [DOI] [PMC free article] [PubMed] [Google Scholar]
- Pfaffl MW. A new mathematical model for relative quantification in real-time RT-PCR. Nucleic Acids Res. 2001;29:2002–2007. doi: 10.1093/nar/29.9.e45. [DOI] [PMC free article] [PubMed] [Google Scholar]
- Gilsbach R, Kouta M, Bönisch H, Brüss M. Comparison of in vitro and in vivo reference genes for internal standardization of real-time PCR data. BioTechniques. 2006;40(2):173–177. doi: 10.2144/000112052. [DOI] [PubMed] [Google Scholar]
- Burns MJ, Nixon GJ, Foy CA, Harris N. Standardisation of data from real-time quantitative PCR methods – evaluation of outliers and comparison of calibration curves. BMC Biotechnol. 2005;7:5–31. doi: 10.1186/1472-6750-5-31. [DOI] [PMC free article] [PubMed] [Google Scholar]
- Applied Biosystems User Bulletin #2. ABI PRISM 7700 Sequence Detection System, SUBJECT: Relative Quantitation of Gene Expression: Calculating the Input Amount. 2001, p. 8.
- Swillens S, Goffard J-C, Marechal Y, de Kerchove d'Exaerde A, Housni EH. Instant evaluation of the absolute initial number of cDNA copies from a single real-time PCR curve. Nucleic Acids Res. 2004;32(6):e53. doi: 10.1093/nar/gnh053. [DOI] [PMC free article] [PubMed] [Google Scholar]
- Peirson SN, Butler JN, Foster RG. Experimental validation of novel and conventional approaches to quantitative real-time PCR data analysis. Nucleic Acids Res. 2003;31(14):e73. doi: 10.1093/nar/gng073. [DOI] [PMC free article] [PubMed] [Google Scholar]
- Broackes-Carter F, Mouchel N, Gill D, Hyde S, Bassett J, Harris A. Quantitative CFTR transcript analysis by TaqMan. Temporal regulation of CFTR expression during ovine lung development: implications for CF gene therapy. Hum Mol Genet. 2002;11:125–131. doi: 10.1093/hmg/11.2.125. [DOI] [PubMed] [Google Scholar]
- CellsDirect™ One-Step qRT-PCR Kits for One-Step Real-Time Quantitative RT-PCR from cell lysate. Catalog Nos. 11753-100, 11753-500, 11754-100, 11754-500 Version A 28 November 2005;25-0870:9-26.
- Livak KJ, Schmittgen TD. Analysis of Relative Gene Expression Data Using Real-Time Quantitative PCR and the 2-??CT Method. Methods. 2001;25:402–408. doi: 10.1006/meth.2001.1262. [DOI] [PubMed] [Google Scholar]
- Bustin SA, Nolan T. Pitfalls of Quantitative Real-Time Reverse-Transcription Polymerase Chain Reaction. J Biomolecular Techniques. 2004;15:155–166. [PMC free article] [PubMed] [Google Scholar]
- Chandler DP, Wagnon CA, Bolton H Jr. Reverse Transcriptase (RT) Inhibition of PCR at Low Concentrations of Template and Its Implications for Quantitative RT-PCR. Appl Environ Biol. 1998;64(2):669–677. doi: 10.1128/aem.64.2.669-677.1998. [DOI] [PMC free article] [PubMed] [Google Scholar]
- Mocellin S, Rossi CR, Pilati P, Nitti D, Marincola MM. Quantitative real-time PCR: A Powerful Ally in Cancer Research. Trends Molec Med. 2003;9(5):189–195. doi: 10.1016/S1471-4914(03)00047-9. [DOI] [PubMed] [Google Scholar]
- Vandesompele J. Normalization of Gene Expression using Expressed Alu Repeat Elements qPCR. 2005 Symposium Proceedings ISBN 300016687.
- Buchanan FC, Littlejohn RP, Galloway SM, Crawford AM. Microsatellites and associated repetitive elements in the sheep genome. Mammalian Genome. 1993;4(5):258–264. doi: 10.1007/BF00417432. [DOI] [PubMed] [Google Scholar]
- Primmer CR, Raudsepp T, Chowdhary BP, Møller AP, Ellegren H. Low Frequency of Microsatellites in the Avian Genome. Genome Res. 1997;7:471–482. doi: 10.1101/gr.7.5.471. [DOI] [PubMed] [Google Scholar]
- Grubor B, Meyerholz DK, Lazic T, De Macedo MM, Derscheid RJ, Hostetter JM, Gallup JM, DeMartini JC, Ackermann MR. Regulation of surfactant protein and defensin mRNA expression in cultured ovine type II pneumocytes by all-trans retinoic acid and VEGF. Int J Exp Path. 2006;87:393–403. doi: 10.1111/j.1365-2613.2006.00494.x. [DOI] [PMC free article] [PubMed] [Google Scholar]


