Abstract
Effects of zinc, an endogenous neuromodulator in the central nervous system, on glycine receptors (GlyRs) in retinal ganglion cells were investigated by using the whole-cell voltage-clamp technique. Zn2+ at low concentration (<2 μM) potentiated the glycine-induced chloride current and at higher concentration (>10 μM) suppressed it. This biphasic regulatory action of zinc acted selectively on the fast component of the glycine-induced current mediated by the strychnine-sensitive GlyRs, but not on the slow component mediated by the 5,7-dichlorokynurenic acid-sensitive GlyRs. Dose-response studies showed that 1 μM Zn2+ increased the maximum glycine response (I∝) and shifted the EC50 to the left, suggesting that Zn2+ at low concentrations acts as an allosteric activator of the strychnine-sensitive GlyRs. Zn2+ at a concentration of 100 μM did not alter I∝ and shifted the EC50 to the right, indicating that Zn2+ at high concentrations acts as a competitive inhibitor of the GlyRs. Physiological functions of zinc modulation of GlyRs in retinal ganglion cells are discussed.
Keywords: neurotransmitter, synaptic transmission
The divalent cation Zn2+ is an essential element in animal cells. It is not only a cofactor and structural component of more than 200 enzymes but also is an endogenous neuromodulator (1, 2). In the central nervous system, Zn2+ is found endogenously in the nerve terminals (3), and it is released on nerve stimulation (4, 5). Evidence in recent years suggests that Zn2+ released from nerve terminals can modulate postsynaptic receptors and voltage-gated and ligand-gated channels (1, 2). In this report, we investigated the modulatory actions of zinc on glycine receptors in retinal ganglion cells.
Glycine and γ-aminobutyric acid (GABA) are two major inhibitory neurotransmitters in the central nervous system. Although glycine receptors (GlyR) and GABA receptors (GABAR) are highly homologous, we know much less about GlyR than GABAR. It has been shown that Zn2+ regulates GABAR, and the modulatory action depends greatly on the GABAR subunit composition (6, 7). Early studies suggested that mechanisms of zinc modulation on glycine receptors in different tissues follow different patterns. For example, zinc modulations of glycine responses in rat cerebellar granular cells (8) and rat septal cholinergic neurons (9) are monophasic, and zinc regulation of glycine responses in rat embryonic spinal cord neurons is biphasic (10, 11). In rat olfactory bulb neurons, zinc (100 μM) selectively potentiates the nondesensitizing current but not the steady state of desensitized currents evoked by high concentrations of glycine (12). Furthermore, zinc (100nM–10 μM) increases the responses of rat GlyR α1 in vitro expressed in Xenopus oocytes (13) but biphasically regulates the responses of human GlyR α1 and GlyR α2 expressed in HEK 293 and Xenopus oocytes (10, 11).
In a previous study, two components of glycine responses in retinal ganglion cells were identified based on their pharmacological and kinetic properties (14). One had a fast onset and rapid desensitization, and the other had a slower onset, much more sustained response. The former was sensitive to low concentrations of strychnine, which is the conventional glycine antagonist; the latter was selectively blocked by 500 μM 5,7-dichlorokynurenic acid (DCKA) [a blocker of the glycine recognition site at the N-methyl-d-aspartate receptor at much lower concentrations (15)]. In this study, we examine whether these two components of glycine responses are differentially regulated by zinc. Endogenous zinc associated with synaptic vesicles has been localized with the Neo-Timm staining method in several types of neurons in the retina, including some in inner retina (16–18), and glycine receptors are known to serve major inhibitory functions in retinal ganglion cells (19, 20). Therefore, our study may provide useful information on how Zn2+ shapes ganglion cell responses and how it regulates information processing in the vertebrate retina.
MATERIALS AND METHODS
Cell Preparation.
The isolated retinal cell preparation has been described in earlier publications (14, 21). Briefly, the tiger salamander, Ambystoma tigrinum, (Kons Scientific, Germantown, WI) was decapitated and pithed, and the eyes were removed. The retina was isolated and incubated for about 30–60 min at room temperature (22°C) in 400 μl of enzyme solution containing 20 units/ml lyophilized papain (Worthington, Freehold, NJ), 5 mM l-cysteine, and 400 units/ml DNase I (Worthingotn, Freehold, NJ) in amphibian Ringer’s solution. At the end of the incubation, the retina was rinsed five times with amphibian Ringer’s solution and gently shaken until the tissue dissociated. The cells were placed on a lectin-coated coverslip in a culture dish containing Ringer’s solution and stored in a 17°C incubator. Acutely dissociated cells were used in all experiments. Ganglion cells were identified based on a combination of morphological and physiological characteristics, particularly large soma size and magnitude of the inward sodium current (14). Recordings from the retinal slice preparation indicated that presence of tetrodotoxin-sensitive sodium currents and lack of inwardly rectifying currents could distinguish amacrine and ganglion cells from other neurons (N. Tian and M. Slaughter, personal communication). Generally, sodium currents in ganglion cells exceeded those in amacrine cells. These criteria did not positively exclude amacrine cells, but based on the number of cells studied and the consistency of the results, it is reasonable to conclude they are representative of ganglion cell responses. Some dissociated ganglion cells have portions of the axon and dendrites attached, but under our experimental conditions, it was difficult to distinguish between the somatic and dendritic GlyR.
Electrophysiological Recordings.
The isolated retinal neurons were bath-perfused with amphibian Ringer’s solution consisting of 111 mM NaCl, 3 mM KCl, 2 mM CaCl2, and 1 mM MgCl2, buffered with 5 mM Hepes and NaOH, at pH 7.8. The internal pipette solution contained 110 mM potassium gluconate, 5 mM NaCl, 1 mM MgCl2, and 5 mM EGTA, buffered with 5 mM Hepes and KOH, at pH 7.4. With this internal solution, electrodes had resistance of 5–7 MΩ, and the series resistances were typically 10–20 MΩ (uncompensated). ZnCl2 was used for Zn2+ ions. A rapid perfusion system (BPS-8, ALA Scientific Instruments, Long Island, NY) was used to apply glycine or co-apply glycine and DCKA (Research Biochemicals, Natick, MA). Zn2+ and strychnine were added to the bath solution because of their slow actions. Data were recorded with an Axopatch-200A amplifier in combination with a Pentium II computer and clampex7 software (Axon Instruments, Foster City, CA). Offline analysis and data illustration was done by using origin 5.0 software (Microcal Software, Northampton, MA).
RESULTS
Modulation of Glycine Responses by Zn2+.
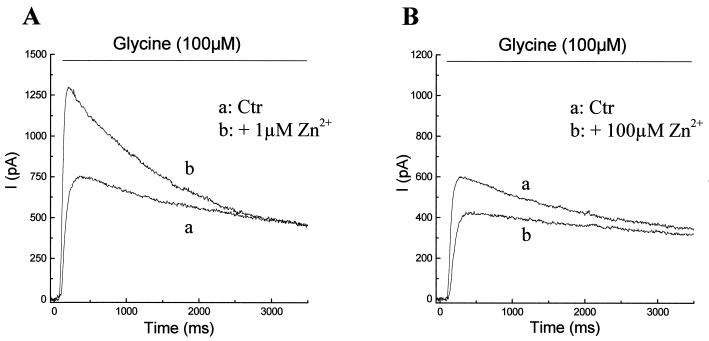
In retinal ganglion cells, glycine induced an outward chloride current at holding potential near 0 mV (Fig. 1; ref. 14). Fig. 1A shows that the peak amplitude of the ganglion cell response to 100 μM glycine was increased from 750 pA (trace a) to 1,300 pA (trace b) by 1 μM Zn2+. On the other hand, Fig. 1B shows that 100 μM Zn2+ decreased the peak glycine responses from 600 pA (trace a) to 400 pA (trace b). This biphasic action on the peak amplitude by Zn2+ was observed in all ganglion cells tested. On average, 1 μM Zn2+ caused a 1.6-fold (1.6 ± 0.1, n = 10) increase in the peak glycine response and 100 μM Zn2+ decreased the peak glycine response to 63% (0.63 ± 0.02, n = 10) of the control level. Zn2+ at either concentration exerted no noticeable effect on late phases of glycine-induced currents. Actions of Zn2+ at both concentrations were reversible on washout and application of Zn2+ alone never induced any current.
Figure 1.
Effects of 1 μM (A) and 100 μM (B) Zn2+ on the current responses to 100 μM glycine in retinal ganglion cells. In each case, current responses were recorded under voltage-clamp conditions at a holding potential of 0 mV. Glycine-induced currents in control Ringer’s solution were presented as trace a, and currents in Ringer’s solution containing 1 μM (A) or 100 μM (B) were shown as trace b.
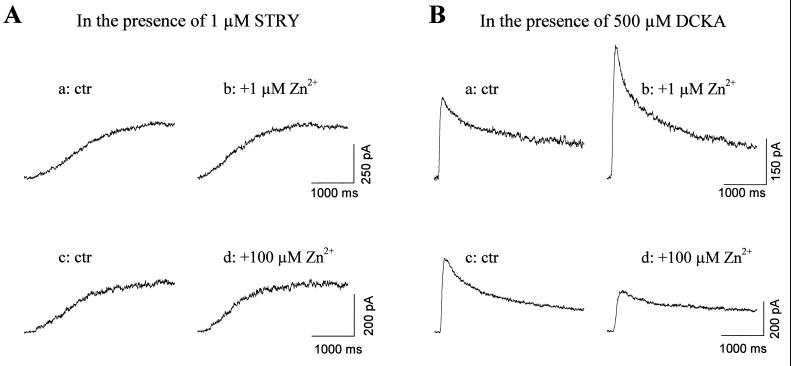
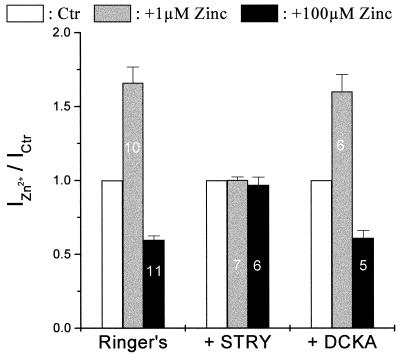
The glycine responses in retinal ganglion cells have been pharmacologically and kinetically separated into two different components, suggesting that these cells contain two subtypes of glycine receptors (14). Other evidence has suggested that these two glycine receptor subtypes may have different molecular subunit compositions (Y.H. and M. Slaughter, unpublished results). It has been known that Zn2+ regulates GABAA receptors, close relatives of the GlyR in the ligand-gated ion channel family, in a way that critically depends on the subunit composition (6, 7). Thus, it is possible that Zn2+ differentially modulates different GlyR subtypes. To further investigate this possibility, the glycine antagonists strychnine and DCKA were used to isolate the fast and slow current components. The fast component was mainly mediated by strychnine-sensitive receptors and the slow component by the DCKA-sensitive receptors (14). In the presence of 1 μM strychnine, which selectively blocks the fast glycine responses (14), the remaining slow component was insensitive to both 1 μM Zn2+ (Fig. 2A a and b) and 100 μM Zn2+ (Fig. 2A c and d). On the other hand, when 500 μM DCKA blocked the slow component, 1 μM Zn2+ potentiated the fast component (Fig. 2B a and b), whereas 100 μM Zn2+ suppressed it (Fig. 2B c and d). Fig. 3 summarizes the results shown in Fig. 1 and 2. The modulatory actions of Zn2+ disappeared completely in the presence of strychnine but were unaffected by DCKA. These results suggest that zinc selectively regulates the strychnine-sensitive GlyR that mediate the fast component of the glycine response. The DCKA-sensitive receptors mediating the slow component are resistant to zinc modulation.
Figure 2.
Differential modulation of glycine receptor subtypes by Zn2+. (A) With 1 μM strychnine, the fast component of the glycine response was blocked (traces a and c), the slow component in 1 μM Zn2+ were shown as trace b, and in 100 μM Zn2+ were shown as trace d. (B) In the presence of 500 μM DCKA, the slow component was blocked (trace a and c), and trace b and d illustrate the fast component in 1 μM Zn2+ and 100 μM Zn2+, respectively. In each case, trace a and b were from the same cell, as were trace c and d. All current responses were recorded under voltage-clamp conditions at a holding potential of 0 mV.
Figure 3.
Histograms of the Zn2+ effects under different conditions, IZn2+/Ictr was used to quantify Zn2+ modulation on glycine-induced currents. The number inside the columns indicates the number of cells tested under those conditions. The bars above the columns represented the SE.
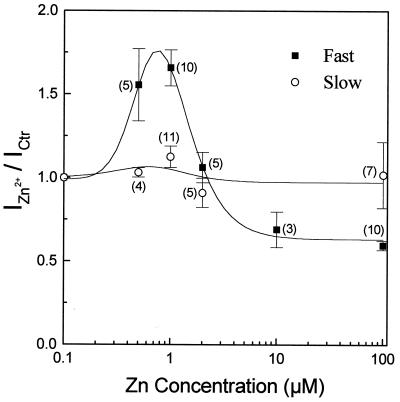
We next examined the Zn2+ concentration dependence of its modulation on glycine-induced currents. Effects of Zn2+ were measured by normalizing the glycine-induced current in the presence of Zn2+ against the current in control Ringer’s solution (IZn2+/Ictr). Because the early peaks of glycine responses were mainly strychnine-sensitive and the late, steady phases were predominately DCKA-sensitive (14), the peak responses were used to represent the fast glycine responses and the plateaus were used to indicate the slow ones. As shown in Fig. 4, in all cells tested, the biphasic modulation by Zn2+ acted on the fast component but not on the slow component of the glycine response. Zn2+ at concentrations <100 nM did not affect the glycine response, and at 0.5–1 μM potentiated glycine responses. Higher concentrations of Zn2+ reduced the potentiation, followed by inhibition of the glycine response at concentrations greater than 2 μM. Consequently, low concentrations of Zn2+ made glycine-induced currents more transient, and high concentrations of Zn2+ made them more sustained (see Fig. 1, for example). Such regulation of the glycine response waveform was observed at all concentrations of zinc tested in this study.
Figure 4.
Dose-related Zn2+ modulation on glycine responses. The fast (peak) component of glycine (■) and the slow (sustained) component (○) responses were plotted against zinc concentration. Each data point represented the mean ± SE from multiple cells. The number near each data point indicates the number of cells tested at that concentration.
Mechanism of Zn2+ Regulation on Fast Component of Glycine Responses.
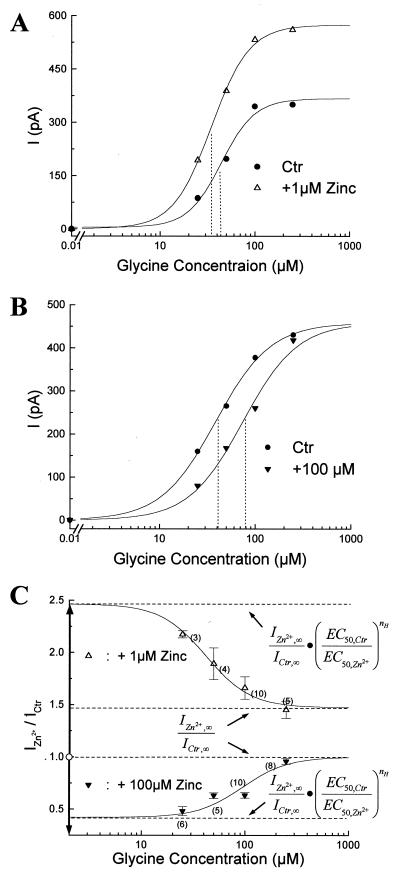
To unravel the mechanism of Zn2+ interaction with the GlyR subtype mediating fast glycine responses, we analyzed Zn2+ modulation on the glycine dose-response relationship. In semilogarithmic dose-response plots, the current responses increased with glycine concentrations following a sigmoidal equation (Fig. 5 A and B, and Eq. 1 in Appendix). The shapes of these dose-response curves in various concentrations of Zn2+ were similar, indicating that Zn2+ did not significantly change the Hill coefficient (nH ≈ 2). Zn2+ (1 μM) facilitated glycine binding to GlyR and shifted EC50 to the left (EC50,Ctr = 43 μM, EC50,Zn2+ = 35 μM), suggesting that Zn2+ at low concentrations acts as an allosteric activator. It also increased the maximum glycine response (Ictr,∝ = 360 pA, IZn2+,∝ = 580 pA) (Fig. 5A). In contrast, 100 μM Zn2+ did not affect the maximum glycine responses, but it acted as a competitive inhibitor for glycine receptors, lowered the apparent glycine affinity, and shifted EC50 to the right (Fig. 5B; EC50,Ctr = 40 μM, EC50,Zn2+ = 74 μM).
Figure 5.
 |
The relationship between Zn2+ modulation on glycine responses and glycine concentration ([Gly]) was studied by plotting IZn2+/ICtr as a function of [Gly] in Fig. 5C. At low concentrations of glycine, 1 μM Zn2+ potentiated the glycine response >2-fold (IZn2+/ICtr = 2.17 ± 0.03, n = 3, at [Gly] = 25 μM). As [Gly] increased, the current potentiation induced by 1 μM Zn2+ decreased progressively, and IZn2+/ICtr reached a steady state level of about 1.45 ± 0.08 (n = 5) at [Gly] = 250 μM. On the other hand, 100 μM Zn2+suppressed the glycine response by more than one-half when low concentrations of glycine were employed (IZn2+/ICtr = 0.48 ± 0.02, n = 6, at [Gly] = 250 μM). The current suppression induced by 100 μM Zn2+ also decreased as [Gly] increased. Eventually, 100 μM Zn2+ lost the inhibitory effect on currents induced by high [Gly] (IZn2+/Ictr = 0.96 ± 0.02, n = 8 at [Gly] = 250 μM). Because Zn2+ changed the apparent glycine affinity but not the Hill coefficient, the IZn2+/ICtr-vs.-[Gly] plot also follows a sigmoidal relationship described by Eq. 3 in the Appendix. By fitting Eq. 3 with data points in Fig. 3C, we found that the apparent glycine affinity increased by ≈30% with 1 μM Zn2+, and decreased by 35% with 100 μM Zn2+ (See Appendix, based on nH = 2). The EC50 for glycine is ≈40 μM with 1 μM Zn2+ and approximately 100 μM with 100 μM Zn2+.
DISCUSSION
Zn2+ Modulation of GlyRs on Retinal Ganglion Cells.
The data presented in this paper constitute demonstration that Zn2+ selectively modulates a subtype of GlyR in retinal ganglion cells and that this modulation is biphasic. At low concentrations, Zn2+ potentiates the glycine-induced currents and at high concentrations suppresses the currents. Such dose-dependent biphasic modulation of GlyRs by Zn2+ have been observed in spinal cord neurons and recombinant GlyRs expressed in HEK 293 cells (10, 11). The concentration ranges of Zn2+ for potentiation and suppression of GlyRs from these other studies are very close to those in our study.
The GlyR is a pentamer, and different subtypes of GlyRs may have different subunit compositions (22–24). Our data show that Zn2+ selectively modulates the strychnine-sensitive GlyRs but not the DCKA-sensitive GlyRs. This is in agreement with the results obtained from other CNS preparations, which suggest that the binding sites for Zn2+ and strychnine are both located in the α-subunit (10, 11). In contrast, the DCKA-sensitive GlyRs may contain different α-subunits or other subunits that block the Zn2+-binding site and thus make them resistant to Zn2+ modulation.
For the strychnine-sensitive GlyRs, Zn2+ may have two binding sites with different affinities because Zn2+ regulates glycine responses biphasically. This idea also is consistent with the results from chimeric constructs of GlyRs (11). At low concentrations, Zn2+ binds to the high-affinity site, which facilitates glycine binding as well as interferes with channel gating, causing the increase of whole-cell conductance. As the concentration increases, Zn2+ binds to the low-affinity site. This binding may be more stable, thus inhibiting Zn2+ binding to the high-affinity site. The low-affinity site may be located somewhere near the glycine-binding pocket, and thus it acts as a competitive inhibitor for the GlyR. In either case, the Hill coefficient of the glycine dose-response curve is not altered by Zn2+, suggesting that the number of glycine molecules required for channel gating is unaffected by Zn2+ modulation.
Physiological Function of Zn2+ Modulation in Retinal Ganglion Cells.
It has been known for a long time that zinc exists in high amounts in the retina (25). Recent studies using the Neo-Timm method have shown that endogenous zinc associated with synaptic vesicles is located in photoreceptors of tiger salamander, fish, and mammalian retinas (16–18). Moreover, these studies revealed zinc-containing processes in the inner plexiform layer, although their cellular origin remains uncertain (16, 18). These results suggest that retinal ganglion cells may be influenced by zinc released from neuronal processes in the inner retina and by zinc diffused from photoreceptors in the distal retina. In hippocampal neurons, vesicular zinc is coreleased with glutamate on membrane depolarization (4, 5). In darkness, photoreceptors are depolarized. Some neurons in the inner retina are depolarized and others are hyperpolarized (26, 27). Therefore, darkness increases zinc release from photoreceptors, and it may increase or decrease zinc release from neuronal processes in the inner retina. In the salamander outer retina, it has been shown that bath application of 5 μM Zn2+ substantially suppresses synaptic transmission between photoreceptors and horizontal cells (16). Therefore, extracellular Zn2+ concentration in dark-adapted retinas under physiological conditions while synaptic transmission is not suppressed must be substantially lower than 5 μM. This leads us to propose that under physiological conditions, Zn2+ released from retinal neurons primarily potentiates glycine responses in ganglion cells by binding to the high-affinity binding site. However, we cannot exclude the possibility that local zinc concentration in some part of the retina is in the high micromolar range. It has been shown that zinc release and uptake vary with neuronal activity (4, 5), and local concentrations of zinc may reach the high micromolar range (300 μM) in the hippocampus (28). If such high zinc concentrations exist near retinal ganglion cells, then Zn2+ may suppress glycine responses by binding to the low-affinity binding site.
Our results (Fig. 1) indicate that low concentrations of Zn2+ made glycine-induced currents more transient and high concentrations of Zn2+ made them more sustained. Because ganglion cells receive glycinergic inputs from transient amacrine cells, which contribute to the antagonistic surround response and motion sensitivity of retinal ganglion cells (20), the dose-dependent biphasic Zn2+ modulation of GlyRs may be used to adjust the center-surround antagonistic receptive field and motion detection capability of retinal ganglion cells.
Acknowledgments
We thank Dr. Roy Jacoby for reading this manuscript. This work is supported by grants from the National Institutes of Health (EY04446), the Retina Research Foundation (Houston), and The Research to Prevent Blindness, Inc.
ABBREVIATIONS
- GlyR
glycine receptor
- GABA
γ-aminobutyric acid
- GABAR
GABA receptor
- DCKA
5,7-dichlorokynurenic acid
Appendix
Glycine dose-response curves are sigmoidal and can be fitted by the following equation:
 |
1 |
When I0 = 0, the above equation becomes:
 |
2 |
If Zn2+ does not change n, the relative current,
 |
3 |
Rearranging parameters in Eq. 3, we obtain
 |
4 |
Comparing Eqs. 1 and 4 shows that the Irelative-vs.-glycine concentration plot is also sigmoidal, with
 |
 |
 |
Footnotes
This paper was submitted directly (Track II) to the Proceedings Office.
References
- 1.Smart T G, Xie X, Krishek B J. Prog Neurobiol. 1994;42:393–341. doi: 10.1016/0301-0082(94)90082-5. [DOI] [PubMed] [Google Scholar]
- 2.Harrison N L, Gibbons S J. Neuropharmacology. 1994;33:935–952. doi: 10.1016/0028-3908(94)90152-x. [DOI] [PubMed] [Google Scholar]
- 3.Slomianka L. Neuroscience. 1992;48:325–352. doi: 10.1016/0306-4522(92)90494-m. [DOI] [PubMed] [Google Scholar]
- 4.Assaf S Y, Chung S H. Nature (London) 1984;308:734–736. doi: 10.1038/308734a0. [DOI] [PubMed] [Google Scholar]
- 5.Howell G A, Welch M G, Frederickson C J. Nature (London) 1984;308:736–738. doi: 10.1038/308736a0. [DOI] [PubMed] [Google Scholar]
- 6.Draguhn A, Verdorn T A, Ewert M, Seeburg P H, Sakmann B. Neuron. 1990;5:781–788. doi: 10.1016/0896-6273(90)90337-f. [DOI] [PubMed] [Google Scholar]
- 7.Smart T G, Moss S J, Xie X, Huganir R L. Br J Pharmacol. 1991;103:1837–1839. doi: 10.1111/j.1476-5381.1991.tb12337.x. [DOI] [PMC free article] [PubMed] [Google Scholar]
- 8.Virginio C, Cherubini E. Brain Res Dev Brain Res. 1997;98:30–40. doi: 10.1016/s0165-3806(96)00164-2. [DOI] [PubMed] [Google Scholar]
- 9.Kumamoto E, Murata Y. J Neurophysiol. 1996;76:227–241. doi: 10.1152/jn.1996.76.1.227. [DOI] [PubMed] [Google Scholar]
- 10.Bloomenthal A B, Goldwater E, Pritchett D B, Harrison N L. Mol Pharmacol. 1994;46:1156–1159. [PubMed] [Google Scholar]
- 11.Laube B, Kuhse J, Rundstrom N, Kirsch J, Schmieden V, Betz H. J Physiol (London) 1995;483:613–619. doi: 10.1113/jphysiol.1995.sp020610. [DOI] [PMC free article] [PubMed] [Google Scholar]
- 12.Trombley P Q, Shepherd G M. J Neurophysiol. 1996;76:2536–2546. doi: 10.1152/jn.1996.76.4.2536. [DOI] [PubMed] [Google Scholar]
- 13.Akagi, H., Majima, T. & Uchiyama, M. (1994) Jpn. J. Physiol.44 Suppl., S91–S96. [PubMed]
- 14.Han Y, Zhang J, Slaughter M M. J Neurosci. 1997;17:3392–3400. doi: 10.1523/JNEUROSCI.17-10-03392.1997. [DOI] [PMC free article] [PubMed] [Google Scholar]
- 15.Kemp J A, Foster A C, Leeson P D, Priestley T, Tridgett R, Iversen L L, Woodruff G N. Proc Natl Acad Sci USA. 1988;85:6547–6550. doi: 10.1073/pnas.85.17.6547. [DOI] [PMC free article] [PubMed] [Google Scholar]
- 16.Wu S M, Qiao X, Noebels J L, Yang X L. Vision Res. 1993;33:2611–2616. doi: 10.1016/0042-6989(93)90219-m. [DOI] [PubMed] [Google Scholar]
- 17.Qian H, Li L, Chappell R L, Ripps H. J Neurophysiol. 1997;78:2402–2412. doi: 10.1152/jn.1997.78.5.2402. [DOI] [PubMed] [Google Scholar]
- 18.Ugarte M, Osborne N N. Gen Pharmacol. 1998;30:297–303. doi: 10.1016/s0306-3623(97)00358-3. [DOI] [PubMed] [Google Scholar]
- 19.Miller R F, Frumkes T E, Slaughter M, Dacheux R F. J Neurophysiol. 1981;45:764–782. doi: 10.1152/jn.1981.45.4.764. [DOI] [PubMed] [Google Scholar]
- 20.Belgum J H, Dvorak D R, McReynolds J S. J Physiol. 1984;354:273–286. doi: 10.1113/jphysiol.1984.sp015375. [DOI] [PMC free article] [PubMed] [Google Scholar]
- 21.Han Y, Slaughter M M. J Physiol (London) 1998;508:681–690. doi: 10.1111/j.1469-7793.1998.681bp.x. [DOI] [PMC free article] [PubMed] [Google Scholar]
- 22.Betz H, Langosch D, Hoch W, Prior P, Pribilla I, Kuhse J, Schmieden, Malosio M L, Matzenbach B, Holzinger F. Adv Exp Med Biol. 1991;287:421–429. doi: 10.1007/978-1-4684-5907-4_37. [DOI] [PubMed] [Google Scholar]
- 23.Betz H. Q Rev Biophys. 1992;25:381–394. doi: 10.1017/s0033583500004340. [DOI] [PubMed] [Google Scholar]
- 24.Betz H, Kuhse J, Fischer M, Schmieden V, Laube B, Kuryatov A L, Meyer G, Bormann J, Rundstrom N. J Physiol (Paris) 1994;88:243–248. doi: 10.1016/0928-4257(94)90087-6. [DOI] [PubMed] [Google Scholar]
- 25.Eckert CD. Fed Proc. 1979;392:872. (abstr.). [Google Scholar]
- 26.Werblin F S, Dowling J E. J Neurophysiol (London) 1969;32:339–355. doi: 10.1152/jn.1969.32.3.339. [DOI] [PubMed] [Google Scholar]
- 27.Kaneko A. J Physiol (London) 1970;207:623–633. doi: 10.1113/jphysiol.1970.sp009084. [DOI] [PMC free article] [PubMed] [Google Scholar]
- 29.Frederickson C J, Klitenick M A, Manton W I, Kirkpatrick J B. Brain Res. 1983;273:335–339. doi: 10.1016/0006-8993(83)90858-2. [DOI] [PubMed] [Google Scholar]


